| Param | Original file | Final file |
|---|---|---|
| Filename | modeM0/AS1T03_068T01_9000002594_17508cztM0_level2.evt | modeM0/AS1T03_068T01_9000002594_17508cztM0_level2_quad_clean.evt |
| Size (bytes) | 483,425,280 | 91,909,440 |
| Size | 461.0 MB | 87.7 MB |
| Events in quadrant A | 3,501,849 | 575,084 |
| Events in quadrant B | 3,545,140 | 578,622 |
| Events in quadrant C | 3,591,598 | 554,182 |
| Events in quadrant D | 3,488,908 | 550,136 |
| Mode M0 | |||
|---|---|---|---|
| Quadrant | BADHDUFLAG | Total packets | Discarded packets |
| A | 0 | 15417 | 2 |
| B | 0 | 15402 | 2 |
| C | 0 | 15436 | 2 |
| D | 0 | 15672 | 2 |
| Mode SS | |||
|---|---|---|---|
| Quadrant | BADHDUFLAG | Total packets | Discarded packets |
| A | 0 | 154 | 0 |
| B | 0 | 154 | 0 |
| C | 0 | 154 | 0 |
| D | 0 | 154 | 0 |
| Mode M9 | |||
|---|---|---|---|
| Quadrant | BADHDUFLAG | Total packets | Discarded packets |
| A | 0 | 16 | 0 |
| B | 0 | 16 | 0 |
| C | 0 | 16 | 0 |
| D | 0 | 16 | 0 |
| Quadrant | Total seconds | Saturated seconds | Saturation percentage |
|---|---|---|---|
| A | 7552 | 54 | 0.715042% |
| B | 7552 | 63 | 0.834216% |
| C | 7553 | 79 | 1.045942% |
| D | 7552 | 44 | 0.582627% |
Noise dominated data is calculated using 1-second bins in cleaned event files. If a bin has >2000 counts, and if more than 50% of those come from <1% of pixels, then it is considered to be noise-dominated and hence unusable.
| Quadrant | # 1 sec bins | Bins with >0 counts | Bins with >2000 counts | High rate bins dominated by noise | Noise dominated (total time) | Noise dominated (detector-on time) | Marked lightcurve |
|---|---|---|---|---|---|---|---|
| A | 9077 | 7553 | 4 | 4 | 0.04% | 0.05% | 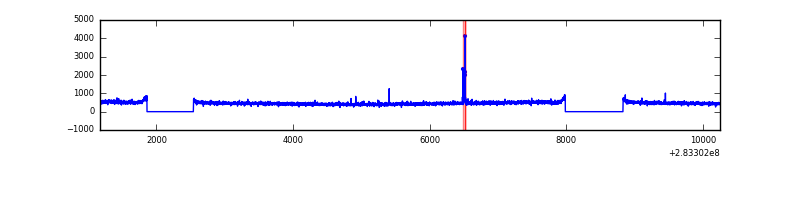 |
| B | 9077 | 7554 | 0 | 0 | 0.00% | 0.00% | 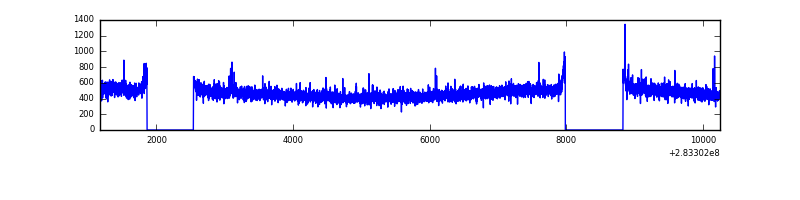 |
| C | 9078 | 7555 | 0 | 0 | 0.00% | 0.00% | 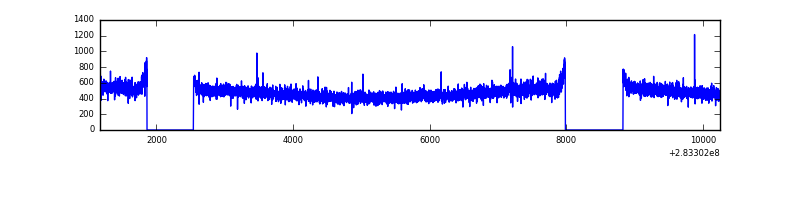 |
| D | 9077 | 7554 | 10 | 10 | 0.11% | 0.13% | 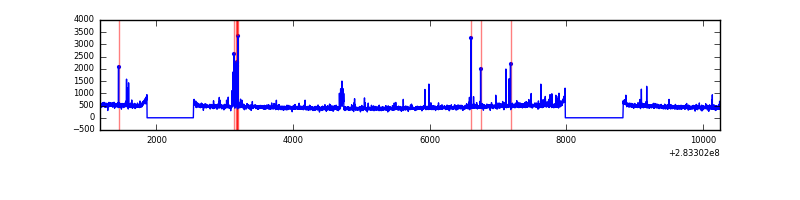 |
Top three noisy pixels from each quadrant. If the there are fewer than three noisy pixels in the level2.evt file, extra rows are filled as -1
| Pixel properties | Quadrant properties | ||||||
|---|---|---|---|---|---|---|---|
| Quadrant | DetID | PixID | Counts | Sigma | Mean | Median | Sigma |
| A | 15 | 174 | 42122 | 225.7 | 900 | 879 | 182.7 |
| A | 0 | 226 | 7658 | 37.1 | 900 | 879 | 182.7 |
| A | 3 | 137 | 6893 | 32.91 | 900 | 879 | 182.7 |
| B | 12 | 111 | 20760 | 114.51 | 901 | 878 | 173.6 |
| B | 11 | 111 | 18175 | 99.62 | 901 | 878 | 173.6 |
| B | 14 | 111 | 14876 | 80.62 | 901 | 878 | 173.6 |
| C | 14 | 238 | 133939 | 653.82 | 870 | 876 | 203.5 |
| C | 3 | 233 | 45207 | 217.83 | 870 | 876 | 203.5 |
| C | 5 | 218 | 22035 | 103.97 | 870 | 876 | 203.5 |
| D | 10 | 70 | 53744 | 247.18 | 881 | 853 | 214.0 |
| D | 13 | 189 | 50768 | 233.27 | 881 | 853 | 214.0 |
| D | 7 | 238 | 26424 | 119.5 | 881 | 853 | 214.0 |
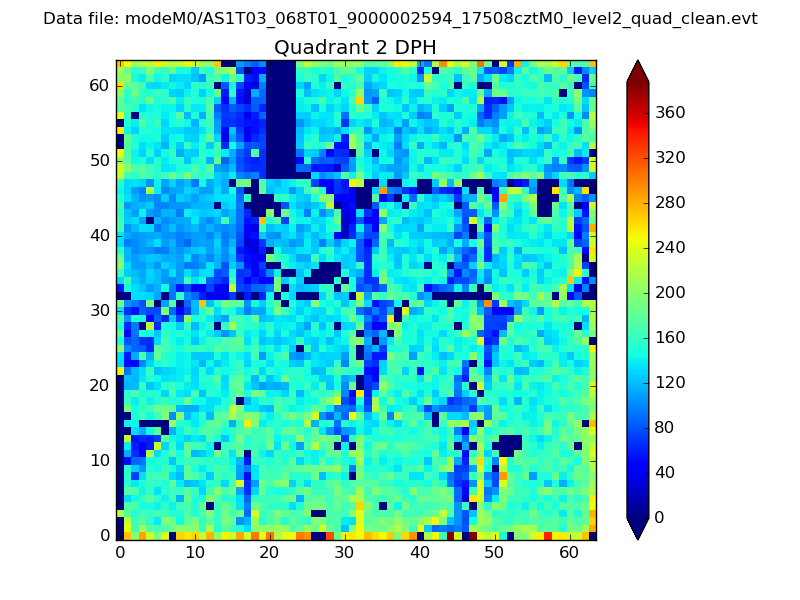
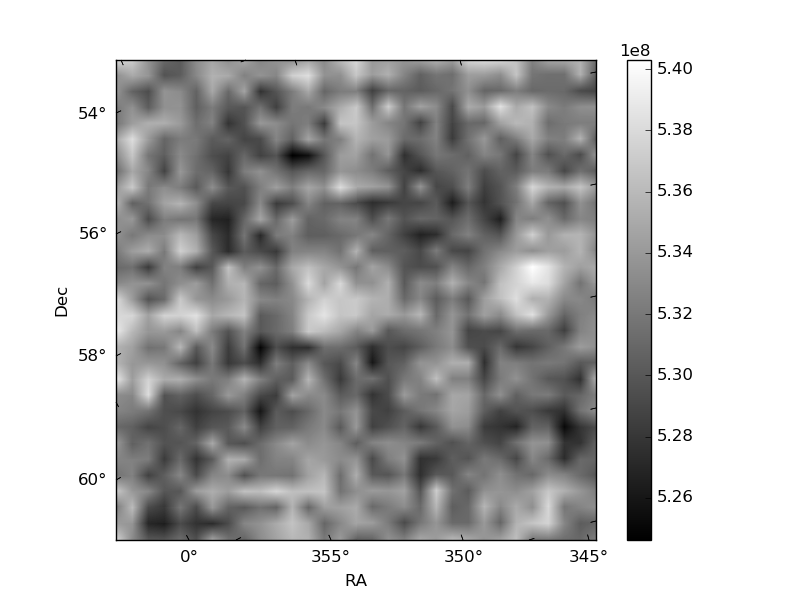
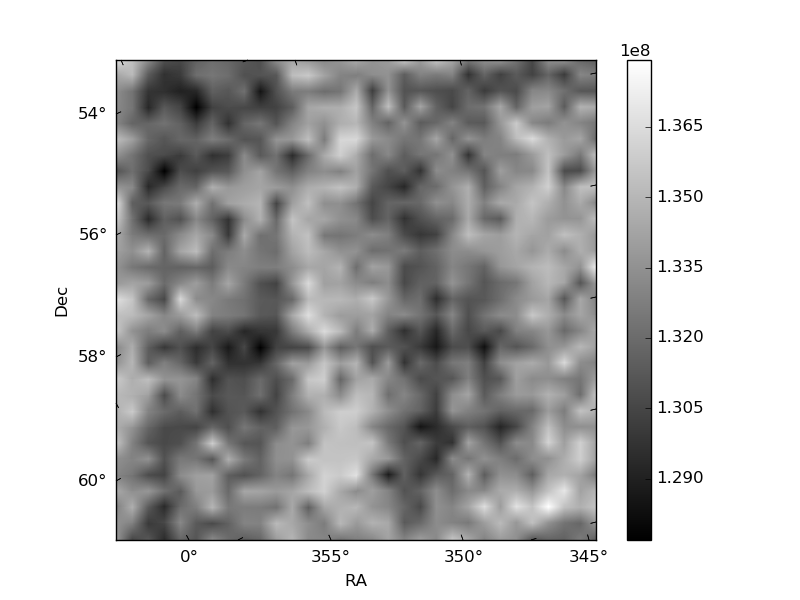
Histogram calculated using DETX and DETY for each event in the final _common_clean file
| Quadrant A | 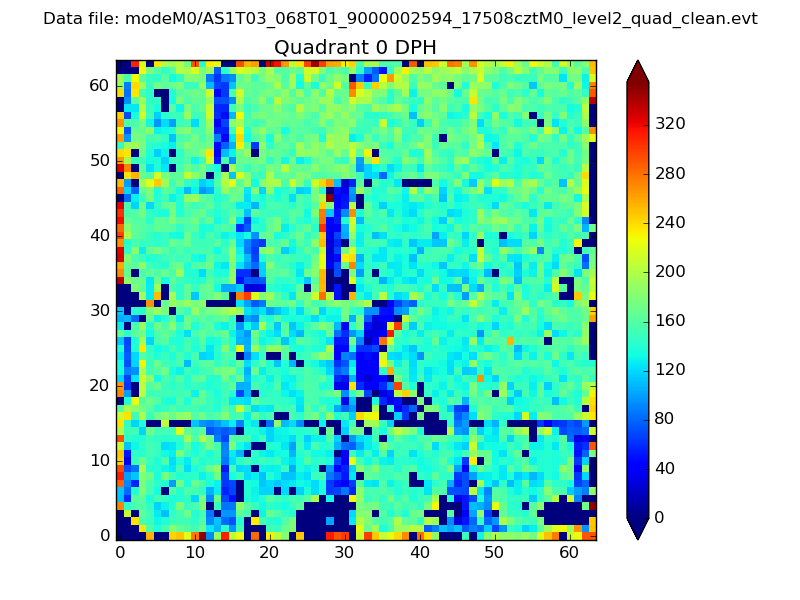 |
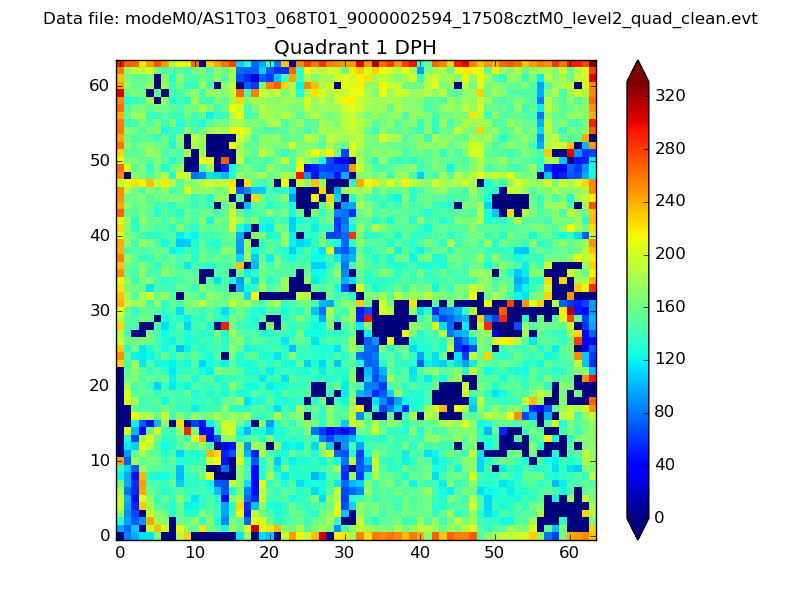 |
Quadrant B |
|---|---|---|---|
| Quadrant D | 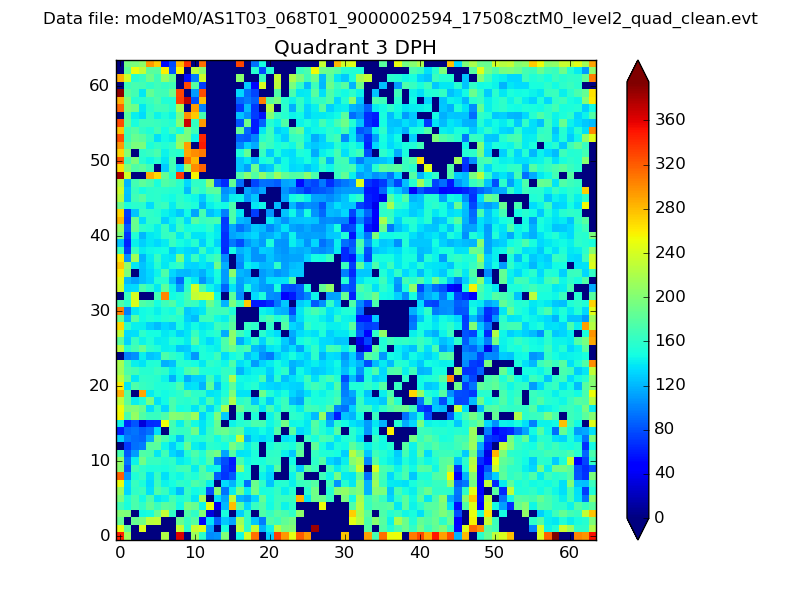 |
 |
Quadrant C |
| Plot type | Count rate plots | Images |
|---|---|---|
| Comparison with Poisson distribution Blue bars denote a histogram of data divided into 1 sec bins. Red curve is a Poisson curve with rate = median count rate of data. |
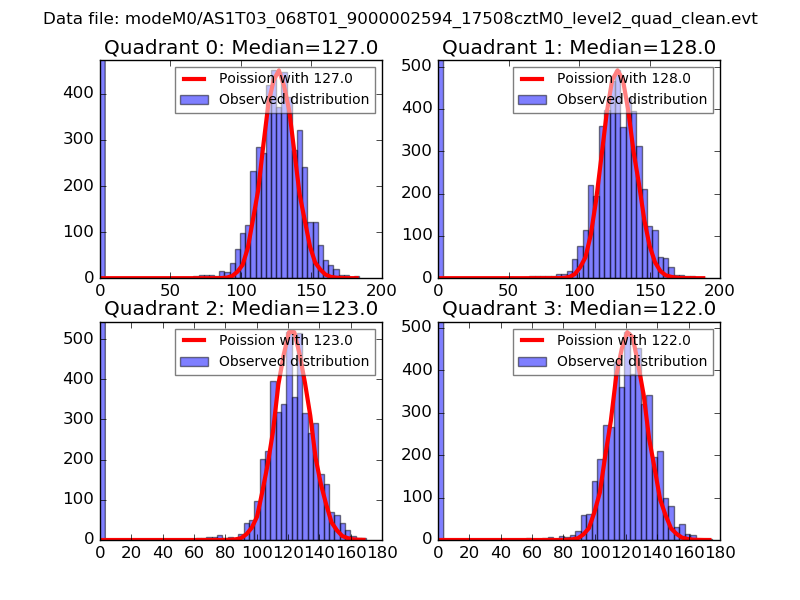 |
 |
| Quadrant-wise count rates Data is divided into 100 sec bins |
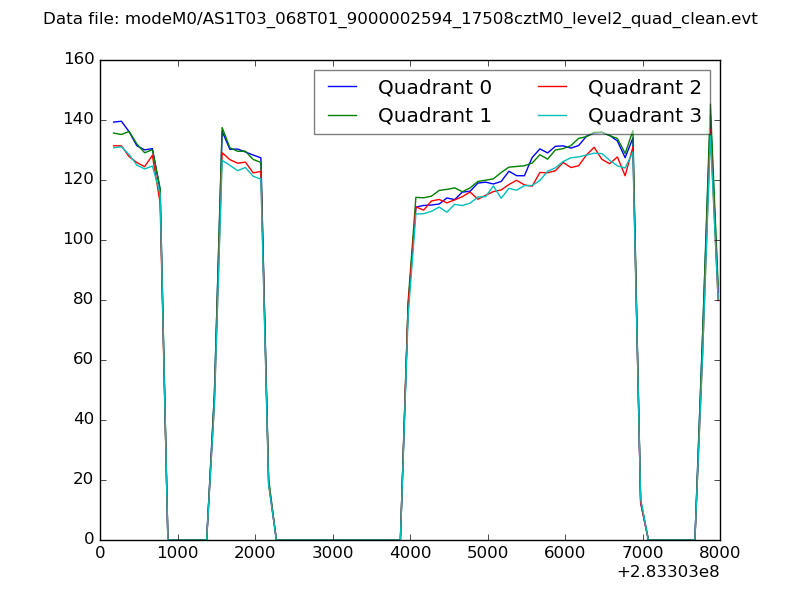 |
|
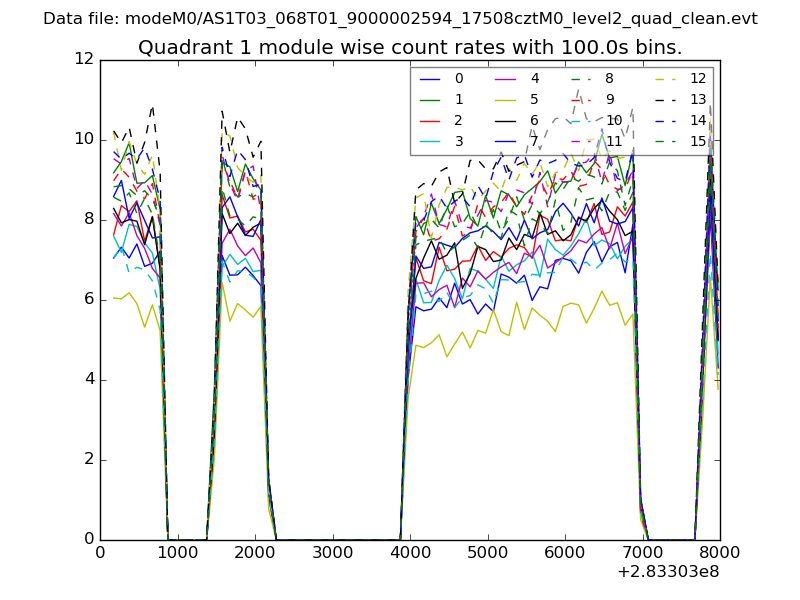
| Module-wise count rates for Quadrant A Data is divided into 100 sec bins |
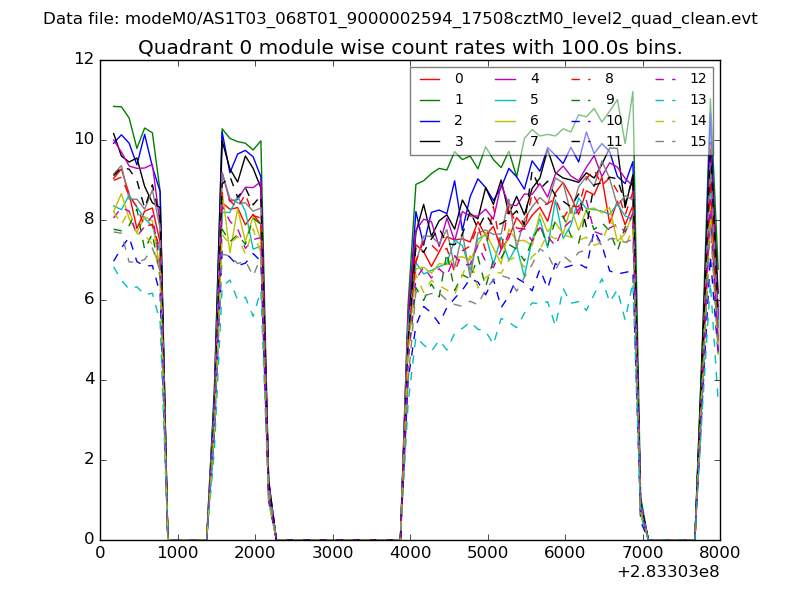 |
 |
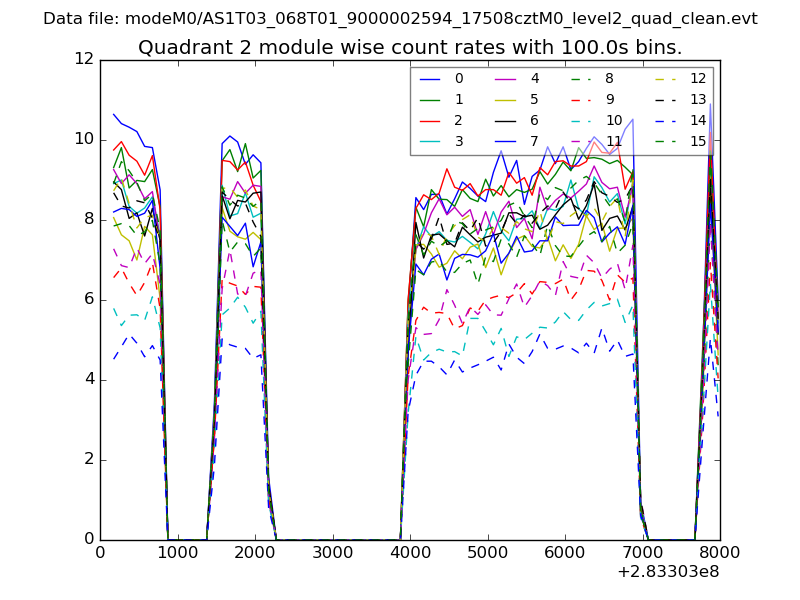
| Module-wise count rates for Quadrant B Data is divided into 100 sec bins |
 |
 |
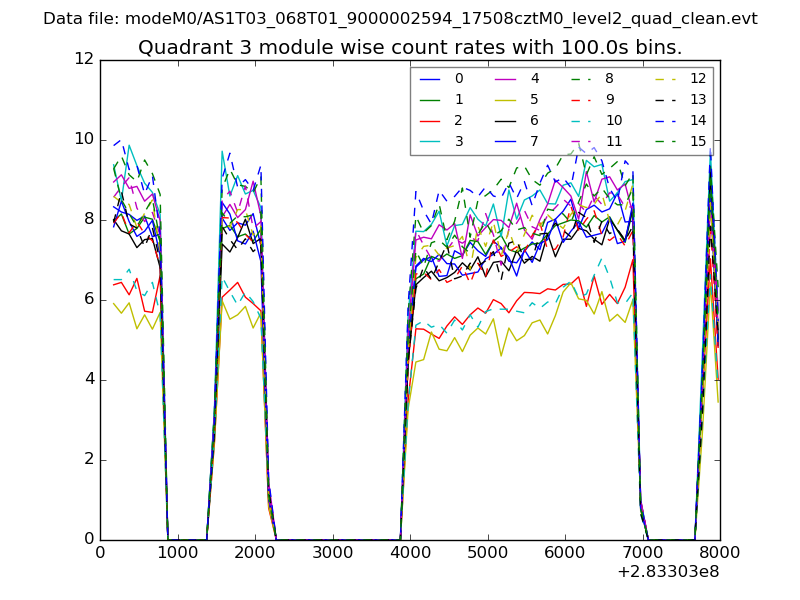
| Module-wise count rates for Quadrant C Data is divided into 100 sec bins |
 |
 |
| Module-wise count rates for Quadrant D Data is divided into 100 sec bins |
 |
 |
| Parameter | Plot |
|---|---|
| CZT HV Monitor | 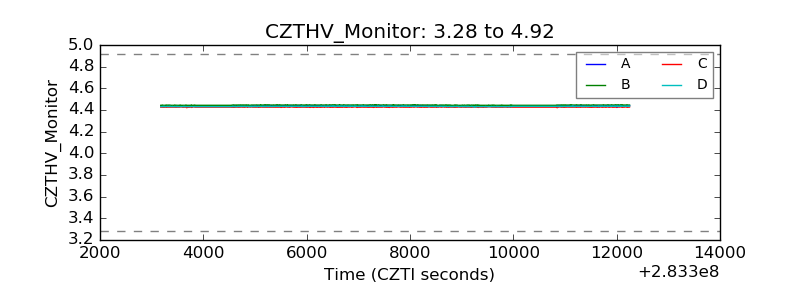 |
| D_VDD | 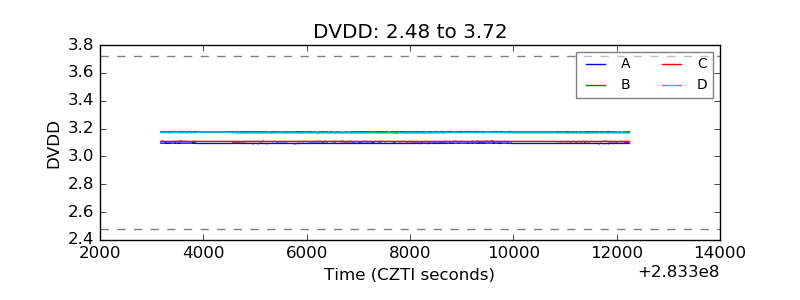 |
| Temperature 1 | 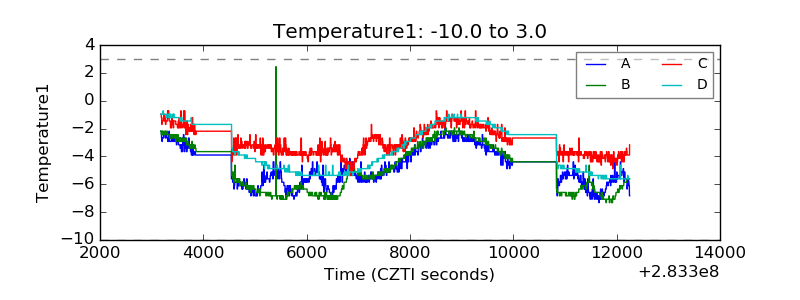 |
| Veto HV Monitor | 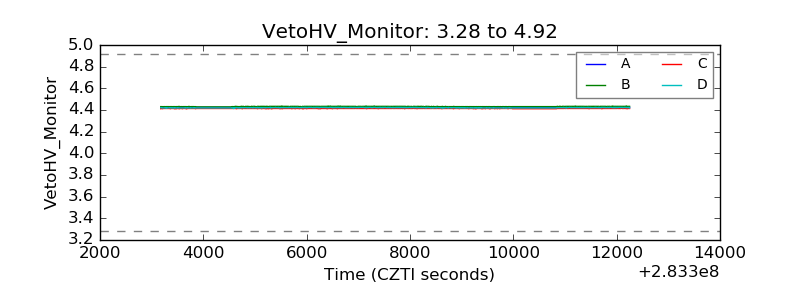 |
| Veto LLD | 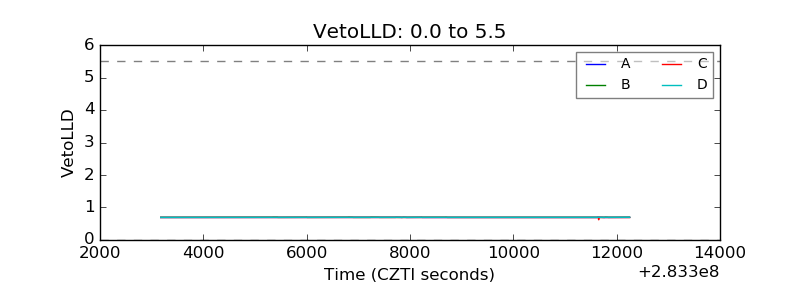 |
| Alpha Counter | 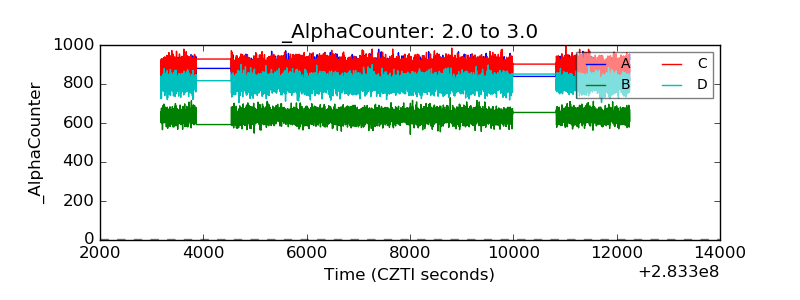 |
| _CPM_Rate | 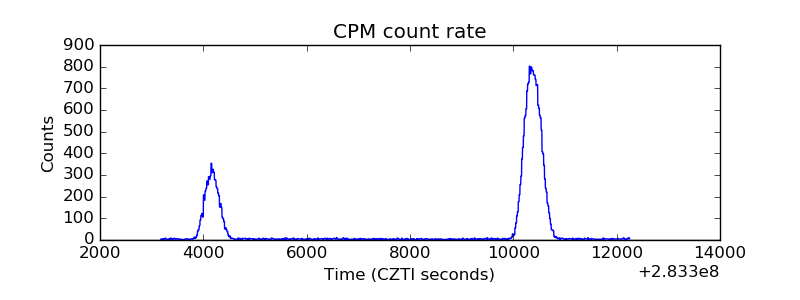 |
| CZT Counter | 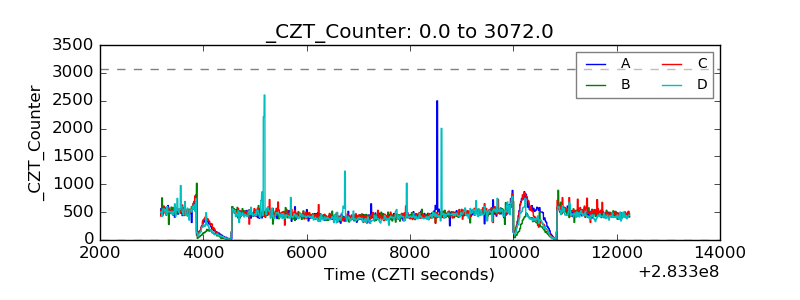 |
| +2.5 Volts monitor |  |
| +5 Volts monitor |  |
| _ROLL_ROT | 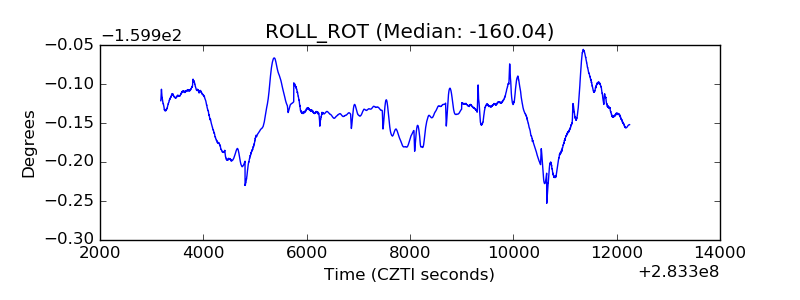 |
| _Roll_DEC | 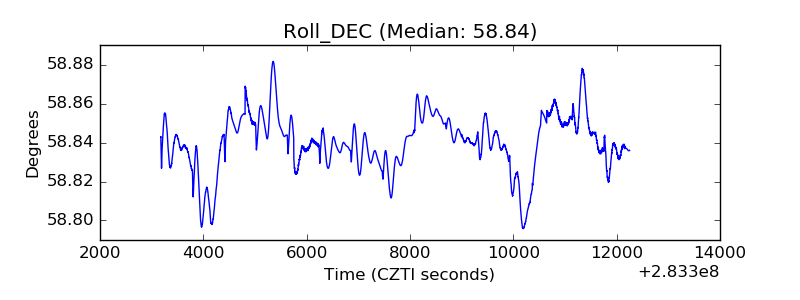 |
| _Roll_RA | 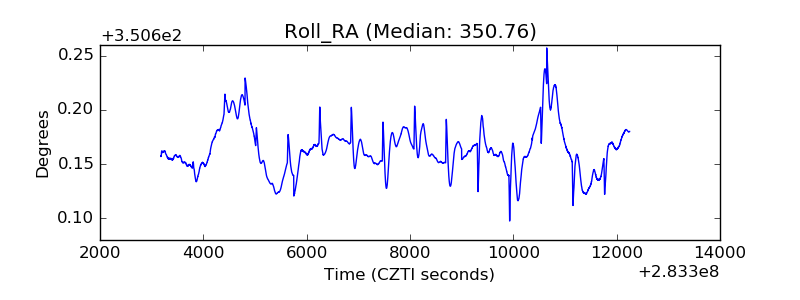 |
| Veto Counter | 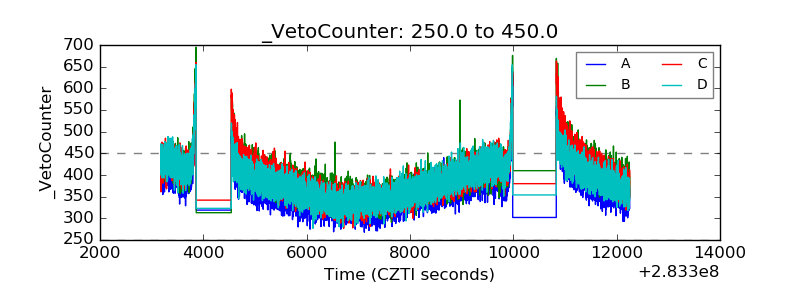 |