| Param | Original file | Final file |
|---|---|---|
| Filename | modeM0/AS1T03_068T01_9000002594_17515cztM0_level2.evt | modeM0/AS1T03_068T01_9000002594_17515cztM0_level2_quad_clean.evt |
| Size (bytes) | 444,542,400 | 114,981,120 |
| Size | 423.9 MB | 109.7 MB |
| Events in quadrant A | 3,240,966 | 788,934 |
| Events in quadrant B | 3,206,408 | 788,598 |
| Events in quadrant C | 3,183,572 | 734,347 |
| Events in quadrant D | 3,402,885 | 730,420 |
| Mode M0 | |||
|---|---|---|---|
| Quadrant | BADHDUFLAG | Total packets | Discarded packets |
| A | 0 | 13502 | 2 |
| B | 0 | 13358 | 2 |
| C | 0 | 13240 | 3 |
| D | 0 | 14140 | 2 |
| Mode SS | |||
|---|---|---|---|
| Quadrant | BADHDUFLAG | Total packets | Discarded packets |
| A | 0 | 128 | 0 |
| B | 0 | 128 | 0 |
| C | 0 | 128 | 0 |
| D | 0 | 128 | 0 |
| Mode M9 | |||
|---|---|---|---|
| Quadrant | BADHDUFLAG | Total packets | Discarded packets |
| A | 0 | 13 | 0 |
| B | 0 | 14 | 0 |
| C | 0 | 14 | 0 |
| D | 0 | 14 | 0 |
| Quadrant | Total seconds | Saturated seconds | Saturation percentage |
|---|---|---|---|
| A | 6309 | 138 | 2.187351% |
| B | 6309 | 121 | 1.917895% |
| C | 6308 | 125 | 1.981611% |
| D | 6308 | 204 | 3.233989% |
Noise dominated data is calculated using 1-second bins in cleaned event files. If a bin has >2000 counts, and if more than 50% of those come from <1% of pixels, then it is considered to be noise-dominated and hence unusable.
| Quadrant | # 1 sec bins | Bins with >0 counts | Bins with >2000 counts | High rate bins dominated by noise | Noise dominated (total time) | Noise dominated (detector-on time) | Marked lightcurve |
|---|---|---|---|---|---|---|---|
| A | 7579 | 6310 | 10 | 10 | 0.13% | 0.16% | 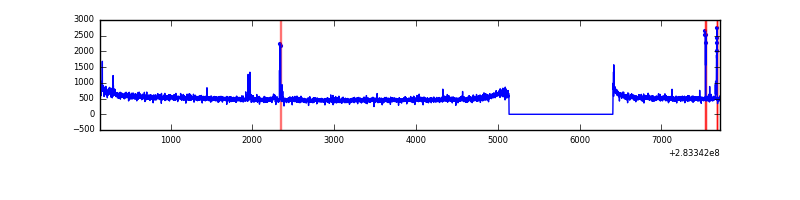 |
| B | 7579 | 6309 | 1 | 1 | 0.01% | 0.02% | 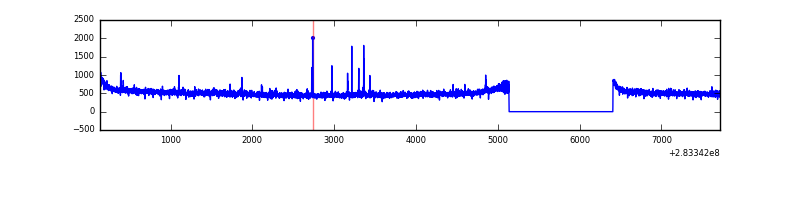 |
| C | 7578 | 6309 | 0 | 0 | 0.00% | 0.00% | 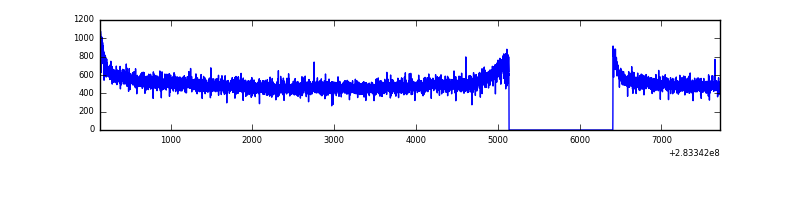 |
| D | 7578 | 6309 | 81 | 81 | 1.07% | 1.28% | 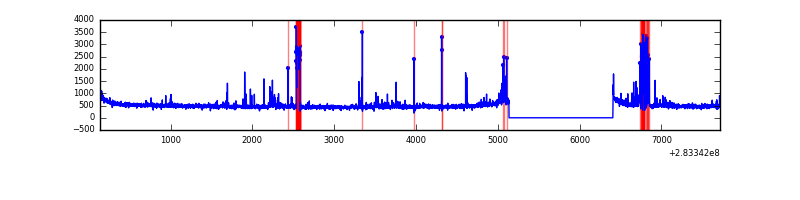 |
Top three noisy pixels from each quadrant. If the there are fewer than three noisy pixels in the level2.evt file, extra rows are filled as -1
| Pixel properties | Quadrant properties | ||||||
|---|---|---|---|---|---|---|---|
| Quadrant | DetID | PixID | Counts | Sigma | Mean | Median | Sigma |
| A | 15 | 174 | 66653 | 400.78 | 826 | 811 | 164.3 |
| A | 0 | 226 | 7415 | 40.2 | 826 | 811 | 164.3 |
| A | 12 | 194 | 6138 | 32.43 | 826 | 811 | 164.3 |
| B | 12 | 111 | 17228 | 107.7 | 811 | 794 | 152.6 |
| B | 11 | 111 | 14975 | 92.93 | 811 | 794 | 152.6 |
| B | 14 | 111 | 12484 | 76.61 | 811 | 794 | 152.6 |
| C | 14 | 238 | 122793 | 690.84 | 770 | 776 | 176.6 |
| C | 3 | 233 | 49706 | 277.04 | 770 | 776 | 176.6 |
| C | 5 | 218 | 6734 | 33.73 | 770 | 776 | 176.6 |
| D | 13 | 189 | 202872 | 1074.01 | 791 | 770 | 188.2 |
| D | 7 | 38 | 114807 | 606.02 | 791 | 770 | 188.2 |
| D | 1 | 52 | 50566 | 264.63 | 791 | 770 | 188.2 |
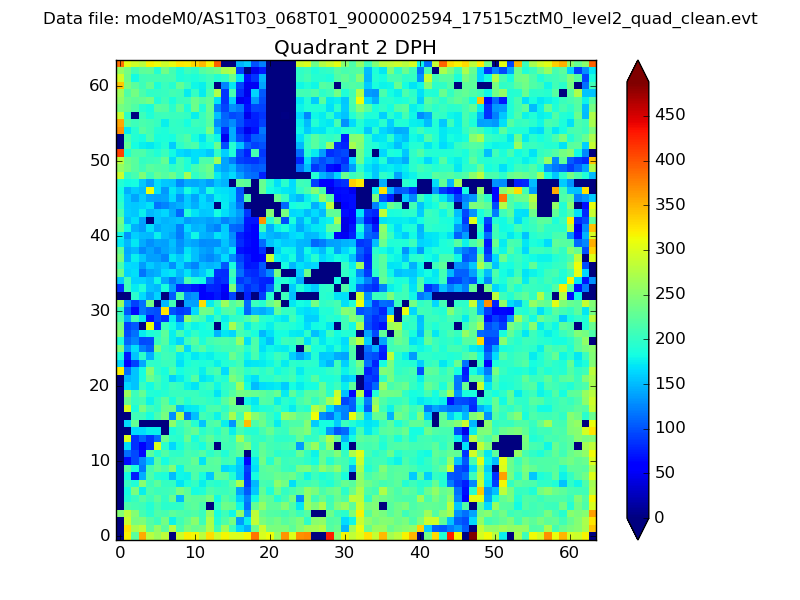
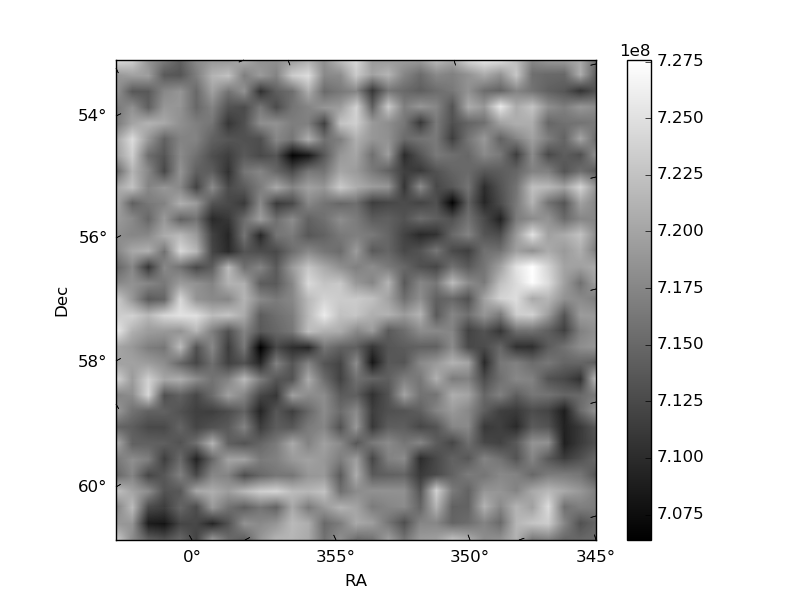
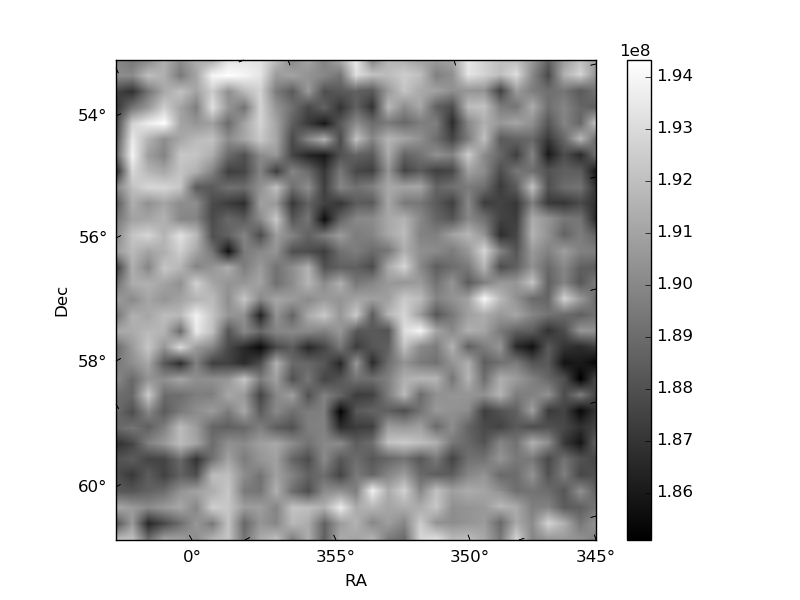
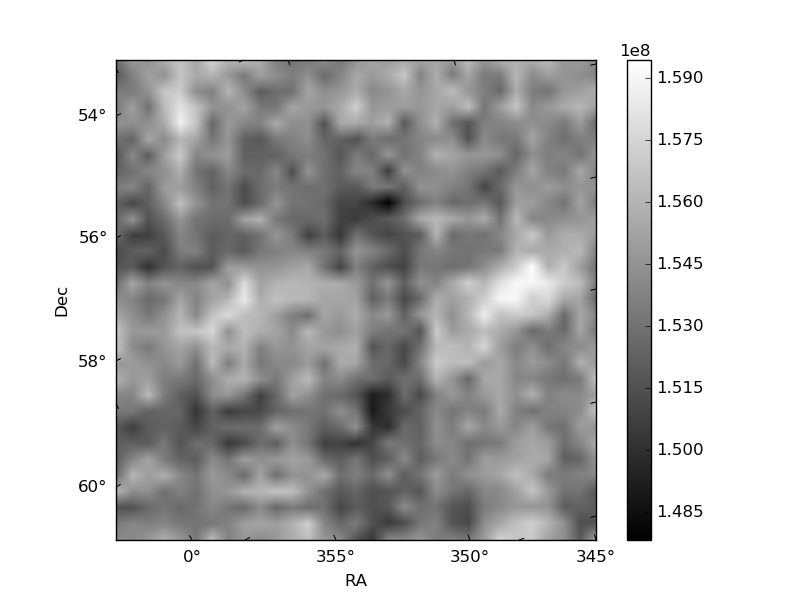
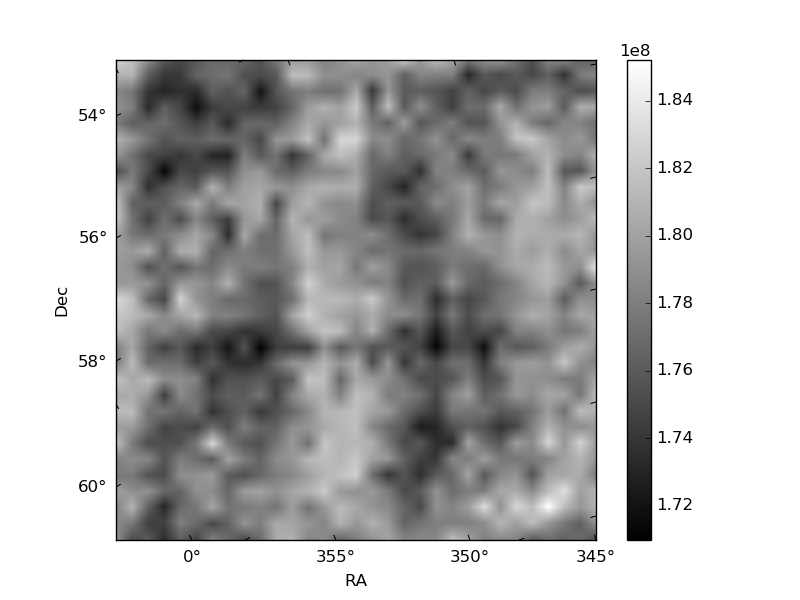
Histogram calculated using DETX and DETY for each event in the final _common_clean file
| Quadrant A | 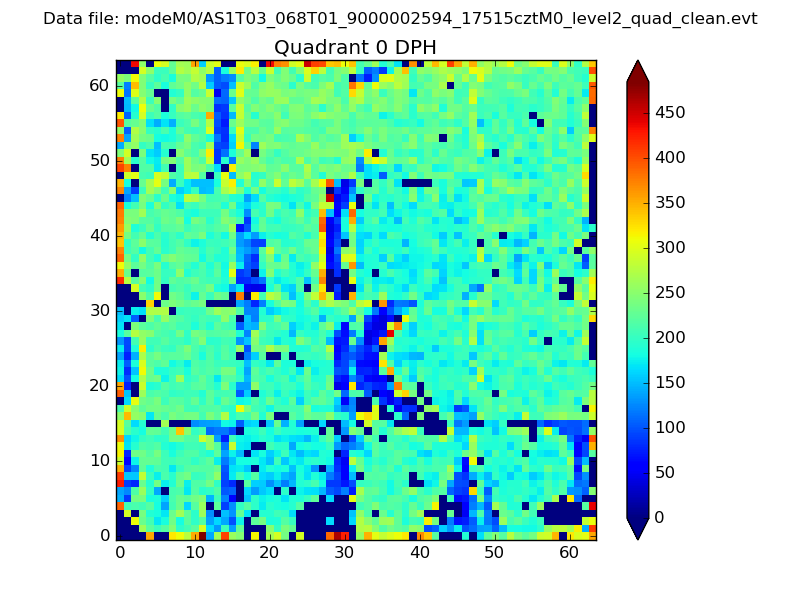 |
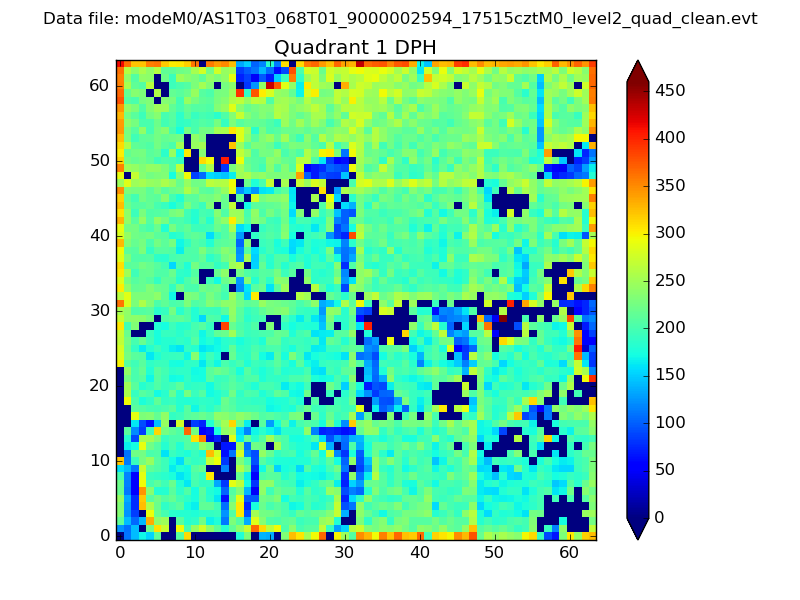 |
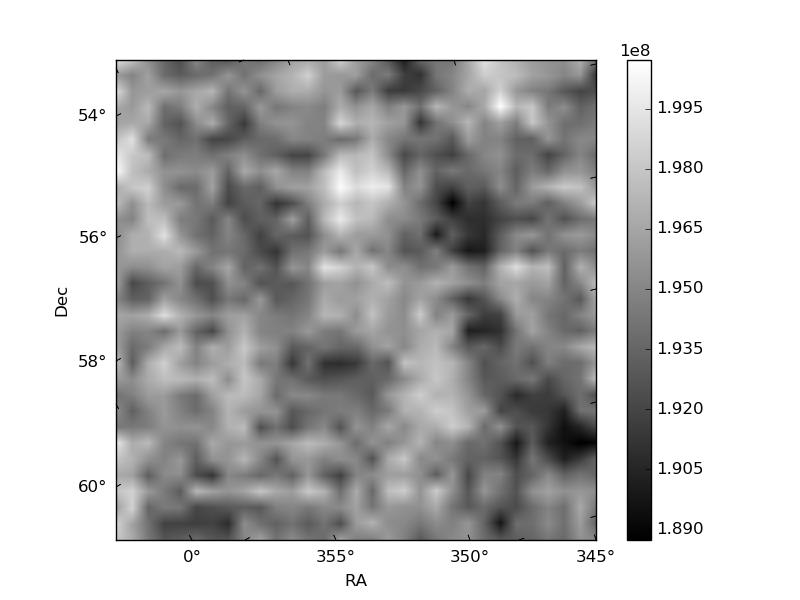
Quadrant B |
|---|---|---|---|
| Quadrant D | 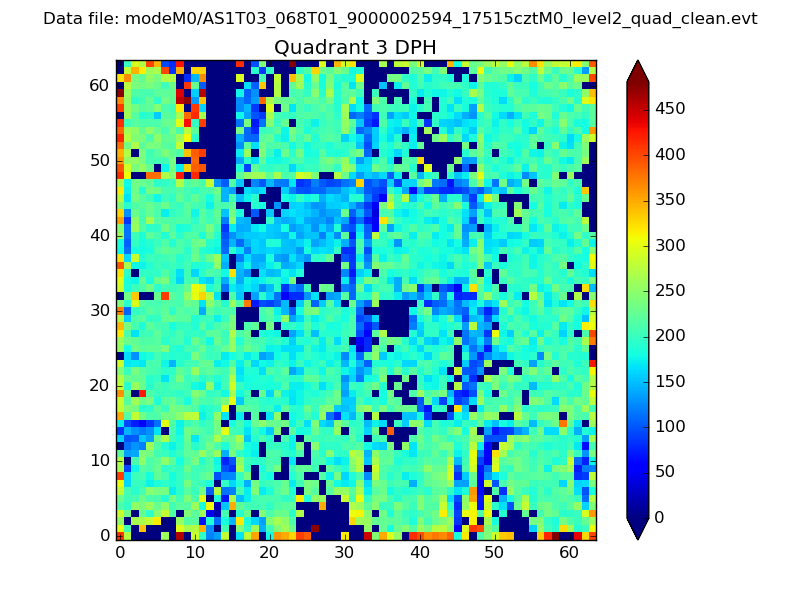 |
 |
Quadrant C |
| Plot type | Count rate plots | Images |
|---|---|---|
| Comparison with Poisson distribution Blue bars denote a histogram of data divided into 1 sec bins. Red curve is a Poisson curve with rate = median count rate of data. |
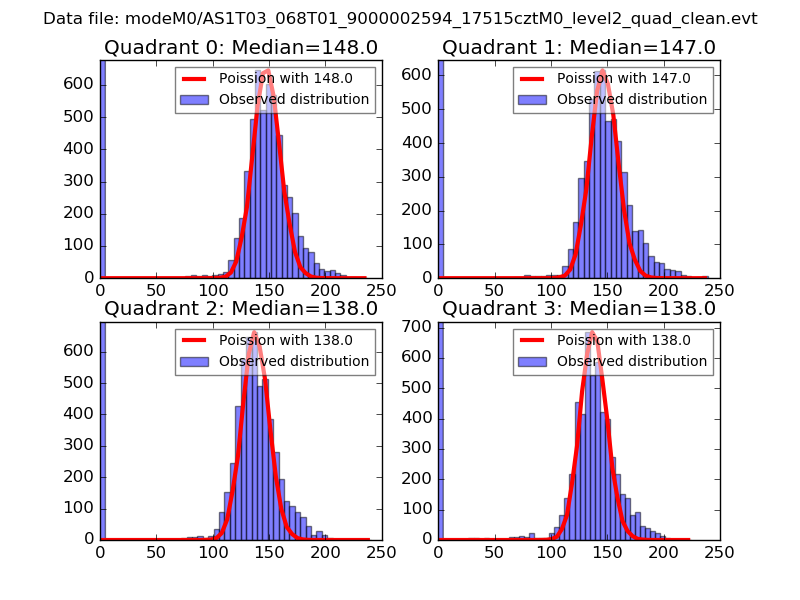 |
 |
| Quadrant-wise count rates Data is divided into 100 sec bins |
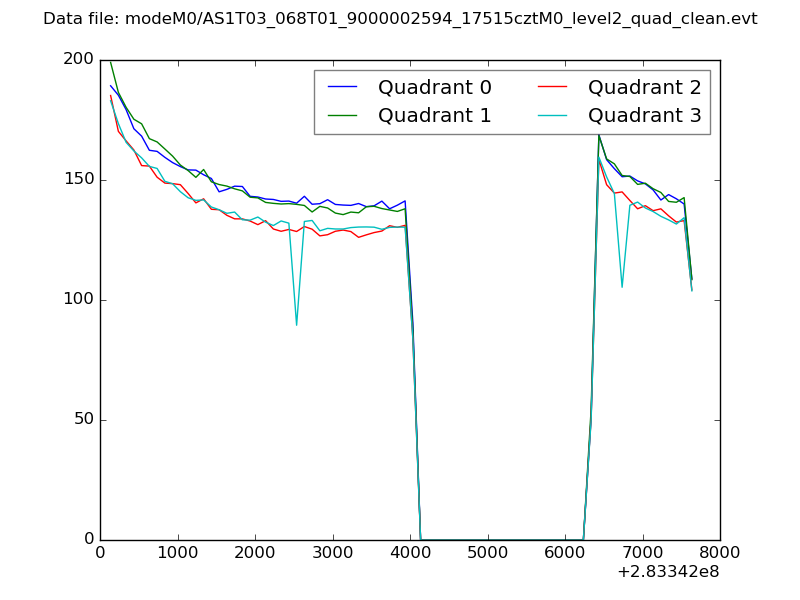 |
|
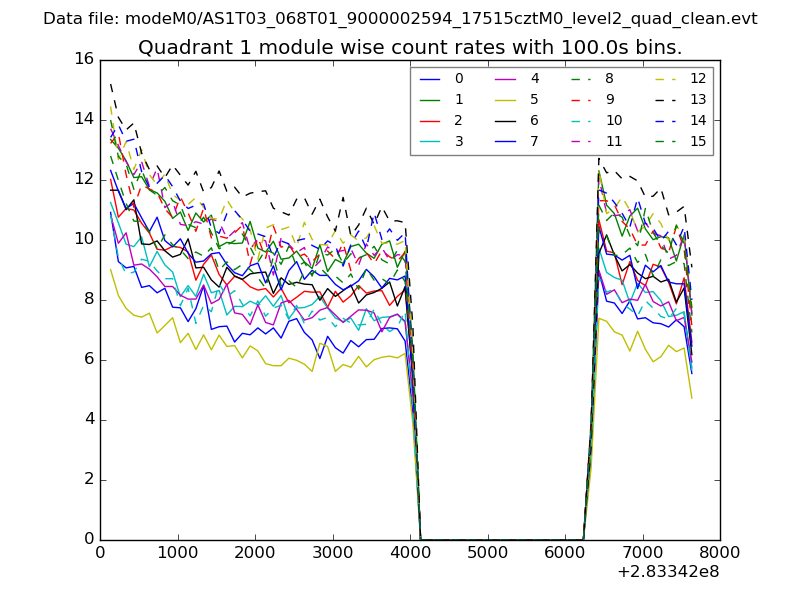
| Module-wise count rates for Quadrant A Data is divided into 100 sec bins |
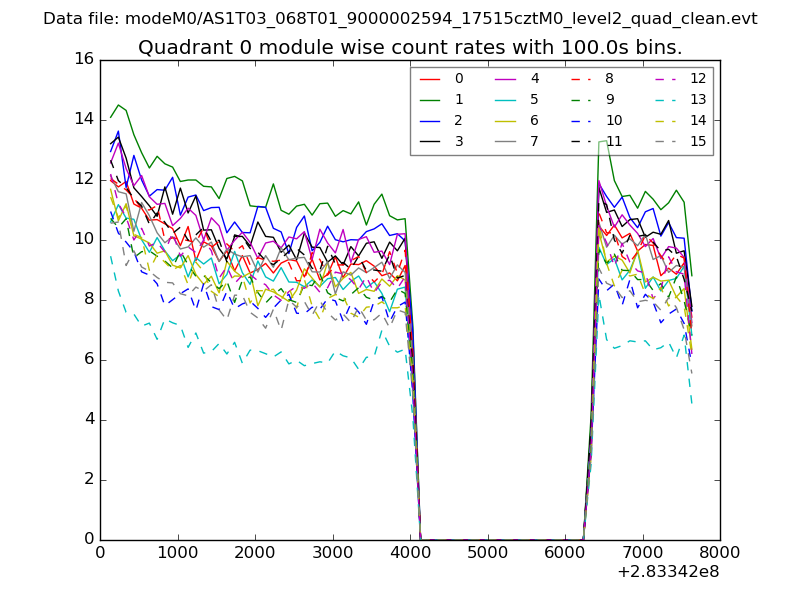 |
 |
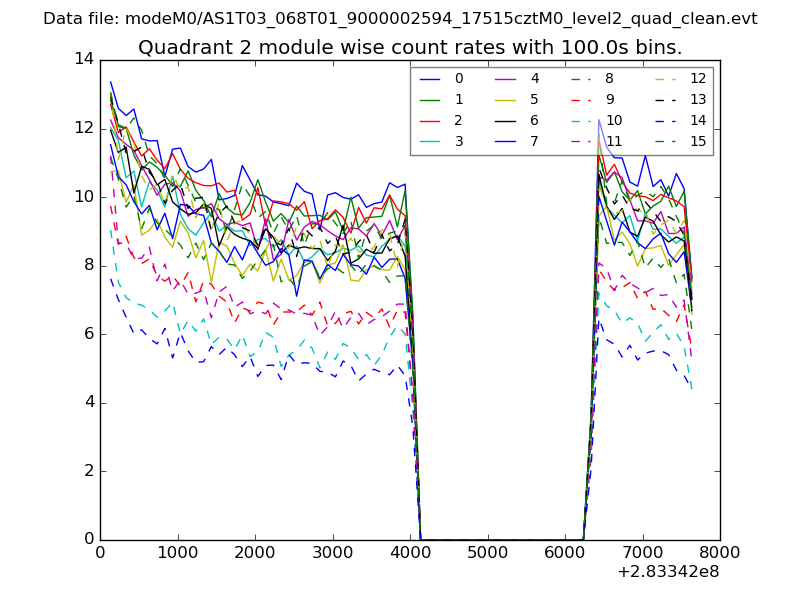
| Module-wise count rates for Quadrant B Data is divided into 100 sec bins |
 |
 |
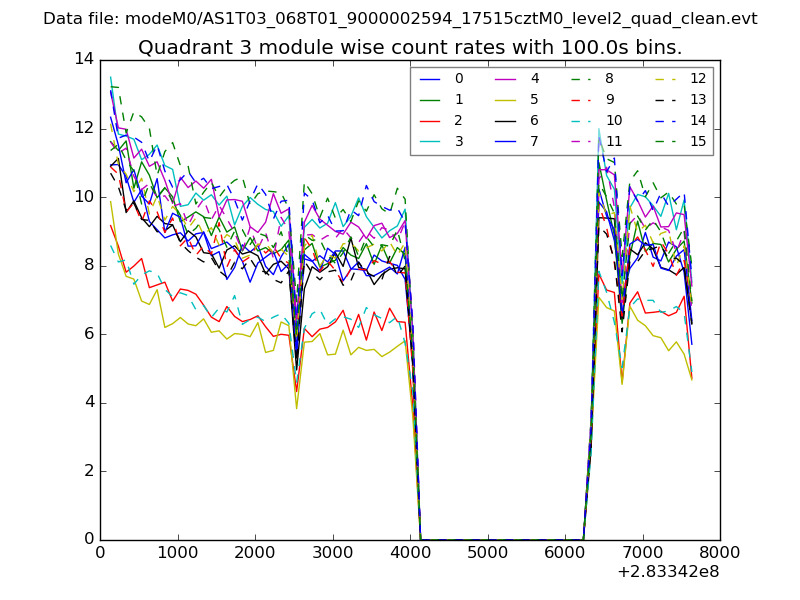
| Module-wise count rates for Quadrant C Data is divided into 100 sec bins |
 |
 |
| Module-wise count rates for Quadrant D Data is divided into 100 sec bins |
 |
 |
| Parameter | Plot |
|---|---|
| CZT HV Monitor | 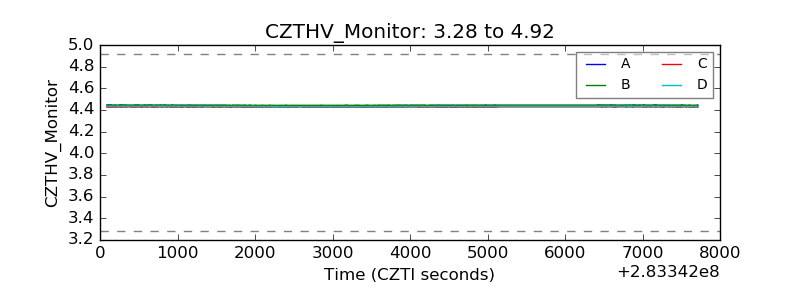 |
| D_VDD | 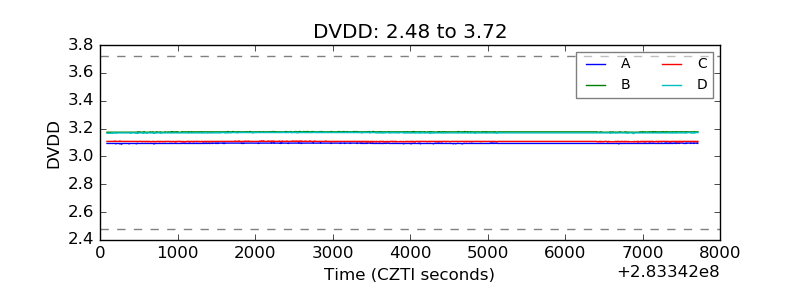 |
| Temperature 1 |  |
| Veto HV Monitor | 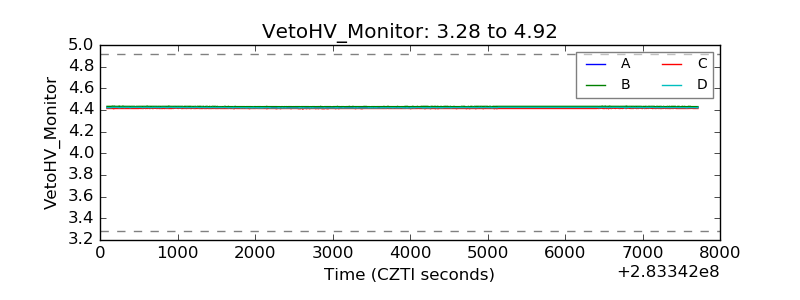 |
| Veto LLD | 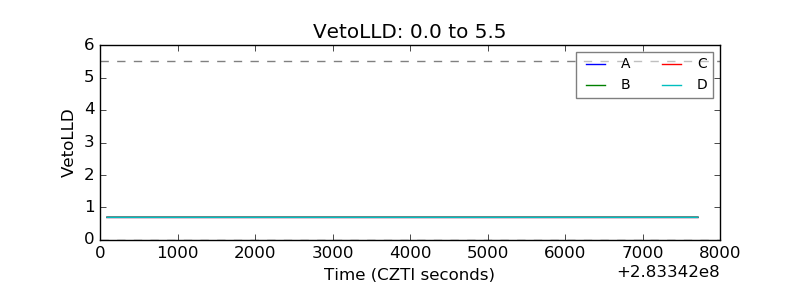 |
| Alpha Counter | 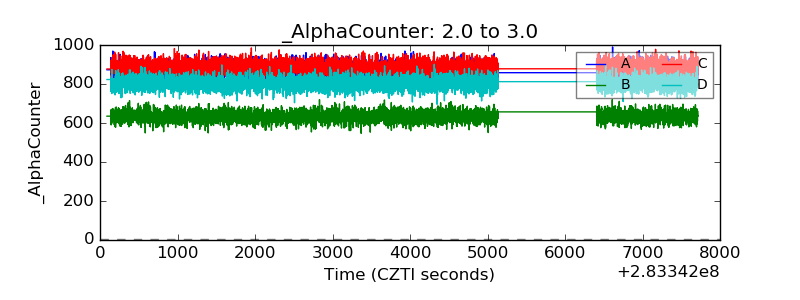 |
| _CPM_Rate | 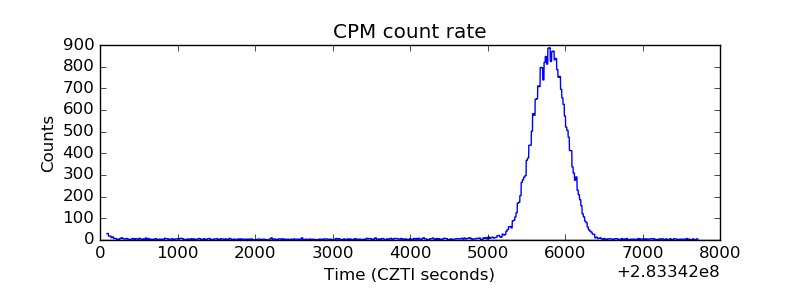 |
| CZT Counter | 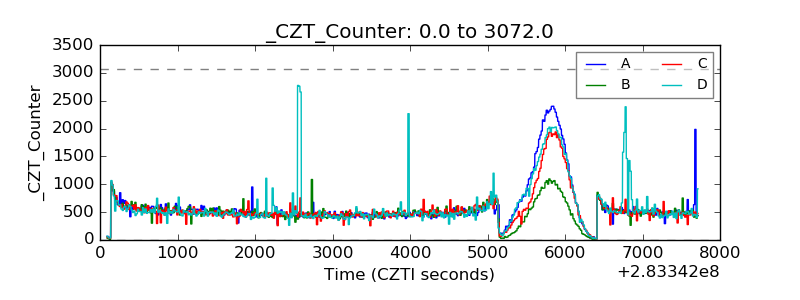 |
| +2.5 Volts monitor |  |
| +5 Volts monitor |  |
| _ROLL_ROT | 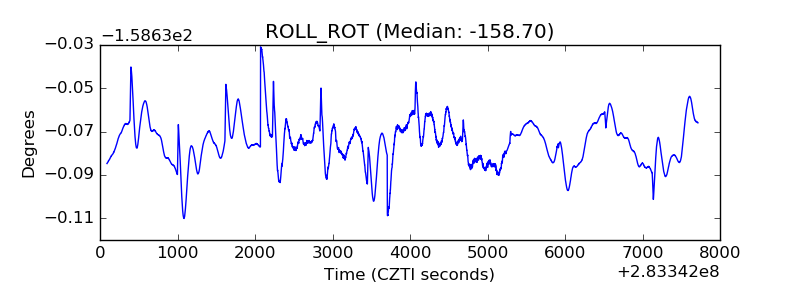 |
| _Roll_DEC |  |
| _Roll_RA | 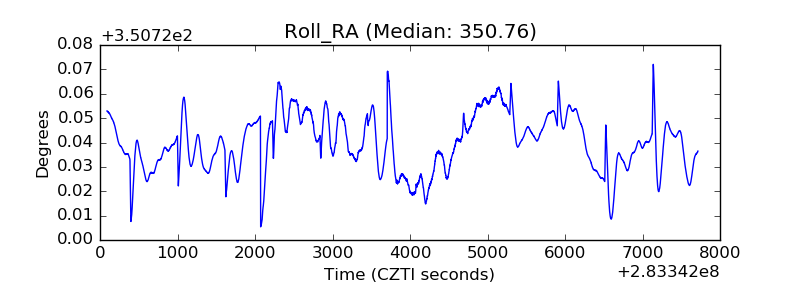 |
| Veto Counter | 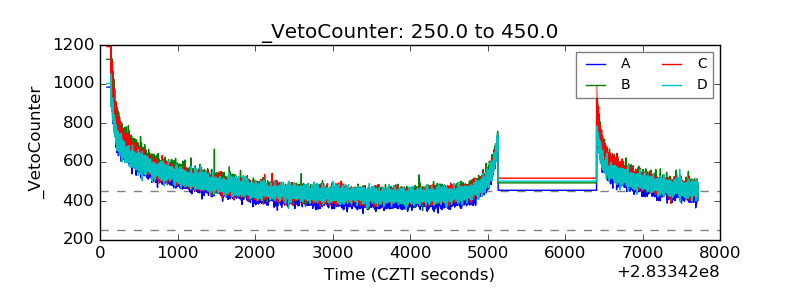 |