| Param | Original file | Final file |
|---|---|---|
| Filename | modeM0/AS1T03_068T01_9000002594_17516cztM0_level2.evt | modeM0/AS1T03_068T01_9000002594_17516cztM0_level2_quad_clean.evt |
| Size (bytes) | 191,099,520 | 57,841,920 |
| Size | 182.2 MB | 55.2 MB |
| Events in quadrant A | 1,396,398 | 401,336 |
| Events in quadrant B | 1,372,335 | 399,817 |
| Events in quadrant C | 1,349,470 | 374,772 |
| Events in quadrant D | 1,474,807 | 373,455 |
| Mode M0 | |||
|---|---|---|---|
| Quadrant | BADHDUFLAG | Total packets | Discarded packets |
| A | 0 | 5929 | 1 |
| B | 0 | 5837 | 1 |
| C | 0 | 5780 | 1 |
| D | 0 | 6299 | 1 |
| Mode SS | |||
|---|---|---|---|
| Quadrant | BADHDUFLAG | Total packets | Discarded packets |
| A | 0 | 56 | 0 |
| B | 0 | 56 | 0 |
| C | 0 | 56 | 0 |
| D | 0 | 56 | 0 |
| Mode M9 | |||
|---|---|---|---|
| Quadrant | BADHDUFLAG | Total packets | Discarded packets |
| A | 0 | 1 | 0 |
| B | 0 | 2 | 0 |
| C | 0 | 2 | 0 |
| D | 0 | 2 | 0 |
| Quadrant | Total seconds | Saturated seconds | Saturation percentage |
|---|---|---|---|
| A | 2830 | 22 | 0.777385% |
| B | 2830 | 8 | 0.282686% |
| C | 2830 | 13 | 0.459364% |
| D | 2830 | 57 | 2.014134% |
Noise dominated data is calculated using 1-second bins in cleaned event files. If a bin has >2000 counts, and if more than 50% of those come from <1% of pixels, then it is considered to be noise-dominated and hence unusable.
| Quadrant | # 1 sec bins | Bins with >0 counts | Bins with >2000 counts | High rate bins dominated by noise | Noise dominated (total time) | Noise dominated (detector-on time) | Marked lightcurve |
|---|---|---|---|---|---|---|---|
| A | 2830 | 2830 | 8 | 8 | 0.28% | 0.28% | 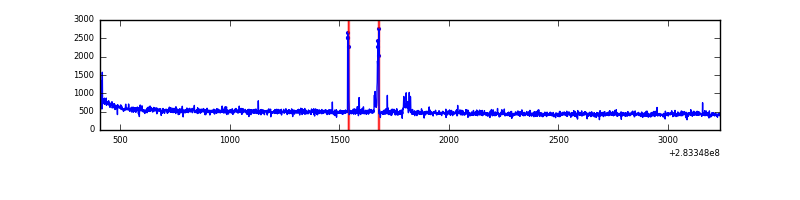 |
| B | 2830 | 2830 | 0 | 0 | 0.00% | 0.00% | 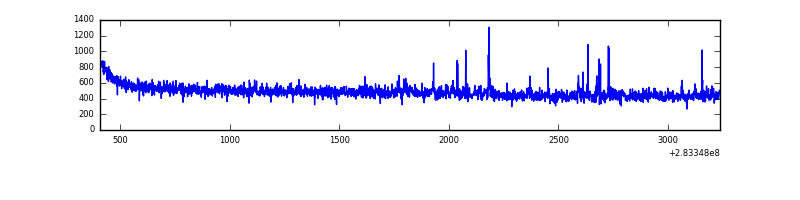 |
| C | 2830 | 2830 | 0 | 0 | 0.00% | 0.00% | 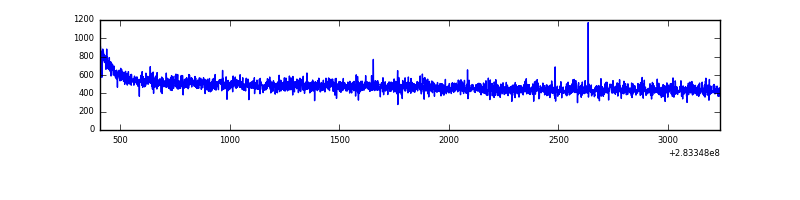 |
| D | 2830 | 2830 | 31 | 31 | 1.10% | 1.10% | 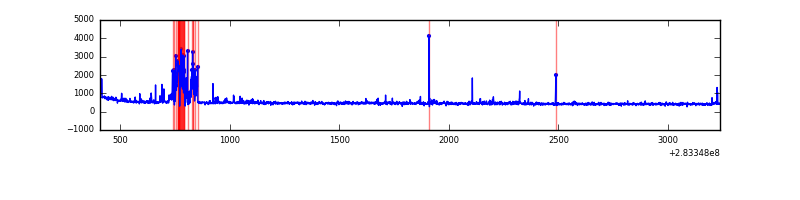 |
Top three noisy pixels from each quadrant. If the there are fewer than three noisy pixels in the level2.evt file, extra rows are filled as -1
| Pixel properties | Quadrant properties | ||||||
|---|---|---|---|---|---|---|---|
| Quadrant | DetID | PixID | Counts | Sigma | Mean | Median | Sigma |
| A | 15 | 174 | 39486 | 543.05 | 353 | 346 | 72.1 |
| A | 0 | 226 | 3150 | 38.9 | 353 | 346 | 72.1 |
| A | 12 | 194 | 2654 | 32.02 | 353 | 346 | 72.1 |
| B | 4 | 216 | 10978 | 160.89 | 344 | 335 | 66.2 |
| B | 12 | 111 | 6998 | 100.72 | 344 | 335 | 66.2 |
| B | 11 | 111 | 6260 | 89.57 | 344 | 335 | 66.2 |
| C | 14 | 238 | 51733 | 676.09 | 327 | 328 | 76.0 |
| C | 3 | 233 | 20877 | 270.26 | 327 | 328 | 76.0 |
| C | 13 | 61 | 2252 | 25.3 | 327 | 328 | 76.0 |
| D | 13 | 189 | 144471 | 1759.01 | 337 | 328 | 81.9 |
| D | 1 | 52 | 27622 | 333.07 | 337 | 328 | 81.9 |
| D | 13 | 232 | 12589 | 149.62 | 337 | 328 | 81.9 |
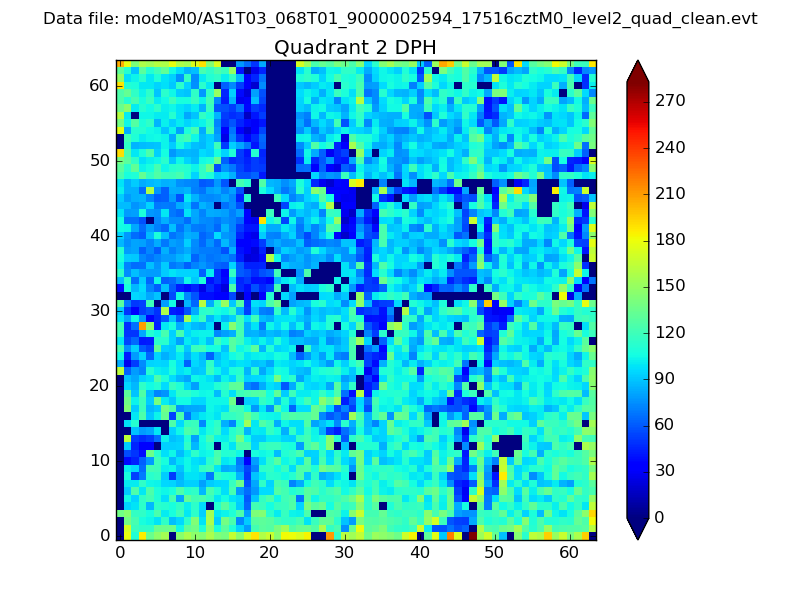
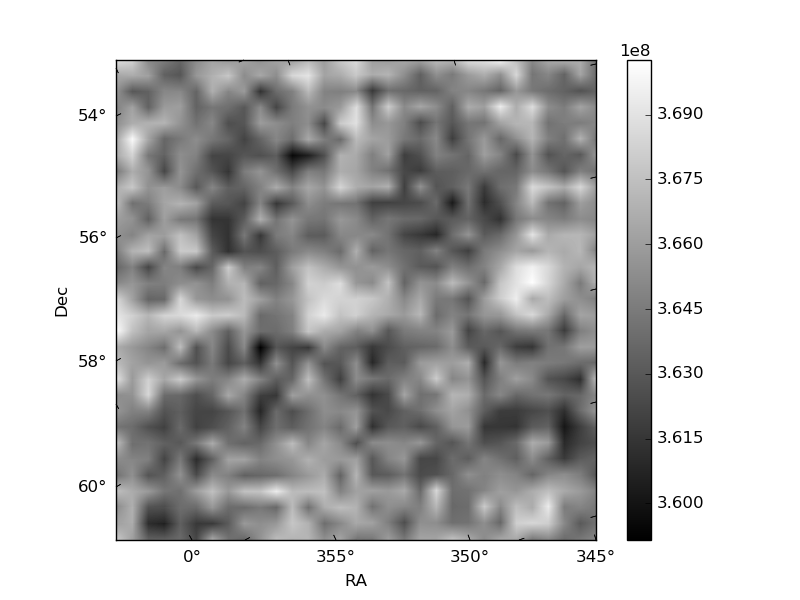
Histogram calculated using DETX and DETY for each event in the final _common_clean file
| Quadrant A | 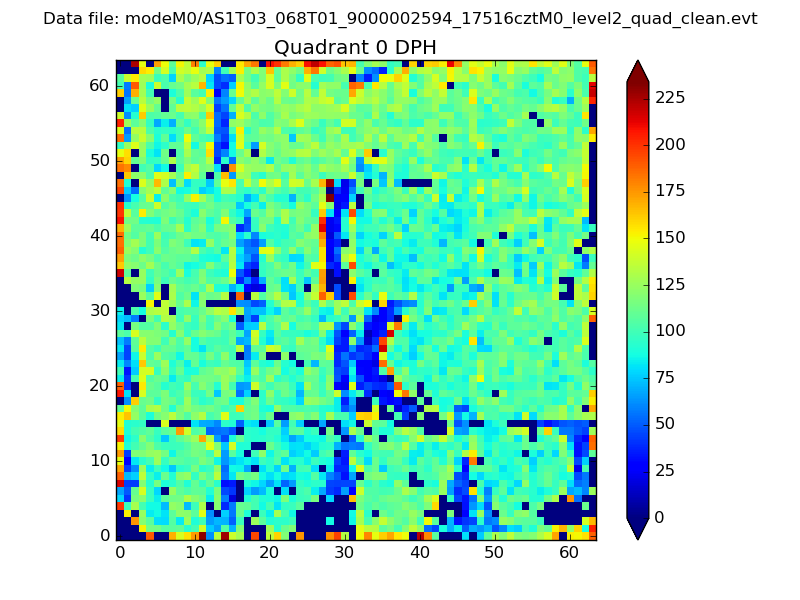 |
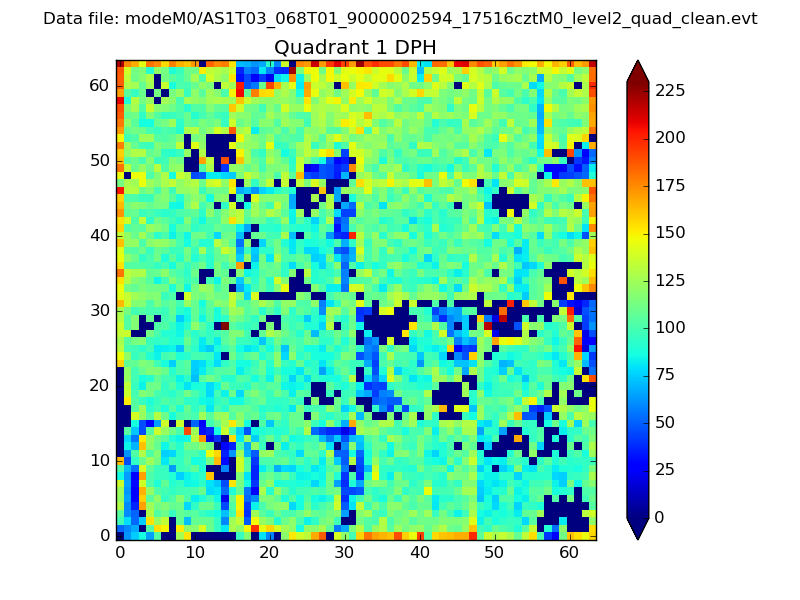 |
Quadrant B |
|---|---|---|---|
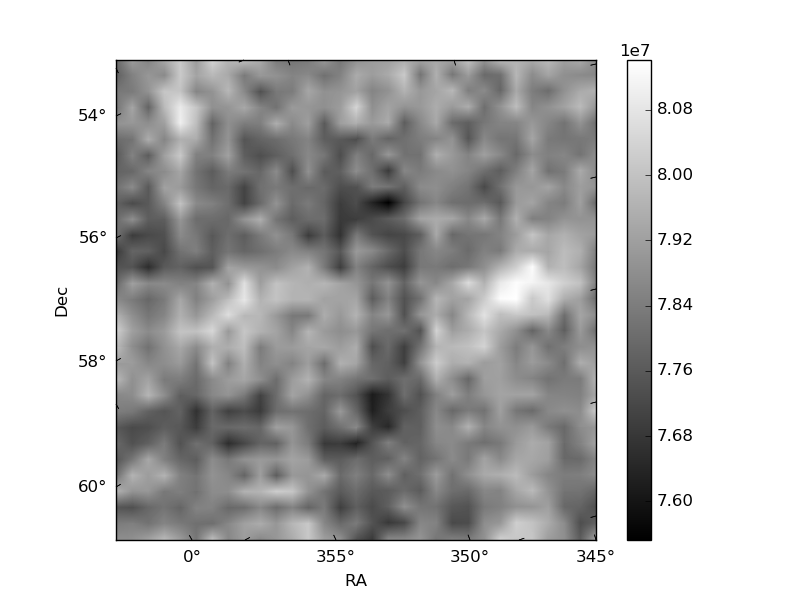
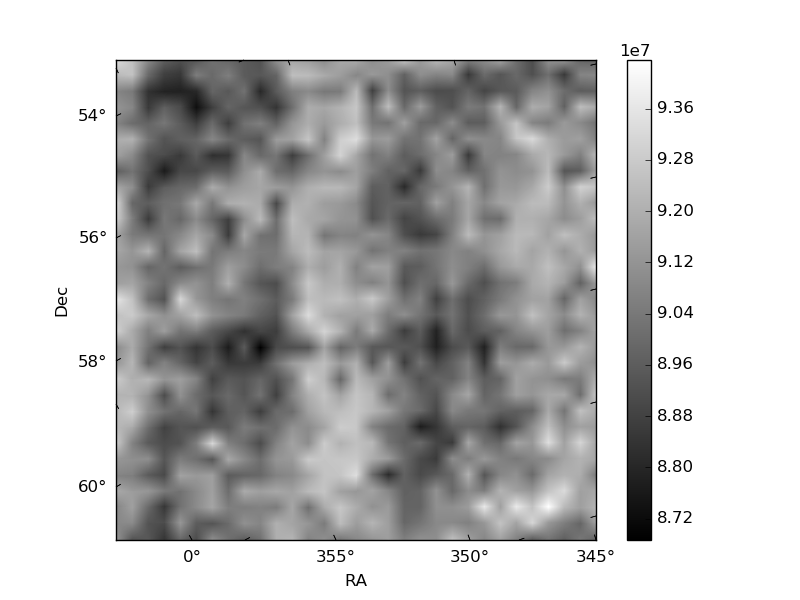
| Quadrant D | 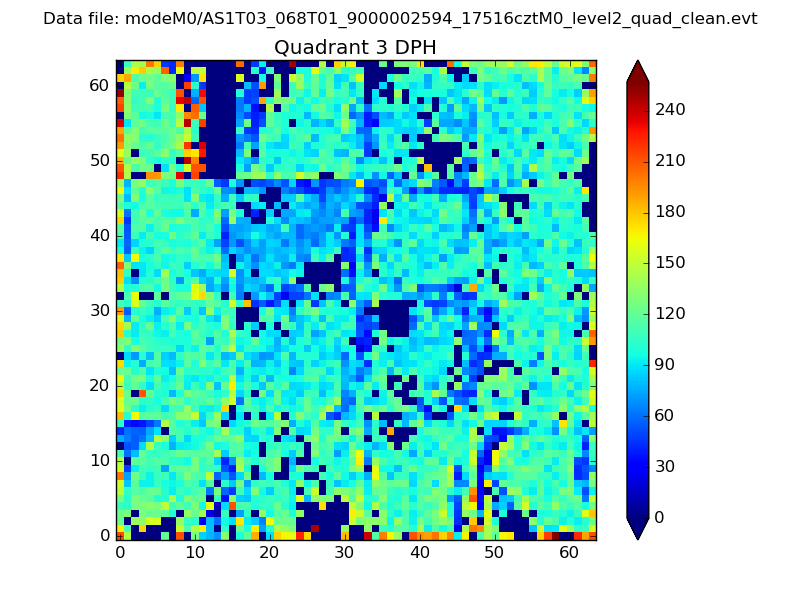 |
 |
Quadrant C |
| Plot type | Count rate plots | Images |
|---|---|---|
| Comparison with Poisson distribution Blue bars denote a histogram of data divided into 1 sec bins. Red curve is a Poisson curve with rate = median count rate of data. |
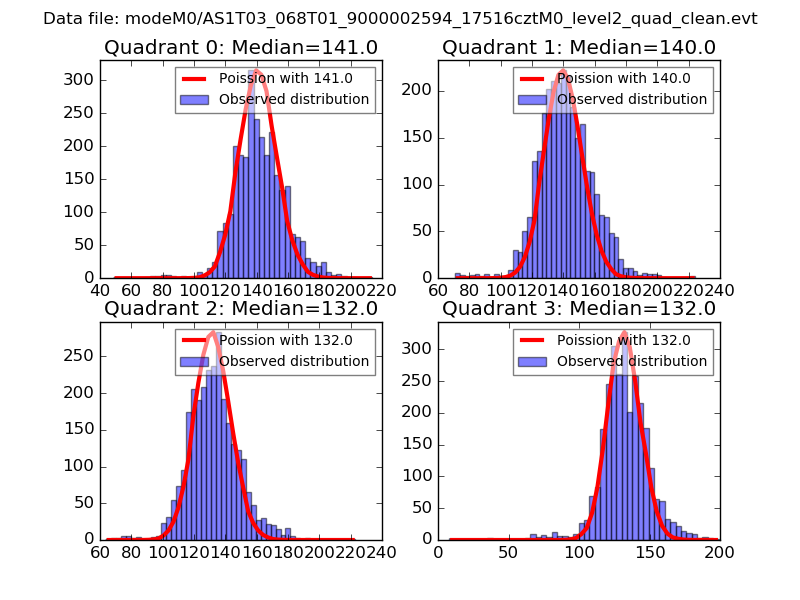 |
 |
| Quadrant-wise count rates Data is divided into 100 sec bins |
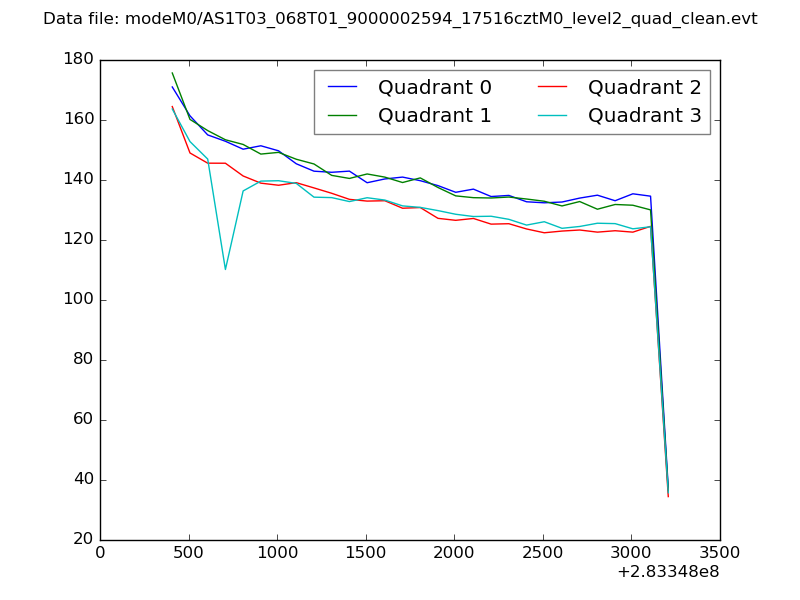 |
|
| Module-wise count rates for Quadrant A Data is divided into 100 sec bins |
 |
 |
| Module-wise count rates for Quadrant B Data is divided into 100 sec bins |
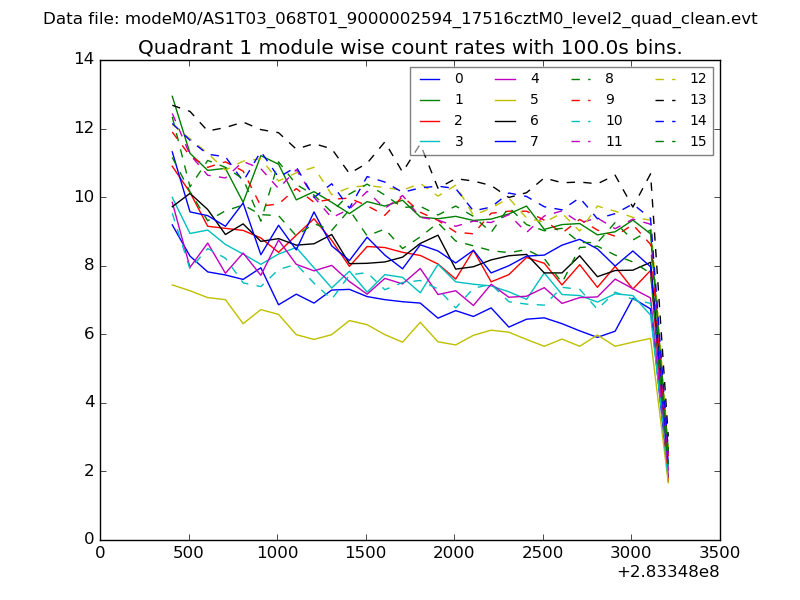 |
 |
| Module-wise count rates for Quadrant C Data is divided into 100 sec bins |
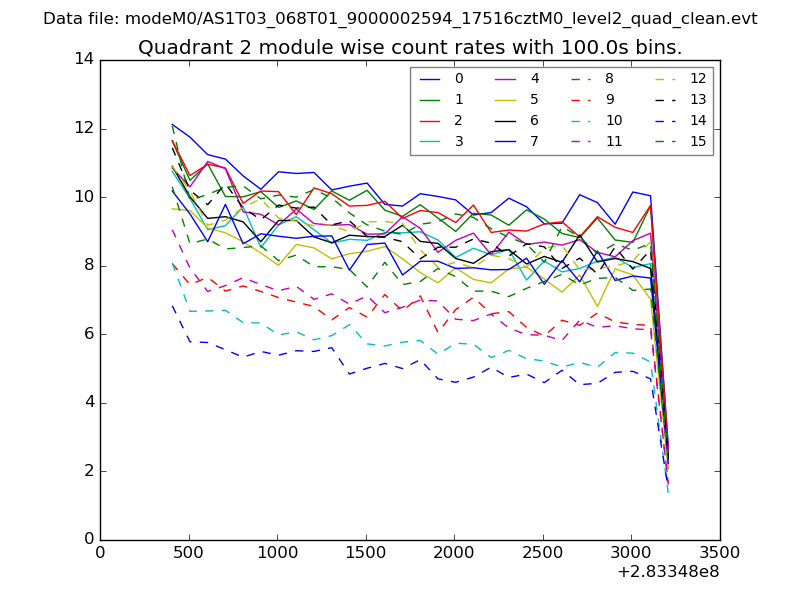 |
 |
| Module-wise count rates for Quadrant D Data is divided into 100 sec bins |
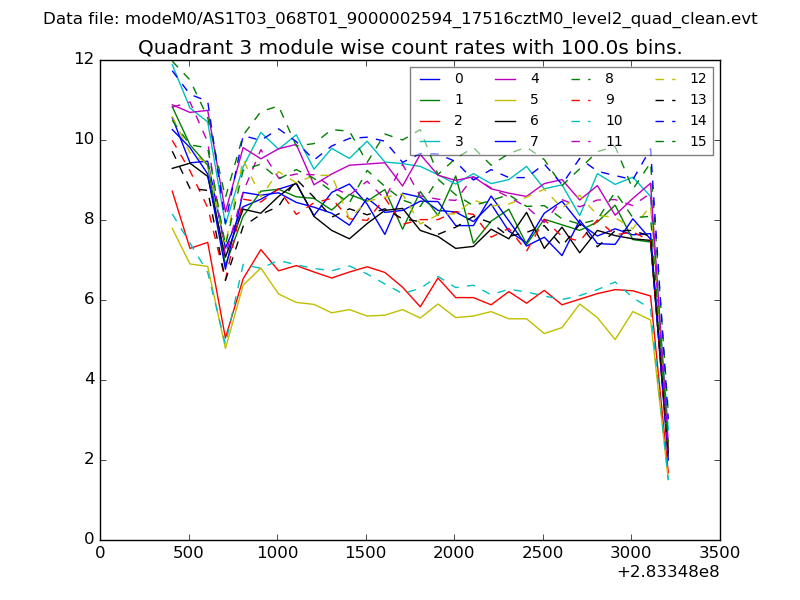 |
 |
| Parameter | Plot |
|---|---|
| CZT HV Monitor | 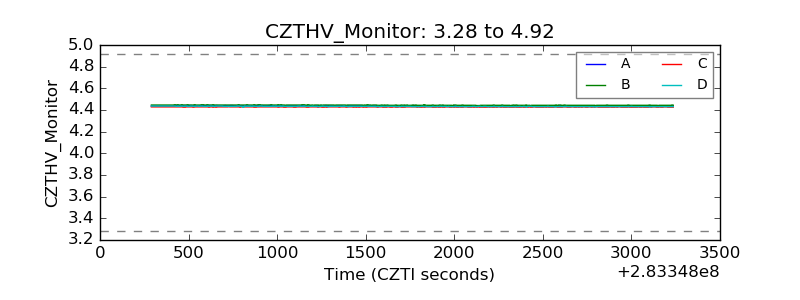 |
| D_VDD | 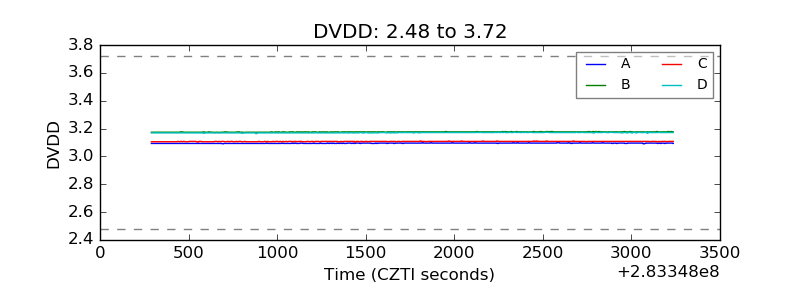 |
| Temperature 1 |  |
| Veto HV Monitor | 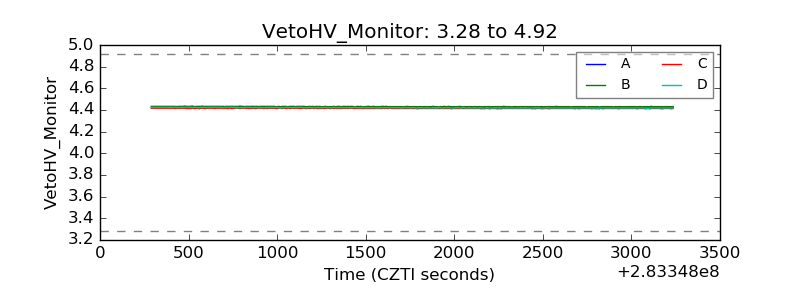 |
| Veto LLD | 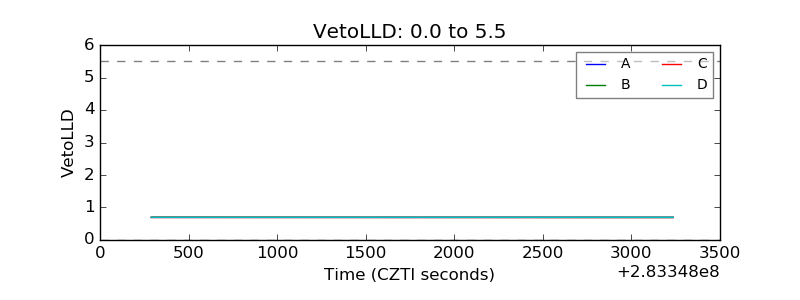 |
| Alpha Counter | 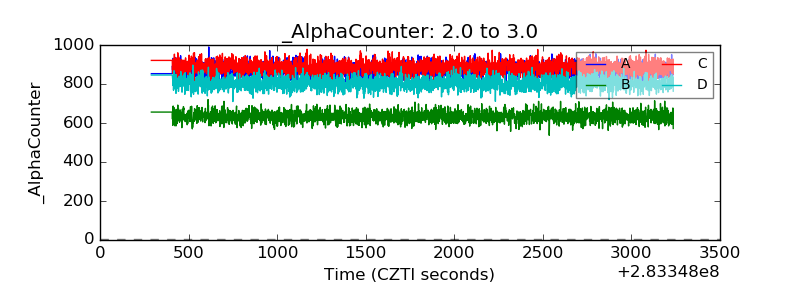 |
| _CPM_Rate | 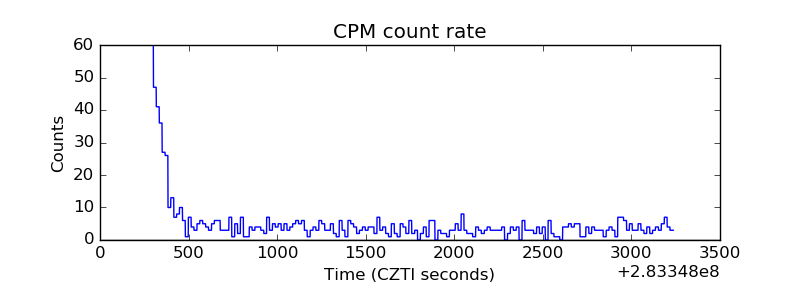 |
| CZT Counter | 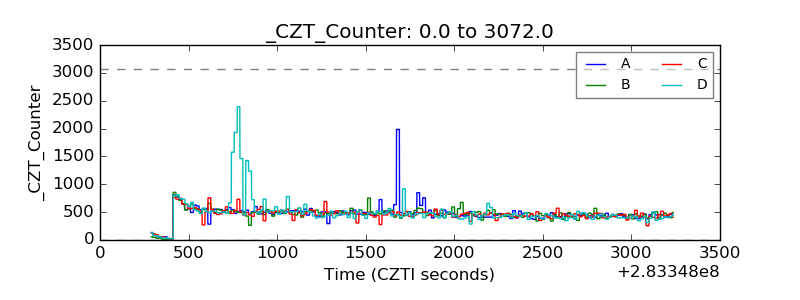 |
| +2.5 Volts monitor |  |
| +5 Volts monitor |  |
| _ROLL_ROT | 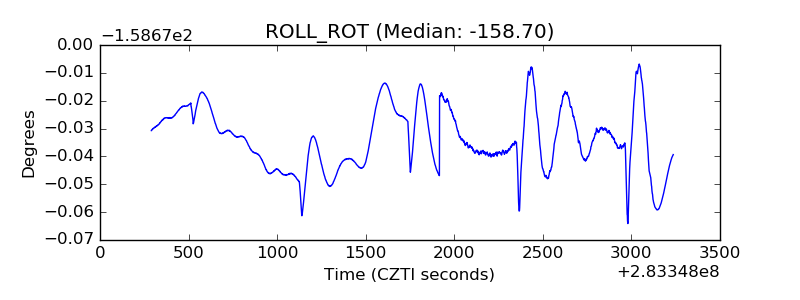 |
| _Roll_DEC |  |
| _Roll_RA | 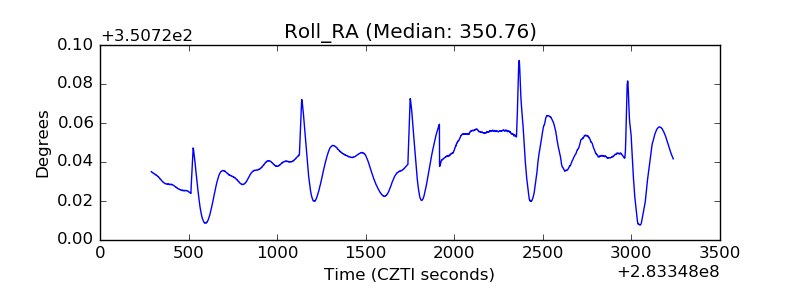 |
| Veto Counter | 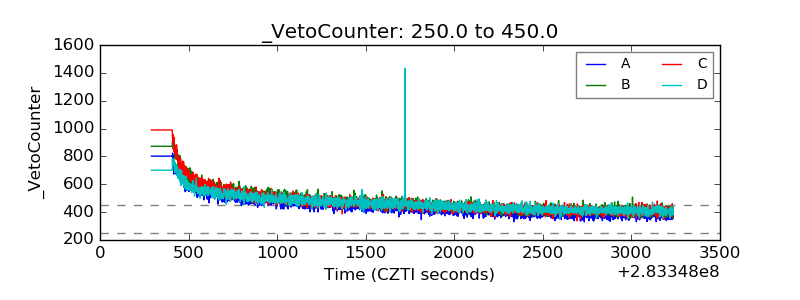 |