| Param | Original file | Final file |
|---|---|---|
| Filename | modeM0/AS1A05_140T01_9000002596_17516cztM0_level2.evt | modeM0/AS1A05_140T01_9000002596_17516cztM0_level2_quad_clean.evt |
| Size (bytes) | 186,814,080 | 19,307,520 |
| Size | 178.2 MB | 18.4 MB |
| Events in quadrant A | 1,367,767 | 104,701 |
| Events in quadrant B | 1,291,404 | 106,127 |
| Events in quadrant C | 1,305,437 | 100,422 |
| Events in quadrant D | 1,528,554 | 100,776 |
| Mode SS | |||
|---|---|---|---|
| Quadrant | BADHDUFLAG | Total packets | Discarded packets |
| A | 0 | 50 | 0 |
| B | 0 | 50 | 0 |
| C | 0 | 50 | 0 |
| D | 0 | 50 | 0 |
| Mode M0 | |||
|---|---|---|---|
| Quadrant | BADHDUFLAG | Total packets | Discarded packets |
| A | 0 | 5446 | 2 |
| B | 0 | 5182 | 1 |
| C | 0 | 5228 | 1 |
| D | 0 | 6019 | 1 |
| Mode M9 | |||
|---|---|---|---|
| Quadrant | BADHDUFLAG | Total packets | Discarded packets |
| A | 0 | 10 | 0 |
| B | 0 | 10 | 0 |
| C | 0 | 10 | 0 |
| D | 0 | 10 | 0 |
| Quadrant | Total seconds | Saturated seconds | Saturation percentage |
|---|---|---|---|
| A | 2387 | 158 | 6.619187% |
| B | 2387 | 119 | 4.985337% |
| C | 2387 | 130 | 5.446167% |
| D | 2387 | 158 | 6.619187% |
Noise dominated data is calculated using 1-second bins in cleaned event files. If a bin has >2000 counts, and if more than 50% of those come from <1% of pixels, then it is considered to be noise-dominated and hence unusable.
| Quadrant | # 1 sec bins | Bins with >0 counts | Bins with >2000 counts | High rate bins dominated by noise | Noise dominated (total time) | Noise dominated (detector-on time) | Marked lightcurve |
|---|---|---|---|---|---|---|---|
| A | 3422 | 2387 | 33 | 33 | 0.96% | 1.38% | 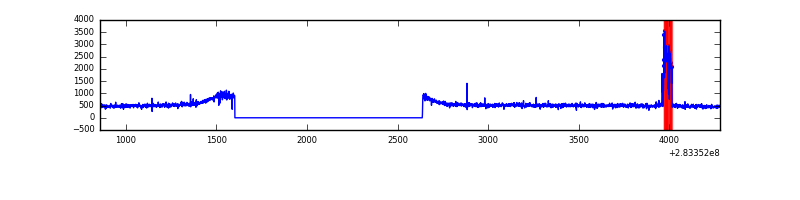 |
| B | 3422 | 2387 | 1 | 1 | 0.03% | 0.04% | 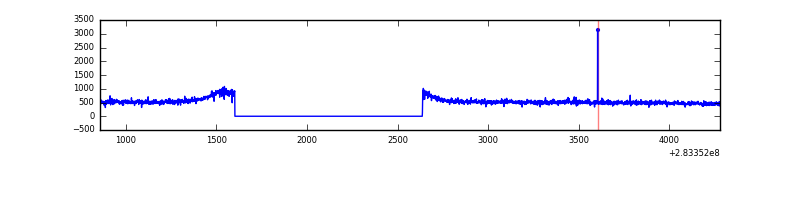 |
| C | 3422 | 2387 | 0 | 0 | 0.00% | 0.00% | 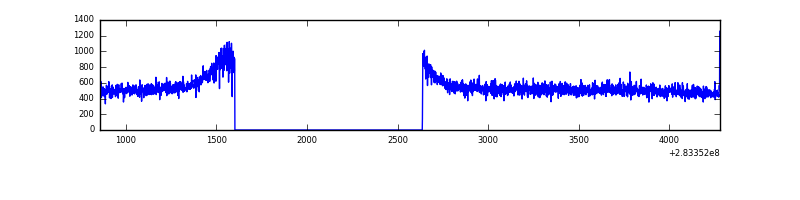 |
| D | 3422 | 2387 | 44 | 44 | 1.29% | 1.84% | 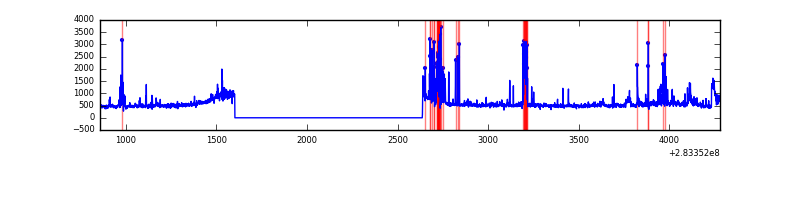 |
Top three noisy pixels from each quadrant. If the there are fewer than three noisy pixels in the level2.evt file, extra rows are filled as -1
| Pixel properties | Quadrant properties | ||||||
|---|---|---|---|---|---|---|---|
| Quadrant | DetID | PixID | Counts | Sigma | Mean | Median | Sigma |
| A | 4 | 208 | 94853 | 1372.1 | 331 | 322 | 68.9 |
| A | 0 | 226 | 2874 | 37.04 | 331 | 322 | 68.9 |
| A | 3 | 137 | 2426 | 30.54 | 331 | 322 | 68.9 |
| B | 12 | 111 | 7654 | 111.1 | 327 | 318 | 66.0 |
| B | 0 | 219 | 7032 | 101.68 | 327 | 318 | 66.0 |
| B | 11 | 111 | 6624 | 95.5 | 327 | 318 | 66.0 |
| C | 14 | 238 | 48135 | 631.48 | 315 | 315 | 75.7 |
| C | 3 | 233 | 24032 | 313.19 | 315 | 315 | 75.7 |
| C | 13 | 61 | 2292 | 26.11 | 315 | 315 | 75.7 |
| D | 5 | 222 | 195644 | 2450.07 | 322 | 313 | 79.7 |
| D | 13 | 189 | 91590 | 1144.9 | 322 | 313 | 79.7 |
| D | 13 | 232 | 10689 | 130.15 | 322 | 313 | 79.7 |
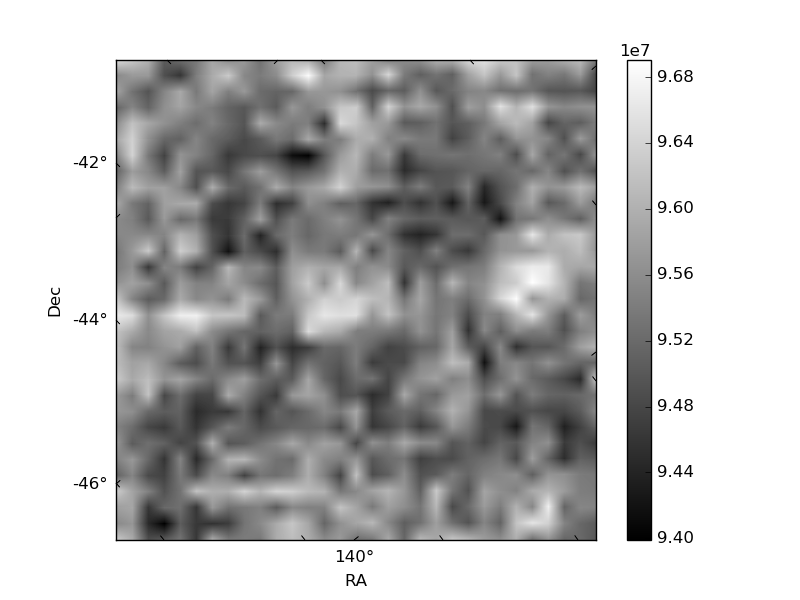
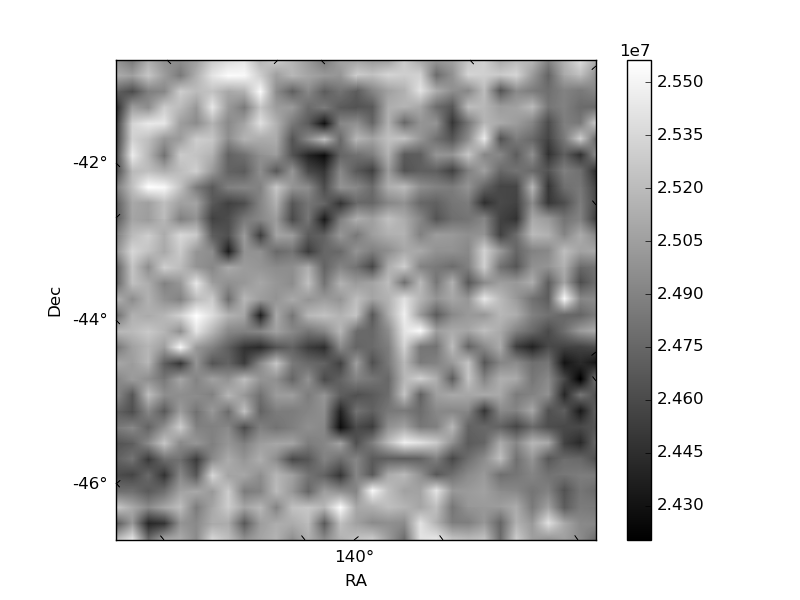
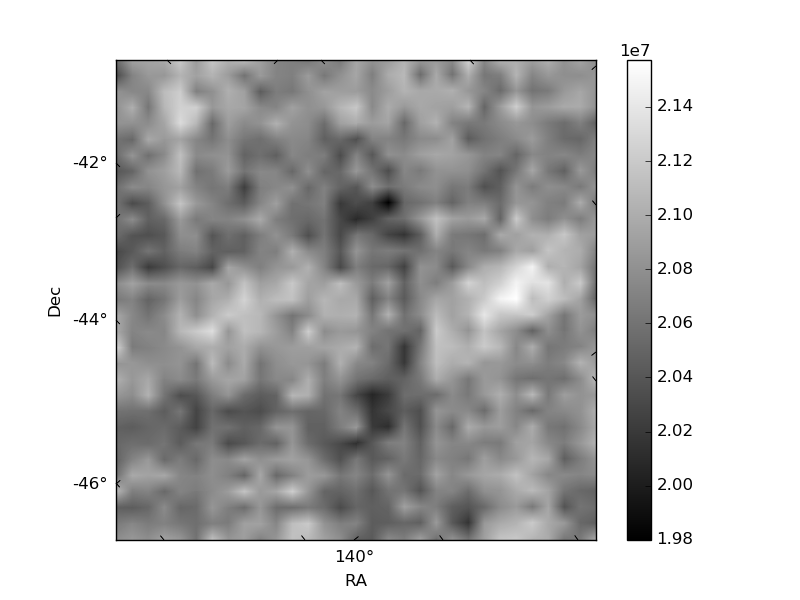
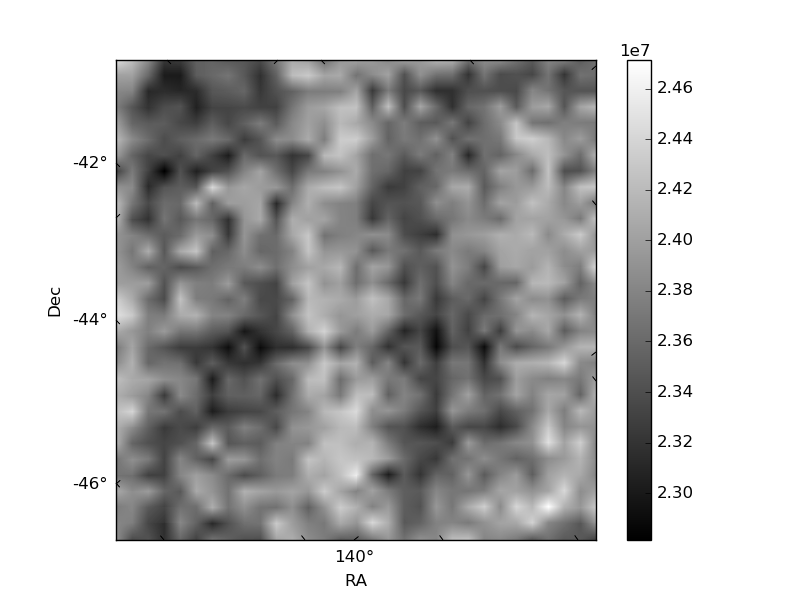
Histogram calculated using DETX and DETY for each event in the final _common_clean file
| Quadrant A | 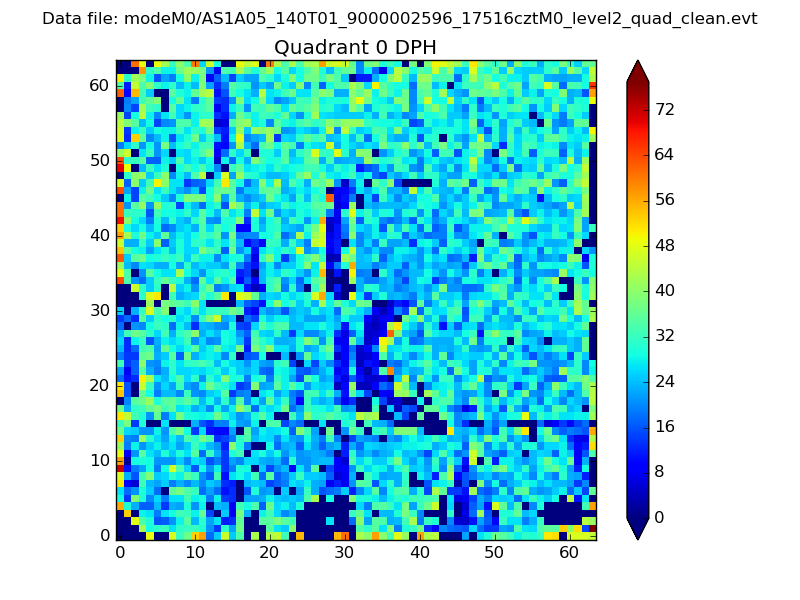 |
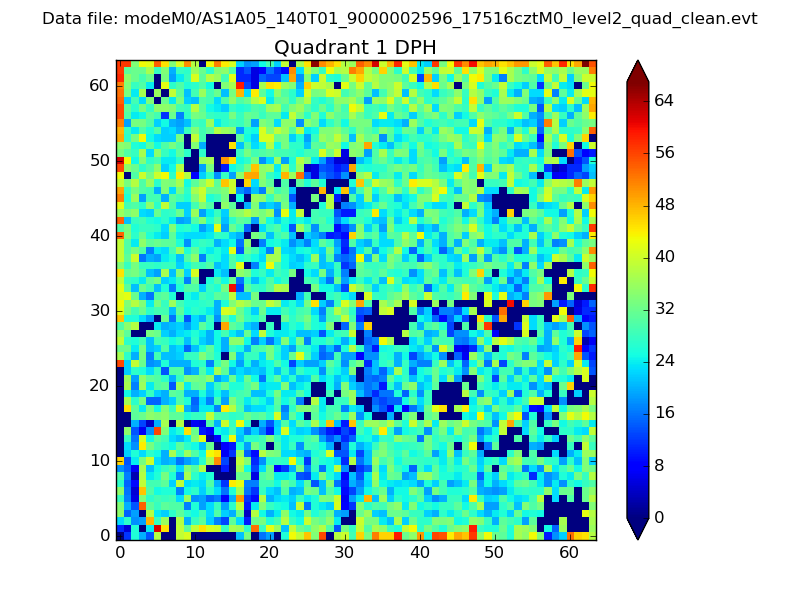 |
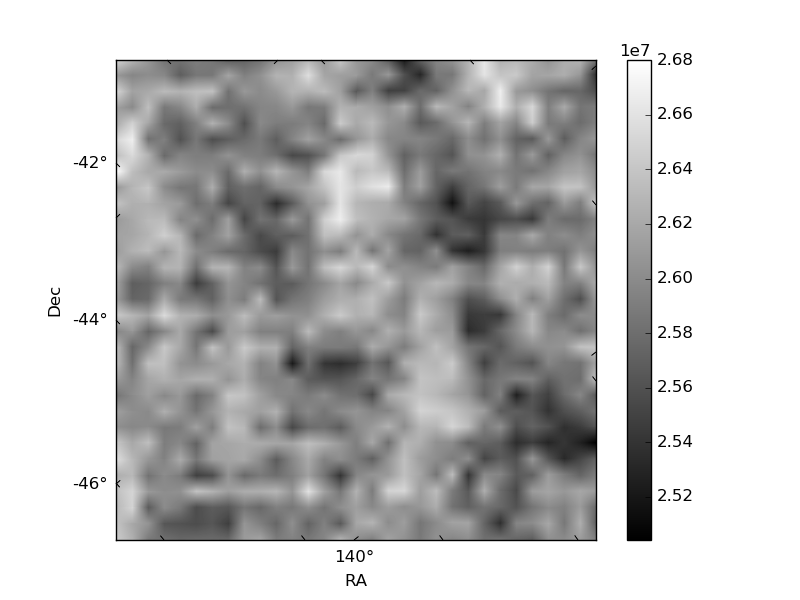
Quadrant B |
|---|---|---|---|
| Quadrant D | 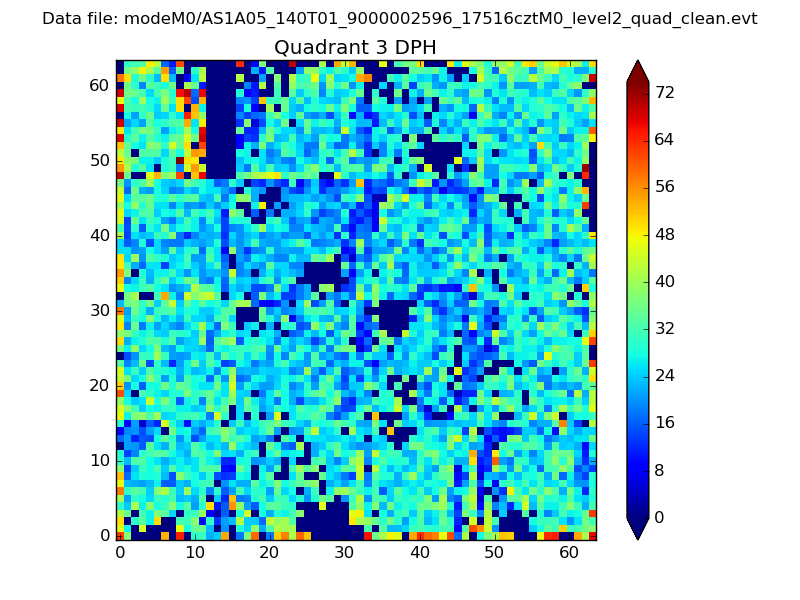 |
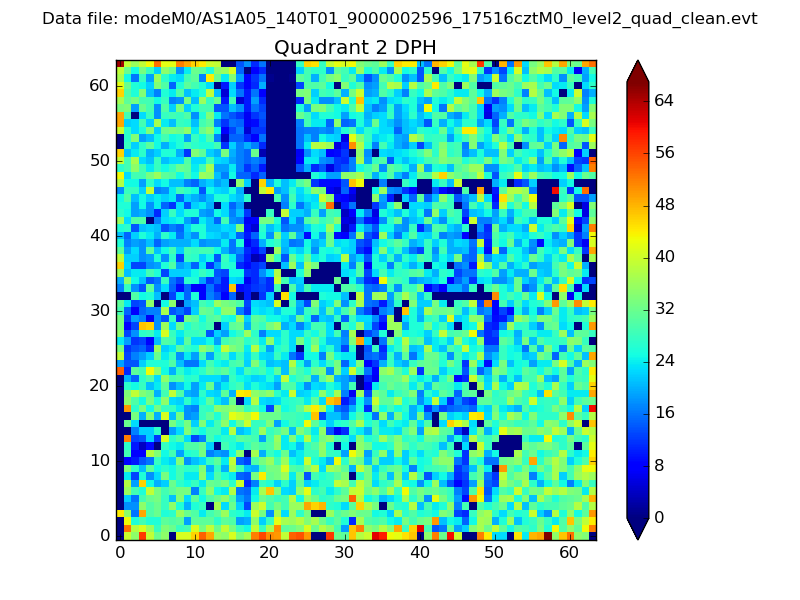 |
Quadrant C |
| Plot type | Count rate plots | Images |
|---|---|---|
| Comparison with Poisson distribution Blue bars denote a histogram of data divided into 1 sec bins. Red curve is a Poisson curve with rate = median count rate of data. |
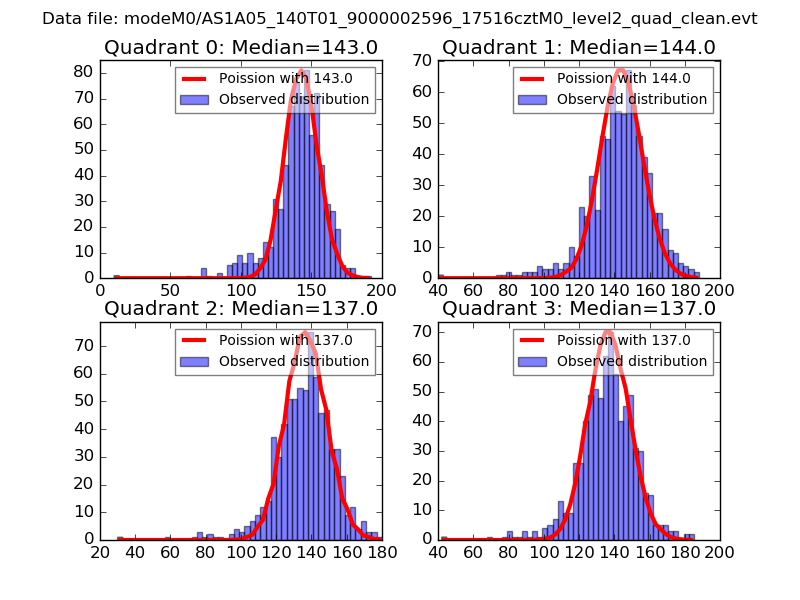 |
 |
| Quadrant-wise count rates Data is divided into 100 sec bins |
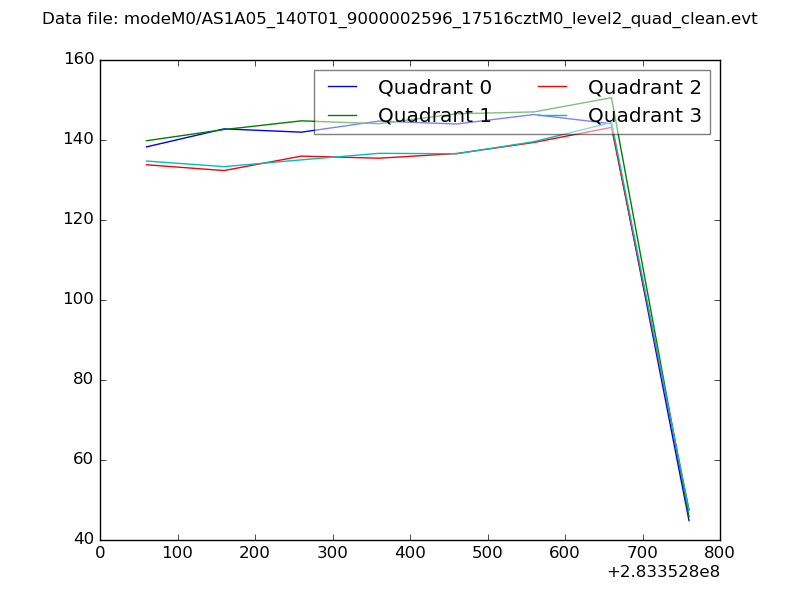 |
|
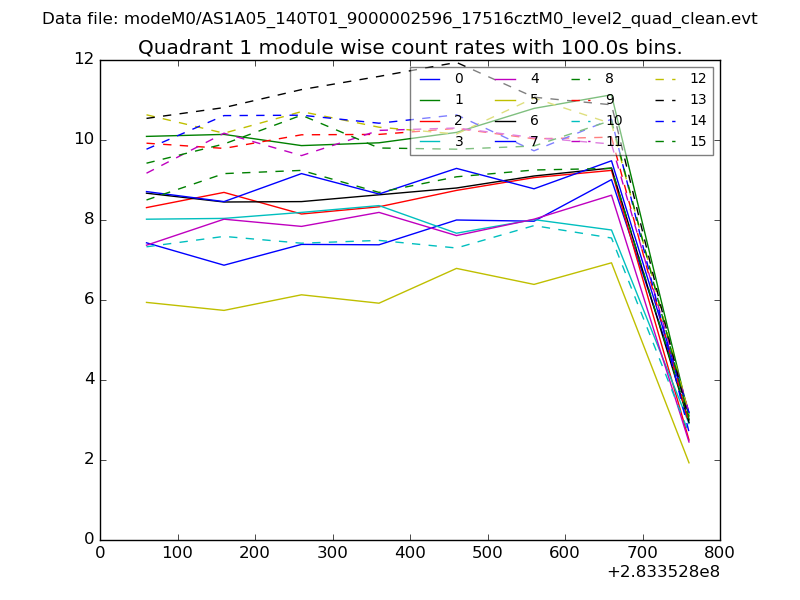
| Module-wise count rates for Quadrant A Data is divided into 100 sec bins |
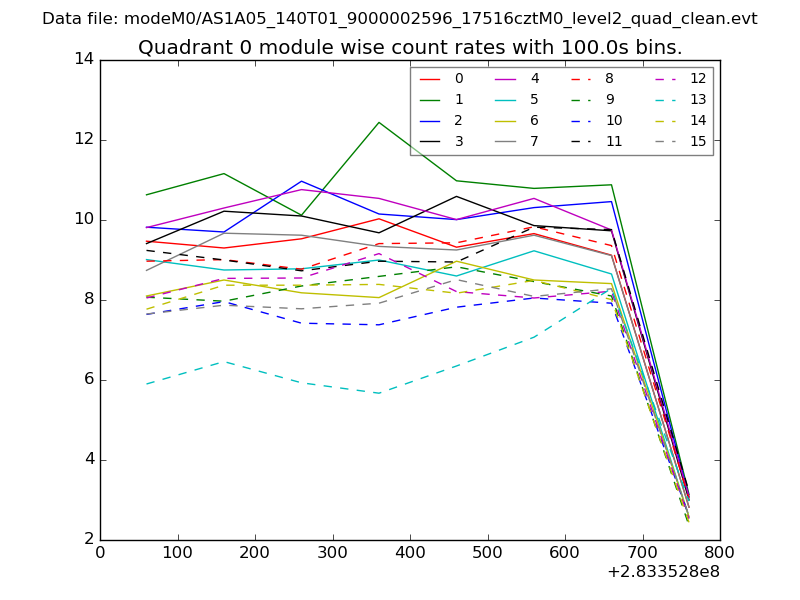 |
 |
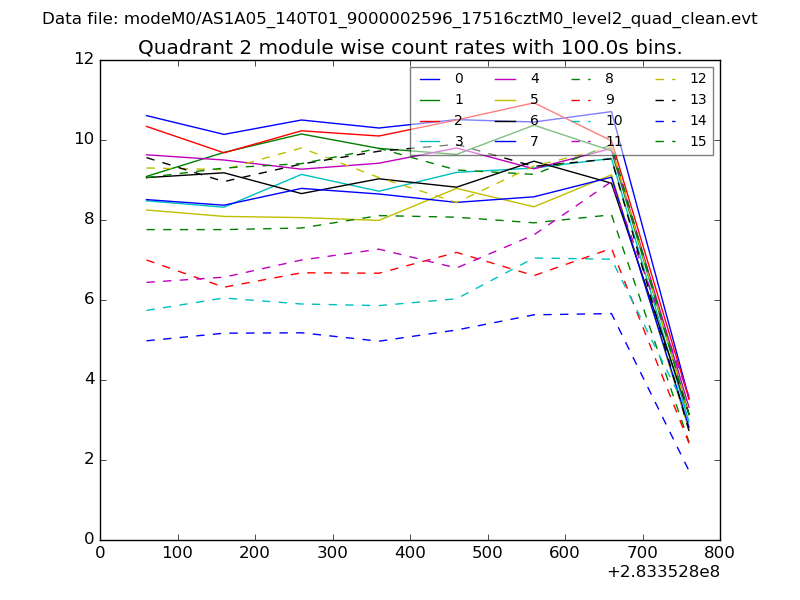
| Module-wise count rates for Quadrant B Data is divided into 100 sec bins |
 |
 |
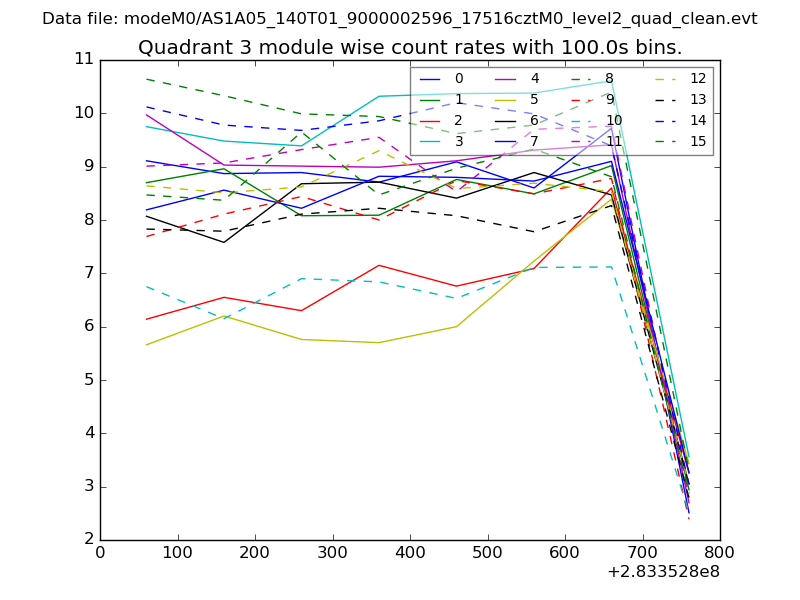
| Module-wise count rates for Quadrant C Data is divided into 100 sec bins |
 |
 |
| Module-wise count rates for Quadrant D Data is divided into 100 sec bins |
 |
 |
| Parameter | Plot |
|---|---|
| CZT HV Monitor | 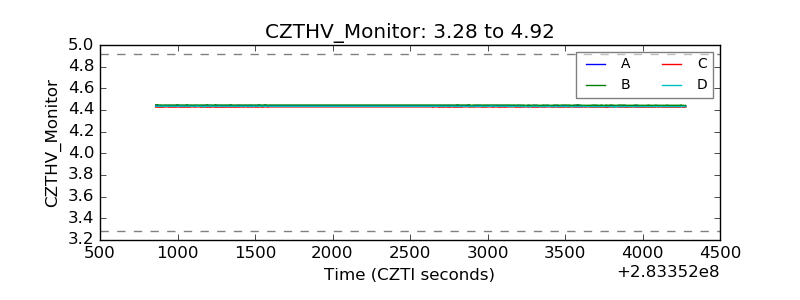 |
| D_VDD | 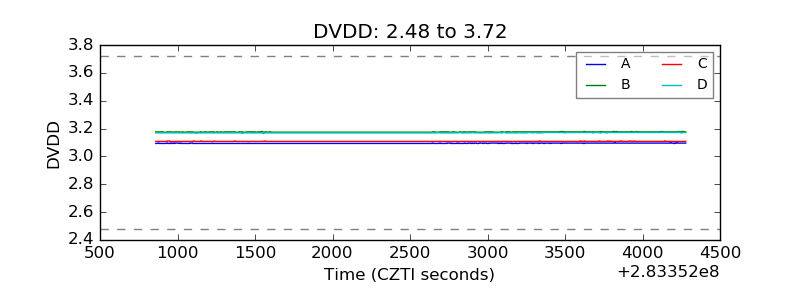 |
| Temperature 1 | 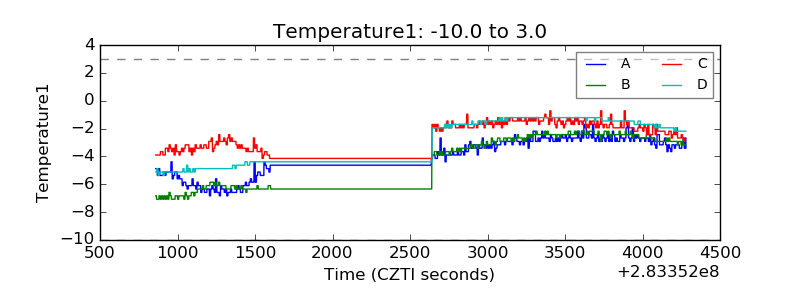 |
| Veto HV Monitor | 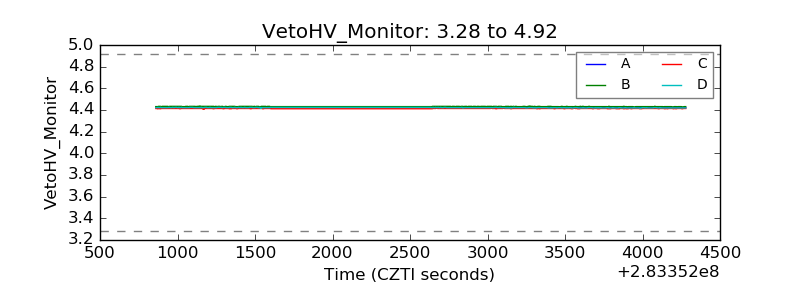 |
| Veto LLD |  |
| Alpha Counter | 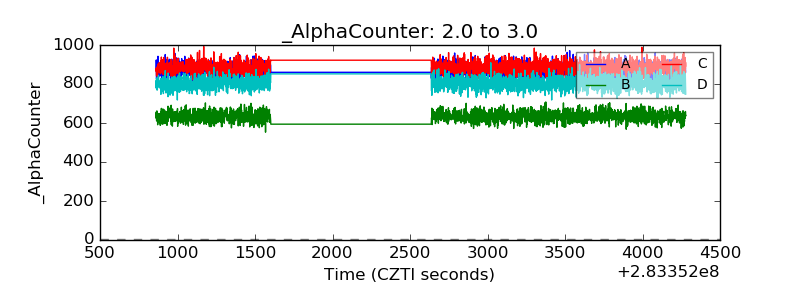 |
| _CPM_Rate | 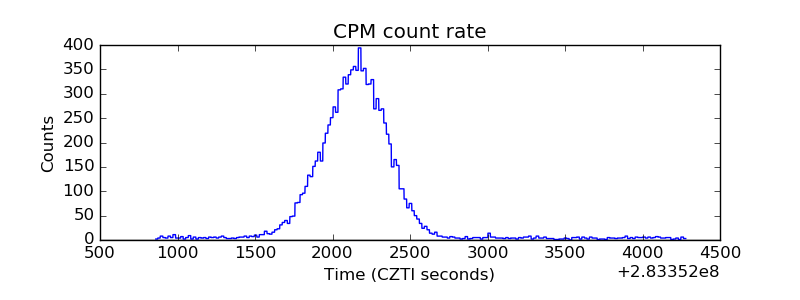 |
| CZT Counter | 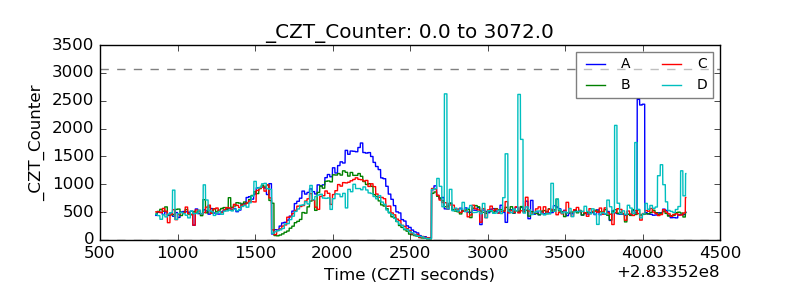 |
| +2.5 Volts monitor |  |
| +5 Volts monitor | 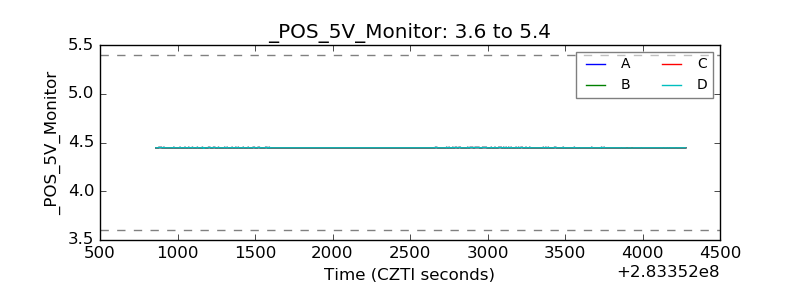 |
| _ROLL_ROT | 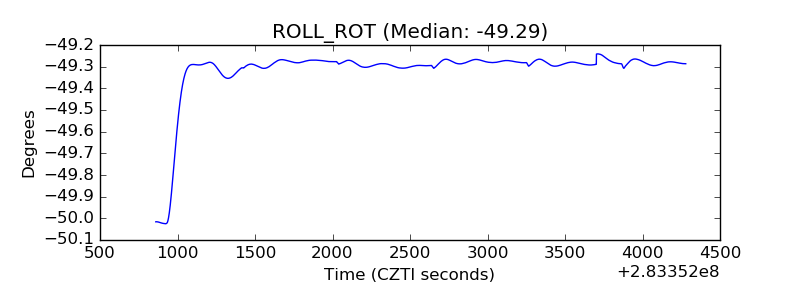 |
| _Roll_DEC | 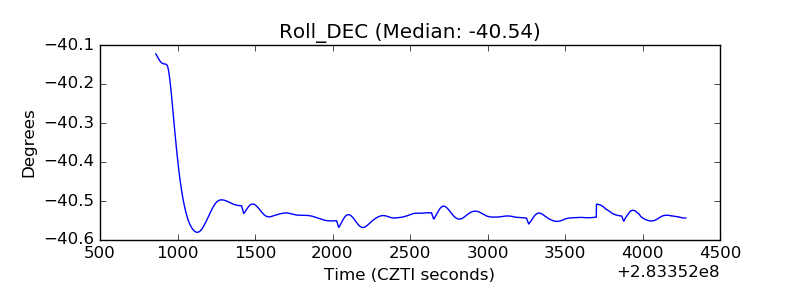 |
| _Roll_RA | 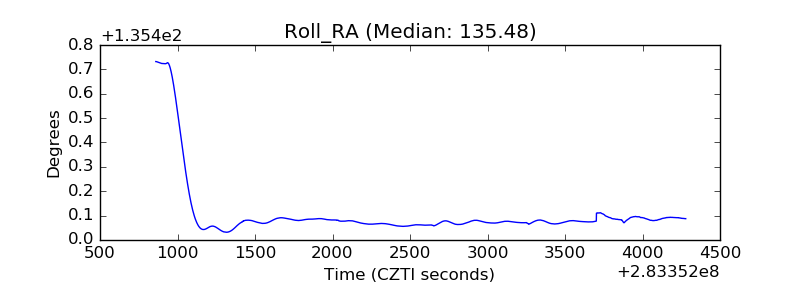 |
| Veto Counter | 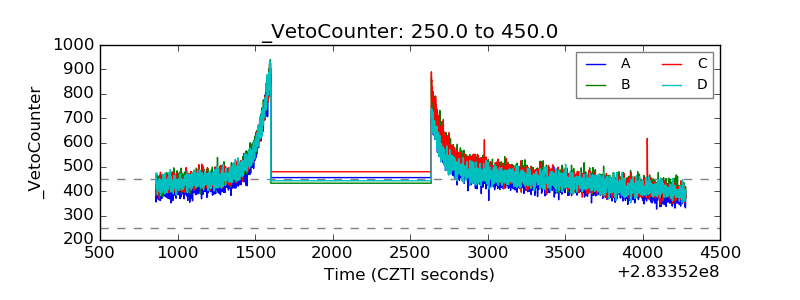 |