| Param | Original file | Final file |
|---|---|---|
| Filename | modeM0/AS1A05_140T01_9000002596_17517cztM0_level2.evt | modeM0/AS1A05_140T01_9000002596_17517cztM0_level2_quad_clean.evt |
| Size (bytes) | 483,321,600 | 83,214,720 |
| Size | 460.9 MB | 79.4 MB |
| Events in quadrant A | 3,326,763 | 525,304 |
| Events in quadrant B | 3,266,436 | 526,754 |
| Events in quadrant C | 3,283,789 | 501,360 |
| Events in quadrant D | 4,300,088 | 494,102 |
| Mode SS | |||
|---|---|---|---|
| Quadrant | BADHDUFLAG | Total packets | Discarded packets |
| A | 0 | 138 | 0 |
| B | 0 | 138 | 0 |
| C | 0 | 138 | 0 |
| D | 0 | 138 | 0 |
| Mode M0 | |||
|---|---|---|---|
| Quadrant | BADHDUFLAG | Total packets | Discarded packets |
| A | 0 | 14287 | 1 |
| B | 0 | 13943 | 1 |
| C | 0 | 13988 | 1 |
| D | 0 | 17237 | 1 |
| Mode M9 | |||
|---|---|---|---|
| Quadrant | BADHDUFLAG | Total packets | Discarded packets |
| A | 0 | 7 | 0 |
| B | 0 | 7 | 0 |
| C | 0 | 7 | 0 |
| D | 0 | 7 | 0 |
| Quadrant | Total seconds | Saturated seconds | Saturation percentage |
|---|---|---|---|
| A | 6776 | 140 | 2.066116% |
| B | 6776 | 102 | 1.505313% |
| C | 6776 | 103 | 1.520071% |
| D | 6776 | 282 | 4.161747% |
Noise dominated data is calculated using 1-second bins in cleaned event files. If a bin has >2000 counts, and if more than 50% of those come from <1% of pixels, then it is considered to be noise-dominated and hence unusable.
| Quadrant | # 1 sec bins | Bins with >0 counts | Bins with >2000 counts | High rate bins dominated by noise | Noise dominated (total time) | Noise dominated (detector-on time) | Marked lightcurve |
|---|---|---|---|---|---|---|---|
| A | 7466 | 6776 | 37 | 37 | 0.50% | 0.55% | 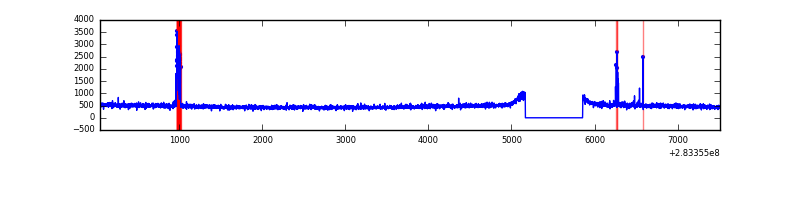 |
| B | 7466 | 6777 | 1 | 1 | 0.01% | 0.01% | 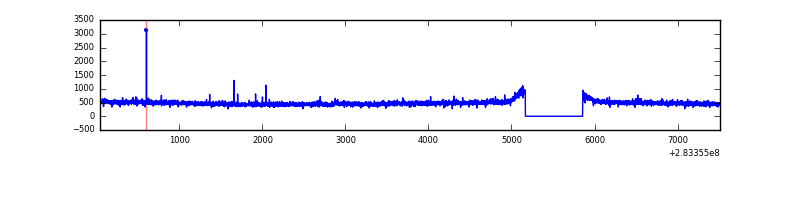 |
| C | 7466 | 6777 | 0 | 0 | 0.00% | 0.00% | 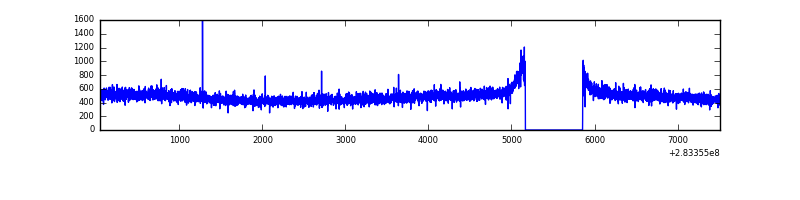 |
| D | 7466 | 6777 | 165 | 165 | 2.21% | 2.43% | 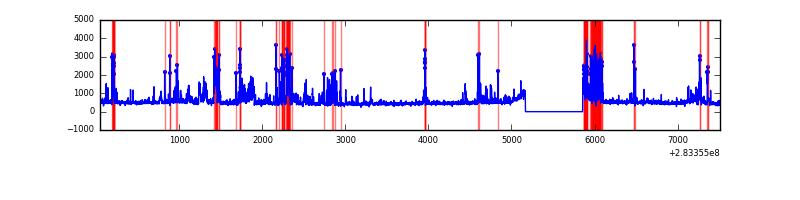 |
Top three noisy pixels from each quadrant. If the there are fewer than three noisy pixels in the level2.evt file, extra rows are filled as -1
| Pixel properties | Quadrant properties | ||||||
|---|---|---|---|---|---|---|---|
| Quadrant | DetID | PixID | Counts | Sigma | Mean | Median | Sigma |
| A | 4 | 208 | 95681 | 567.9 | 831 | 813 | 167.1 |
| A | 15 | 174 | 35439 | 207.28 | 831 | 813 | 167.1 |
| A | 0 | 226 | 7209 | 38.29 | 831 | 813 | 167.1 |
| B | 12 | 111 | 18786 | 113.48 | 829 | 809 | 158.4 |
| B | 11 | 111 | 16253 | 97.49 | 829 | 809 | 158.4 |
| B | 0 | 219 | 16199 | 97.15 | 829 | 809 | 158.4 |
| C | 14 | 238 | 122369 | 654.74 | 793 | 797 | 185.7 |
| C | 3 | 233 | 50502 | 267.69 | 793 | 797 | 185.7 |
| C | 5 | 218 | 13409 | 67.92 | 793 | 797 | 185.7 |
| D | 5 | 222 | 926393 | 4785.18 | 796 | 774 | 193.4 |
| D | 13 | 189 | 185533 | 955.15 | 796 | 774 | 193.4 |
| D | 7 | 38 | 65936 | 336.87 | 796 | 774 | 193.4 |
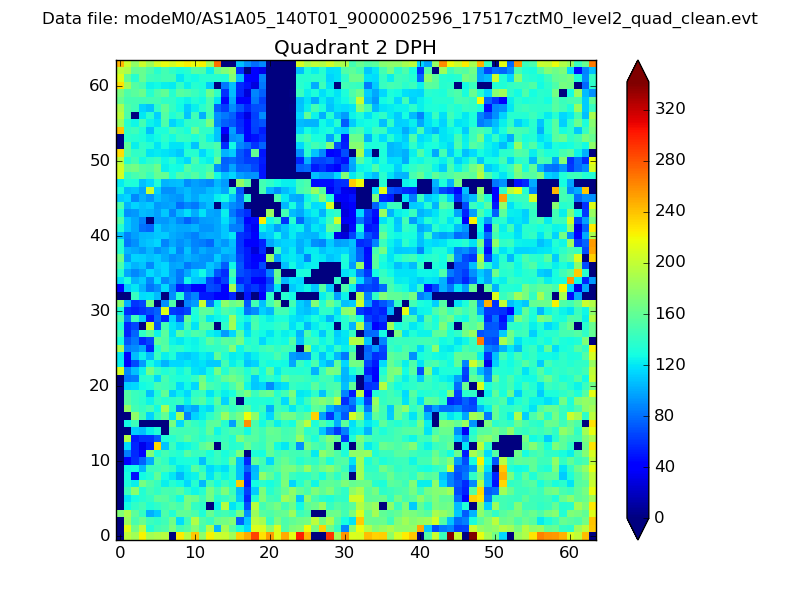
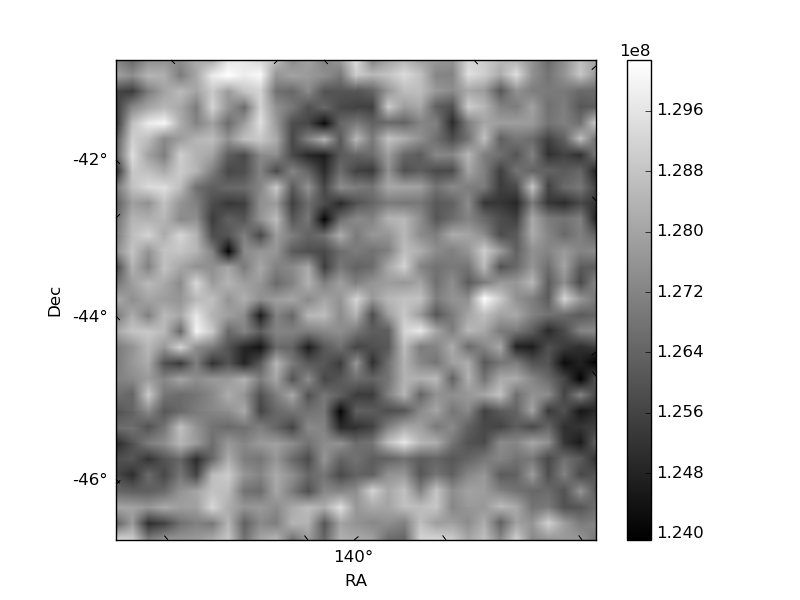
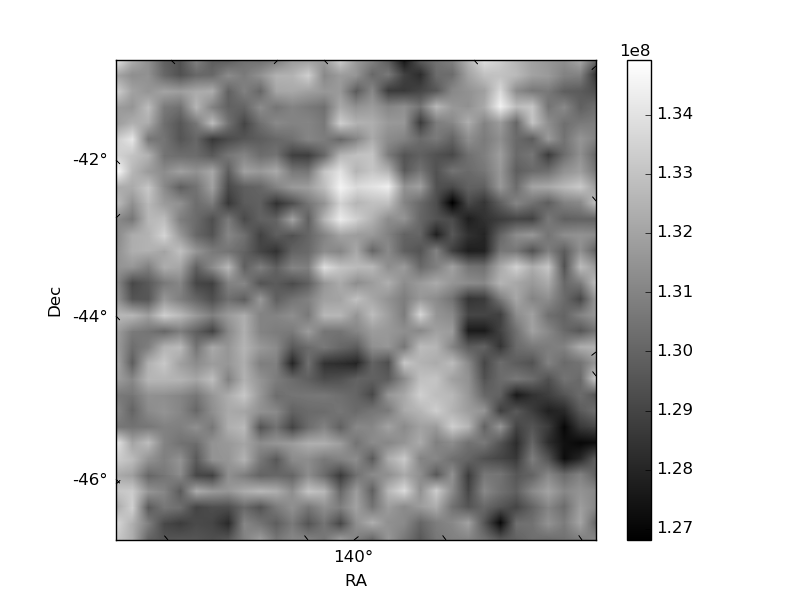
Histogram calculated using DETX and DETY for each event in the final _common_clean file
| Quadrant A |  |
 |
Quadrant B |
|---|---|---|---|
| Quadrant D |  |
 |
Quadrant C |
| Plot type | Count rate plots | Images |
|---|---|---|
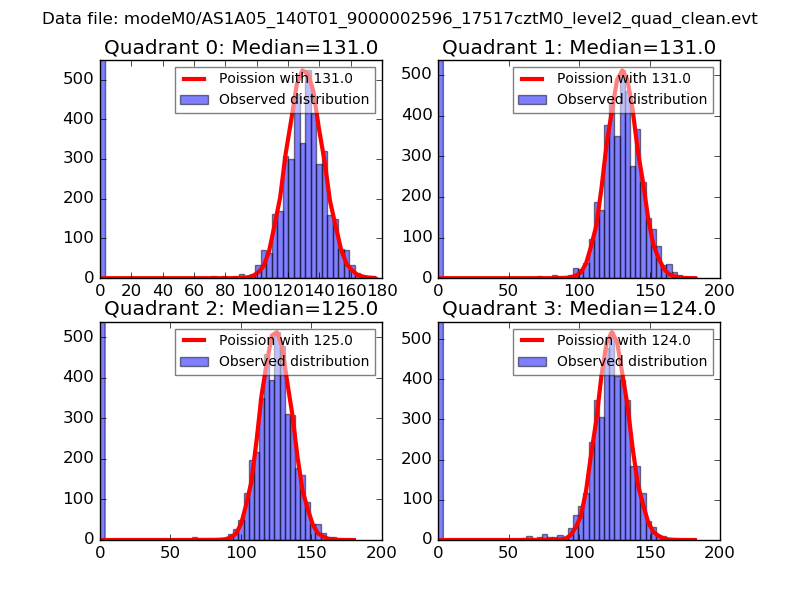
| Comparison with Poisson distribution Blue bars denote a histogram of data divided into 1 sec bins. Red curve is a Poisson curve with rate = median count rate of data. |
 |
 |
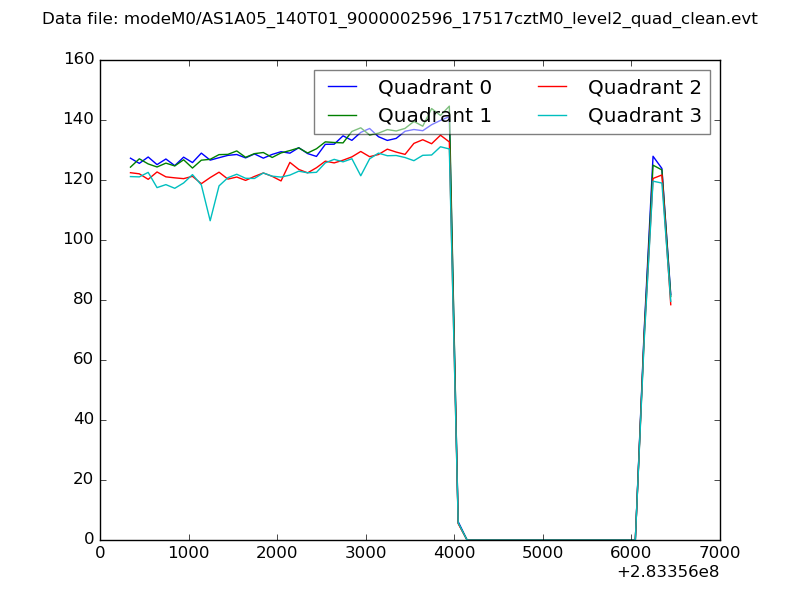
| Quadrant-wise count rates Data is divided into 100 sec bins |
 |
|
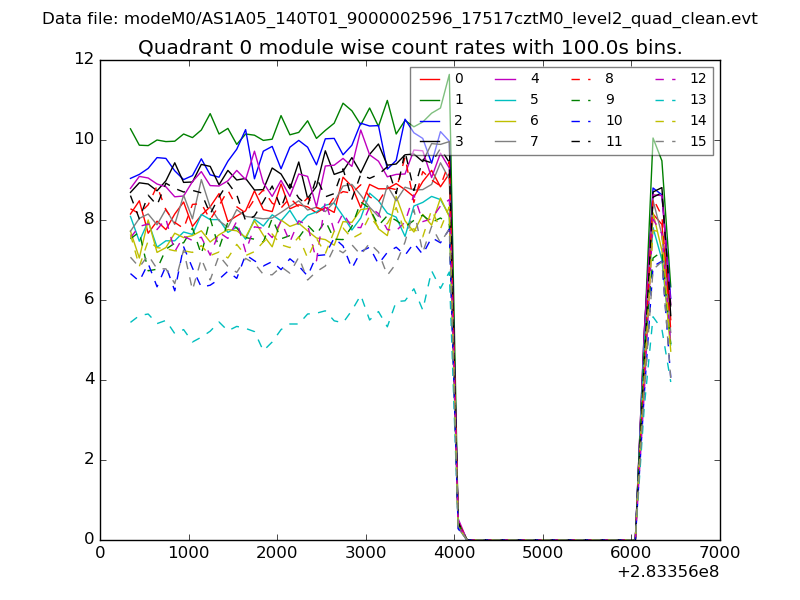
| Module-wise count rates for Quadrant A Data is divided into 100 sec bins |
 |
 |
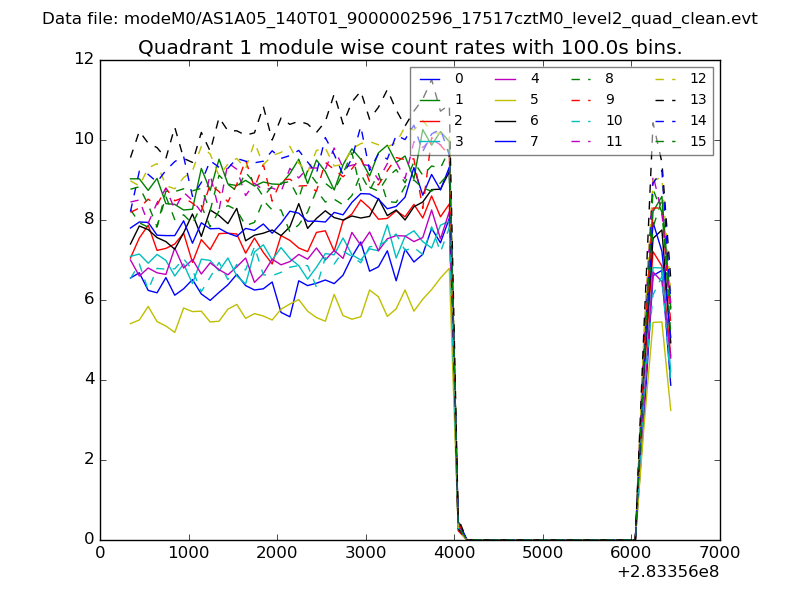
| Module-wise count rates for Quadrant B Data is divided into 100 sec bins |
 |
 |
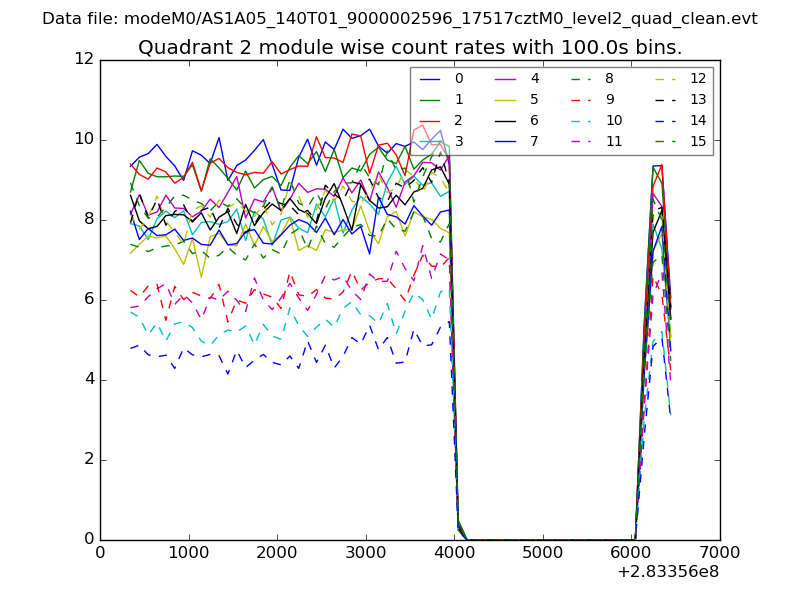
| Module-wise count rates for Quadrant C Data is divided into 100 sec bins |
 |
 |
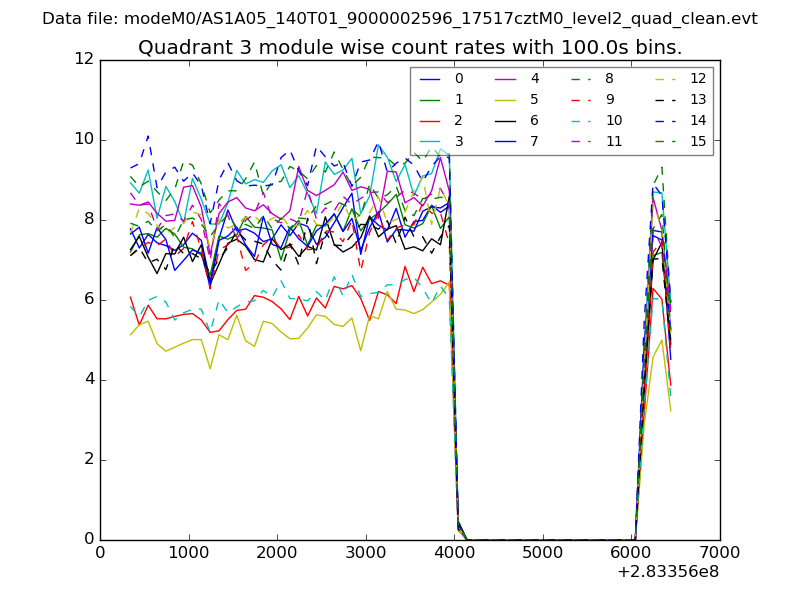
| Module-wise count rates for Quadrant D Data is divided into 100 sec bins |
 |
 |
| Parameter | Plot |
|---|---|
| CZT HV Monitor | 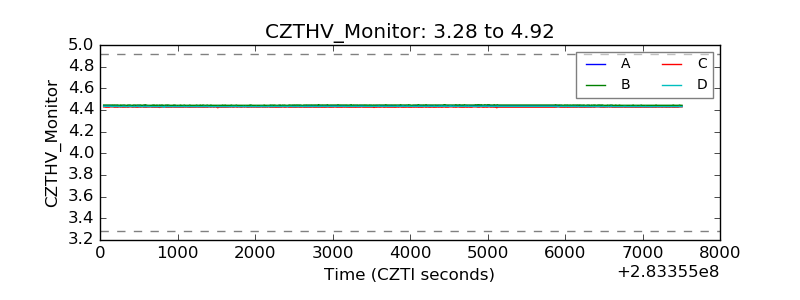 |
| D_VDD | 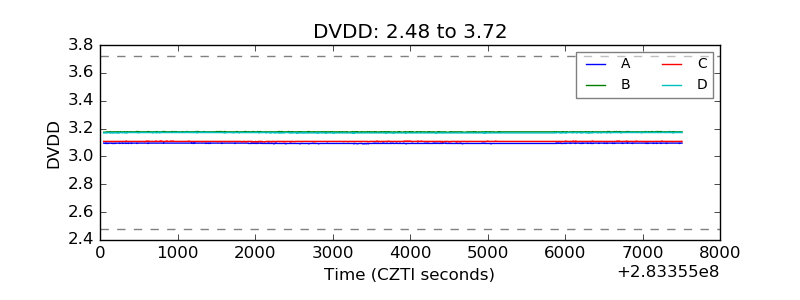 |
| Temperature 1 |  |
| Veto HV Monitor | 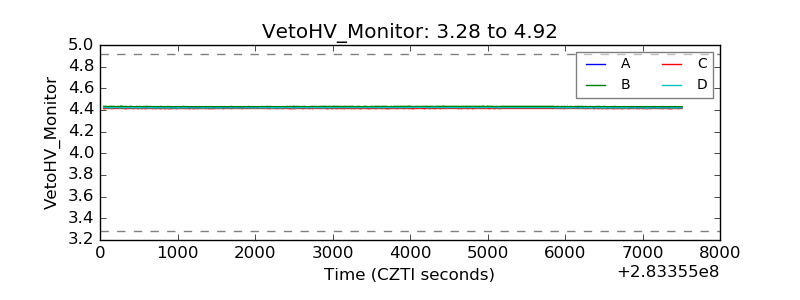 |
| Veto LLD | 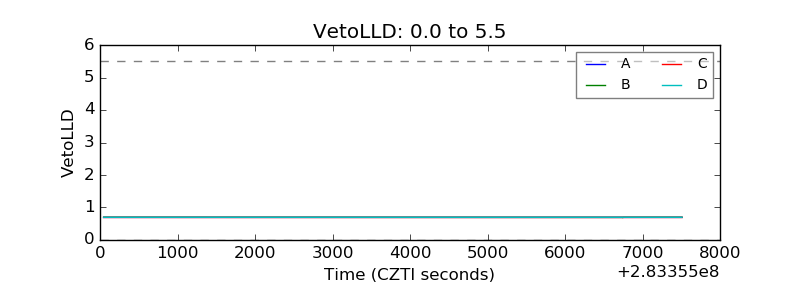 |
| Alpha Counter | 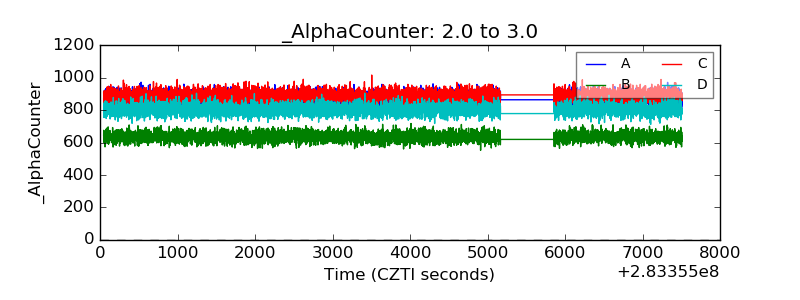 |
| _CPM_Rate | 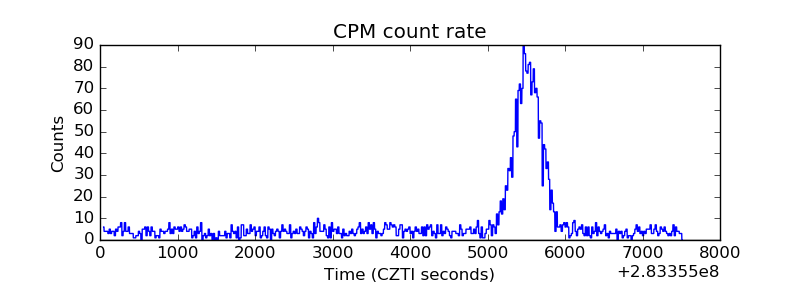 |
| CZT Counter | 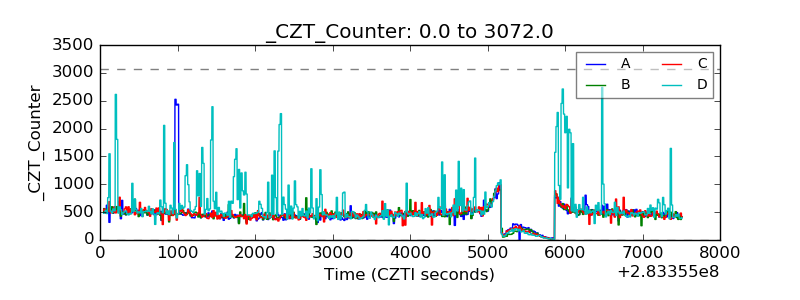 |
| +2.5 Volts monitor |  |
| +5 Volts monitor | 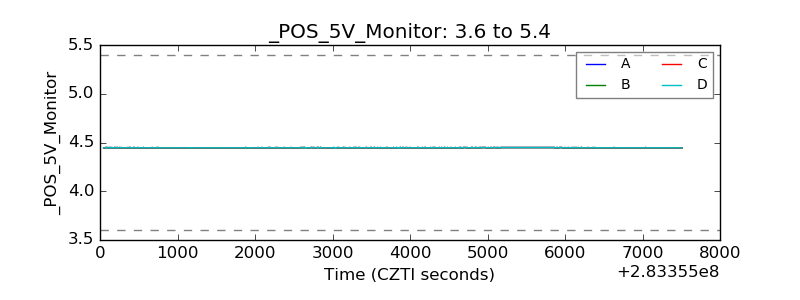 |
| _ROLL_ROT | 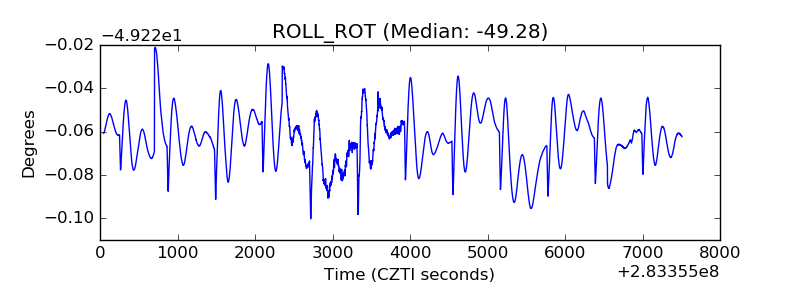 |
| _Roll_DEC | 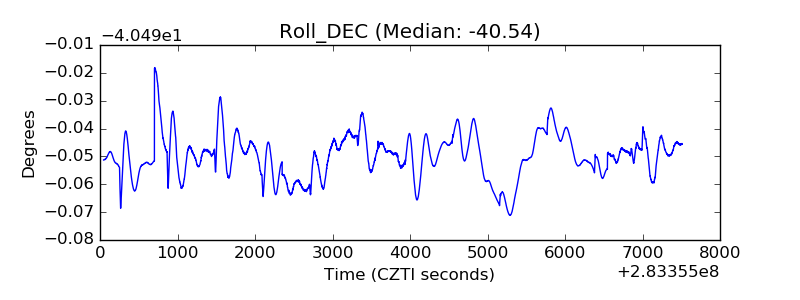 |
| _Roll_RA | 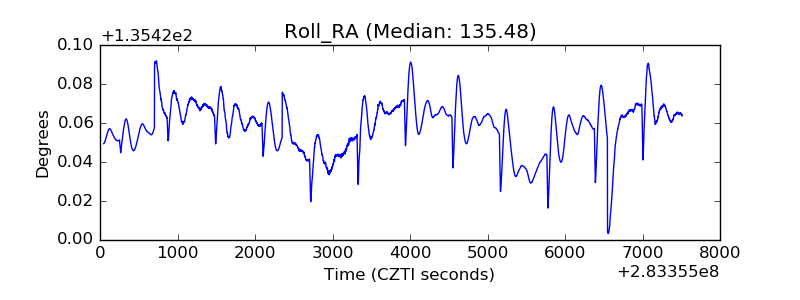 |
| Veto Counter | 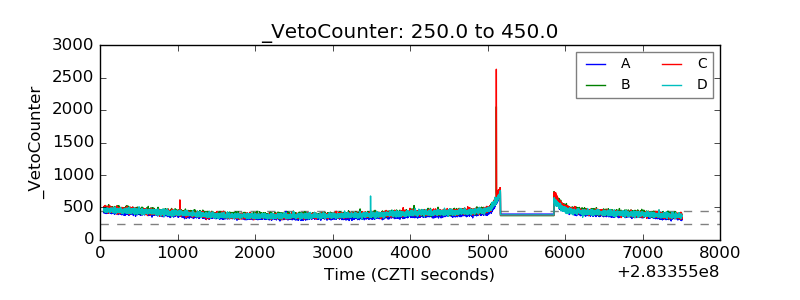 |