| Param | Original file | Final file |
|---|---|---|
| Filename | modeM0/AS1A05_140T01_9000002596_17522cztM0_level2.evt | modeM0/AS1A05_140T01_9000002596_17522cztM0_level2_quad_clean.evt |
| Size (bytes) | 771,912,000 | 148,947,840 |
| Size | 736.2 MB | 142.0 MB |
| Events in quadrant A | 5,450,143 | 952,146 |
| Events in quadrant B | 5,497,701 | 952,350 |
| Events in quadrant C | 5,536,468 | 904,809 |
| Events in quadrant D | 6,106,256 | 898,817 |
| Mode SS | |||
|---|---|---|---|
| Quadrant | BADHDUFLAG | Total packets | Discarded packets |
| A | 0 | 238 | 0 |
| B | 0 | 238 | 0 |
| C | 0 | 238 | 0 |
| D | 0 | 238 | 0 |
| Mode M0 | |||
|---|---|---|---|
| Quadrant | BADHDUFLAG | Total packets | Discarded packets |
| A | 0 | 24058 | 2 |
| B | 0 | 23947 | 2 |
| C | 0 | 24041 | 2 |
| D | 0 | 26160 | 2 |
| Mode M9 | |||
|---|---|---|---|
| Quadrant | BADHDUFLAG | Total packets | Discarded packets |
| A | 0 | 10 | 0 |
| B | 0 | 10 | 0 |
| C | 0 | 10 | 0 |
| D | 0 | 10 | 0 |
| Quadrant | Total seconds | Saturated seconds | Saturation percentage |
|---|---|---|---|
| A | 11601 | 161 | 1.387811% |
| B | 11601 | 188 | 1.620550% |
| C | 11601 | 205 | 1.767089% |
| D | 11601 | 307 | 2.646324% |
Noise dominated data is calculated using 1-second bins in cleaned event files. If a bin has >2000 counts, and if more than 50% of those come from <1% of pixels, then it is considered to be noise-dominated and hence unusable.
| Quadrant | # 1 sec bins | Bins with >0 counts | Bins with >2000 counts | High rate bins dominated by noise | Noise dominated (total time) | Noise dominated (detector-on time) | Marked lightcurve |
|---|---|---|---|---|---|---|---|
| A | 12616 | 11602 | 4 | 4 | 0.03% | 0.03% | 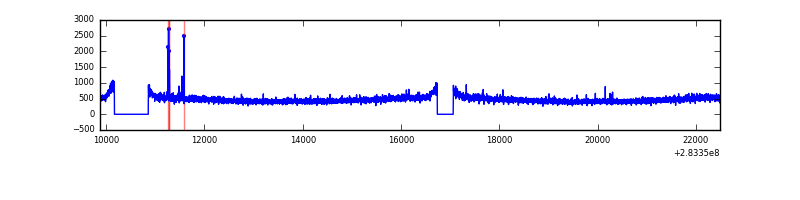 |
| B | 12616 | 11603 | 1 | 1 | 0.01% | 0.01% | 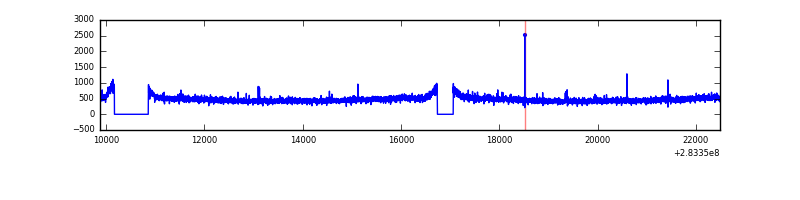 |
| C | 12616 | 11603 | 0 | 0 | 0.00% | 0.00% | 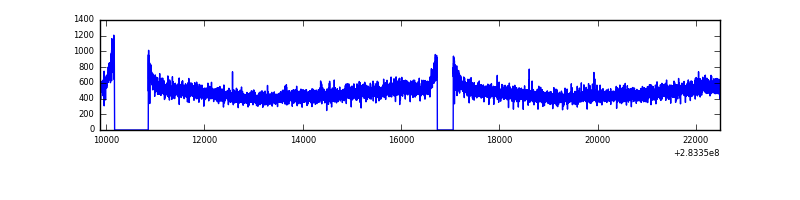 |
| D | 12616 | 11603 | 155 | 155 | 1.23% | 1.34% | 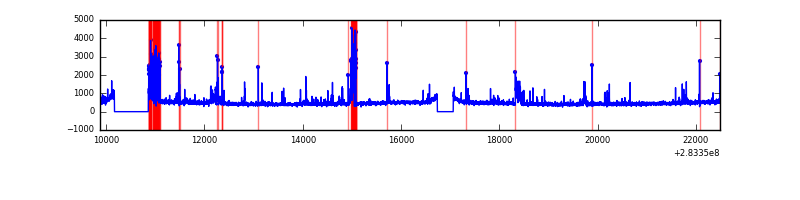 |
Top three noisy pixels from each quadrant. If the there are fewer than three noisy pixels in the level2.evt file, extra rows are filled as -1
| Pixel properties | Quadrant properties | ||||||
|---|---|---|---|---|---|---|---|
| Quadrant | DetID | PixID | Counts | Sigma | Mean | Median | Sigma |
| A | 15 | 174 | 42912 | 146.24 | 1405 | 1373 | 284.0 |
| A | 0 | 226 | 12482 | 39.11 | 1405 | 1373 | 284.0 |
| A | 3 | 137 | 10516 | 32.19 | 1405 | 1373 | 284.0 |
| B | 12 | 111 | 32179 | 115.3 | 1400 | 1367 | 267.2 |
| B | 11 | 111 | 28042 | 99.82 | 1400 | 1367 | 267.2 |
| B | 14 | 111 | 23598 | 83.19 | 1400 | 1367 | 267.2 |
| C | 14 | 238 | 206875 | 647.5 | 1344 | 1350 | 317.4 |
| C | 3 | 233 | 45415 | 138.82 | 1344 | 1350 | 317.4 |
| C | 5 | 218 | 27690 | 82.98 | 1344 | 1350 | 317.4 |
| D | 5 | 222 | 347439 | 1055.1 | 1353 | 1315 | 328.0 |
| D | 2 | 33 | 210758 | 638.45 | 1353 | 1315 | 328.0 |
| D | 13 | 189 | 150615 | 455.11 | 1353 | 1315 | 328.0 |
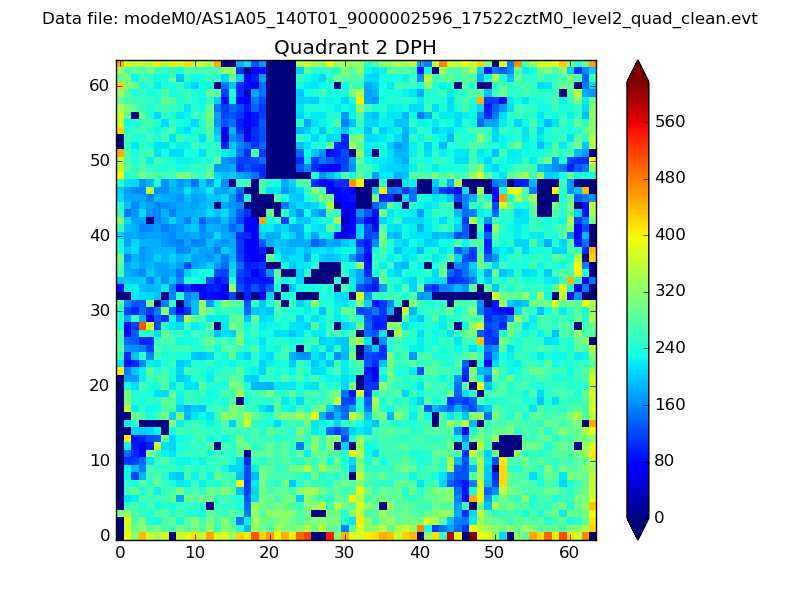
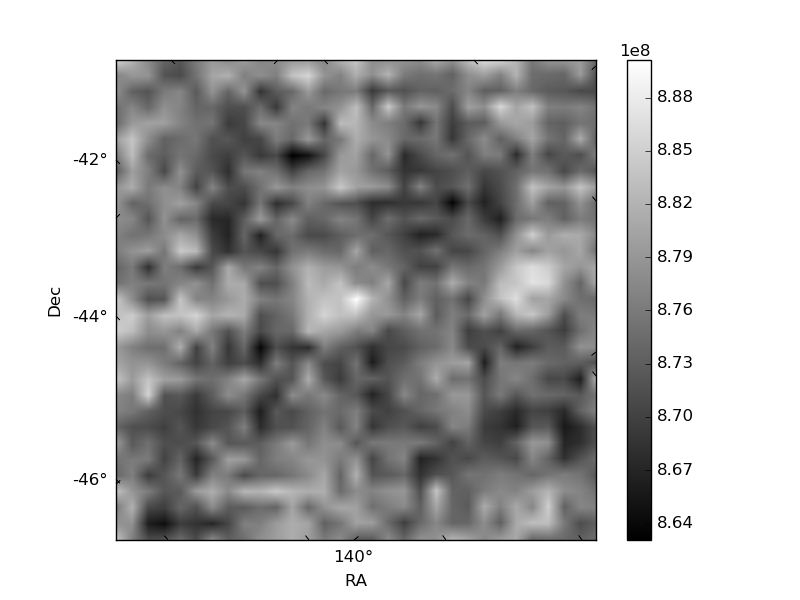
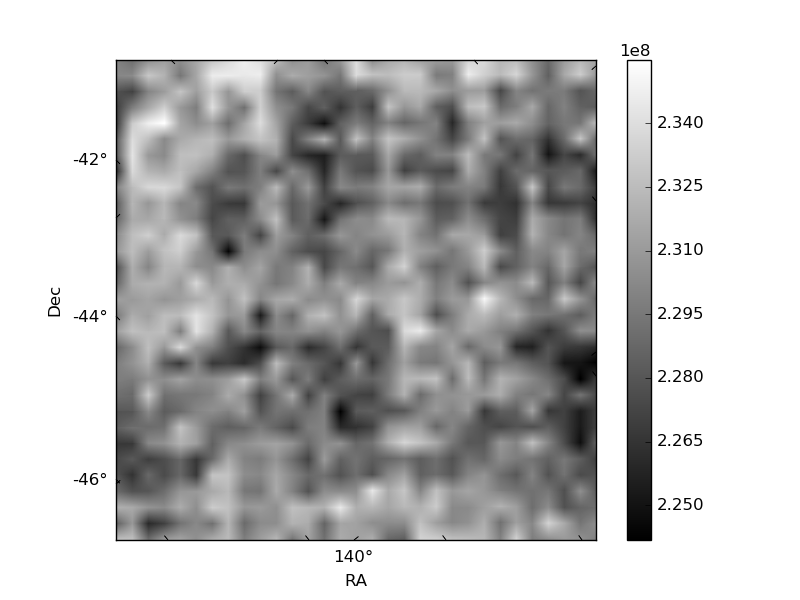
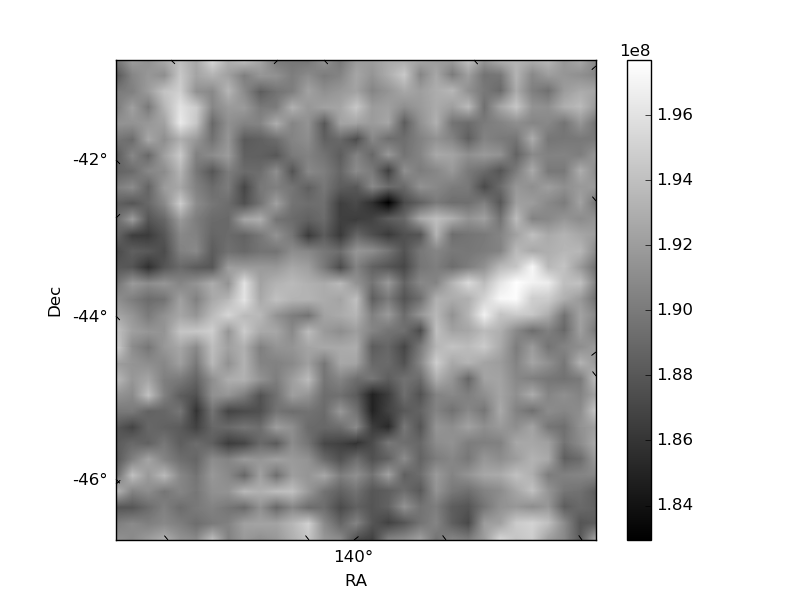
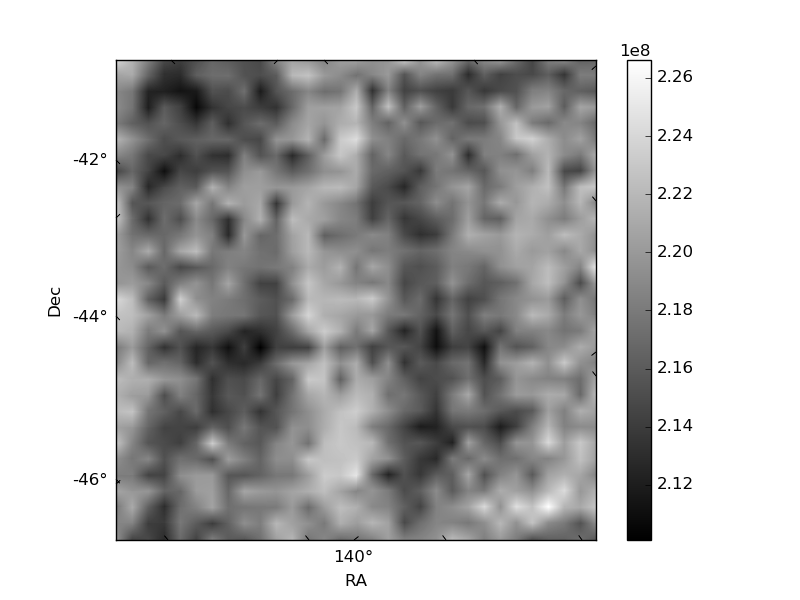
Histogram calculated using DETX and DETY for each event in the final _common_clean file
| Quadrant A | 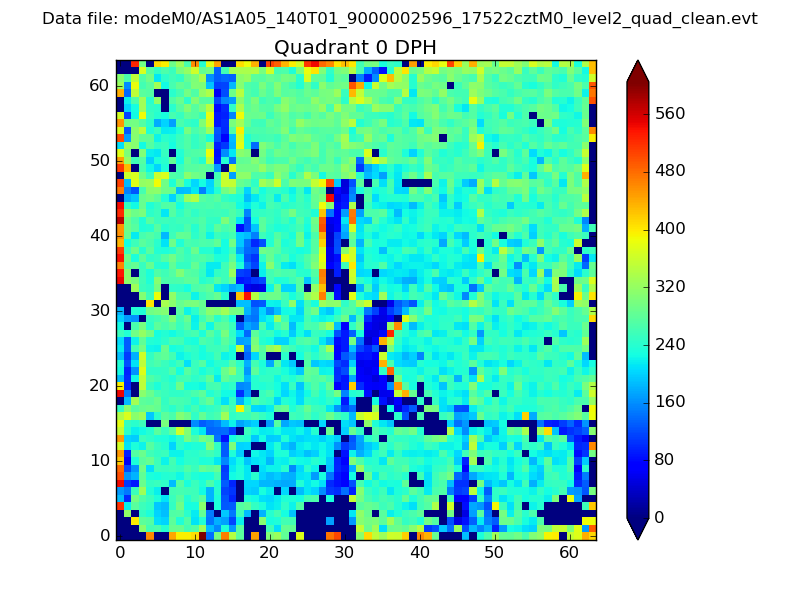 |
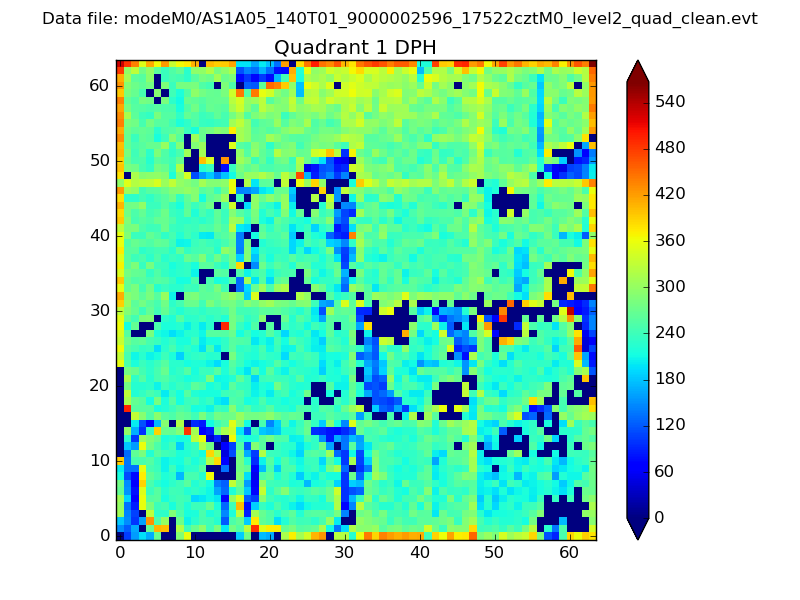 |
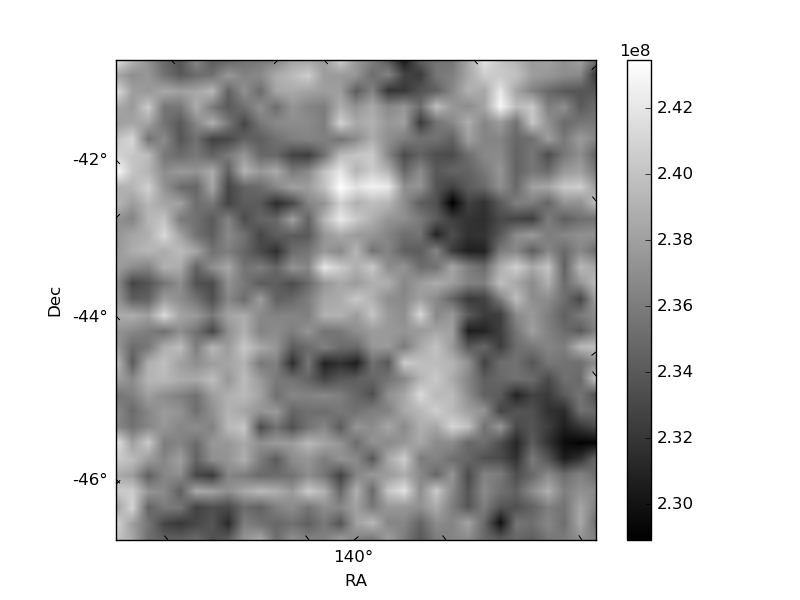
Quadrant B |
|---|---|---|---|
| Quadrant D | 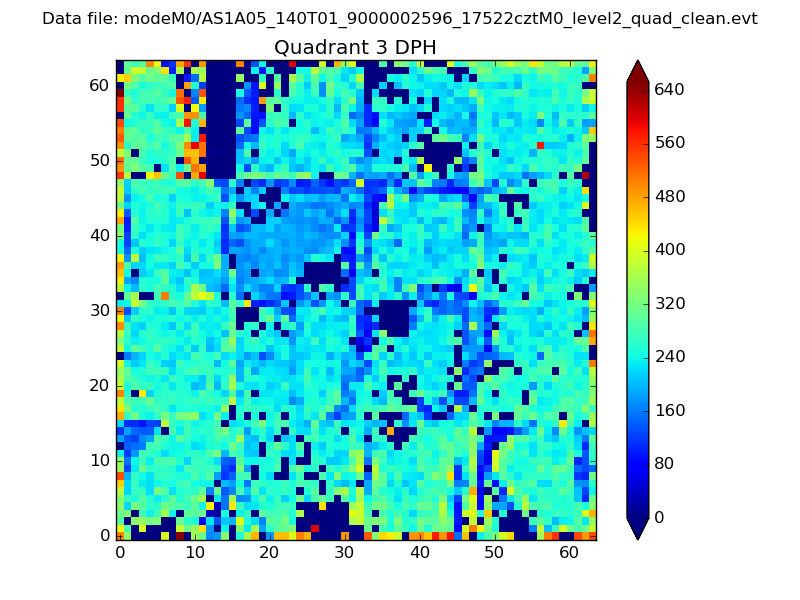 |
 |
Quadrant C |
| Plot type | Count rate plots | Images |
|---|---|---|
| Comparison with Poisson distribution Blue bars denote a histogram of data divided into 1 sec bins. Red curve is a Poisson curve with rate = median count rate of data. |
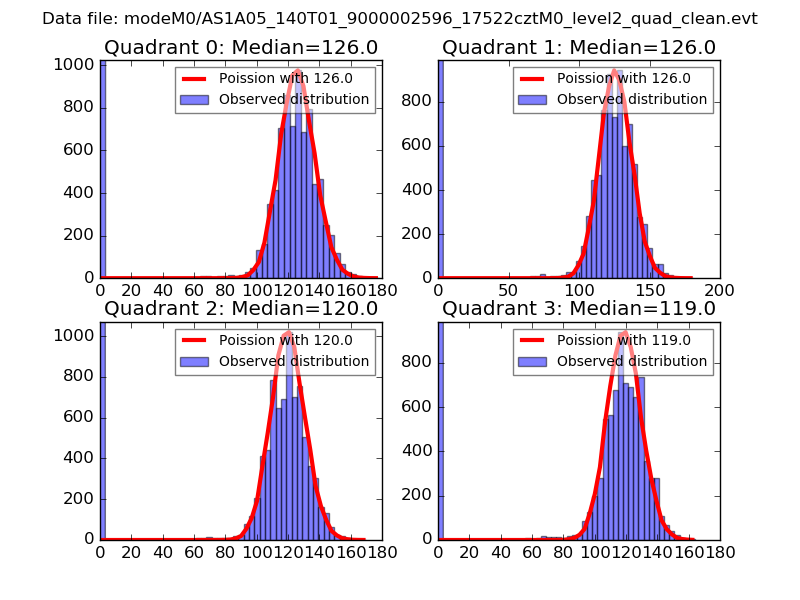 |
 |
| Quadrant-wise count rates Data is divided into 100 sec bins |
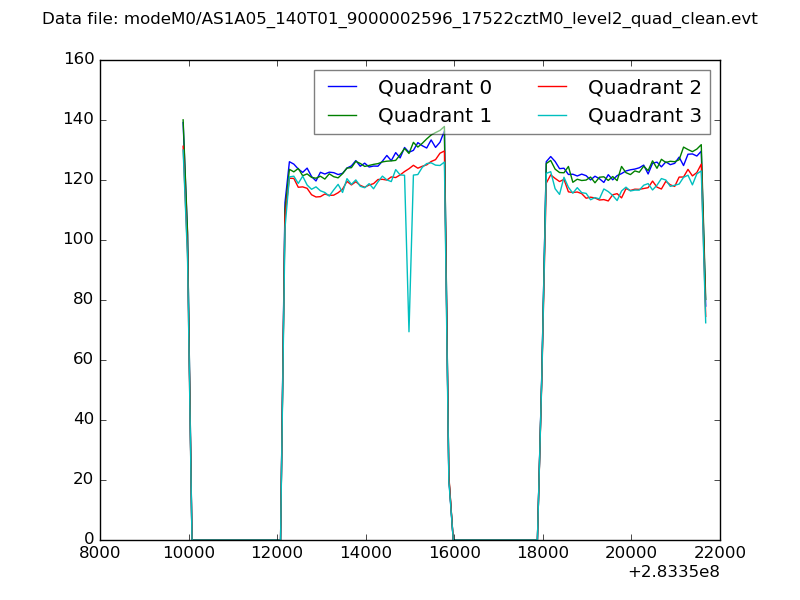 |
|
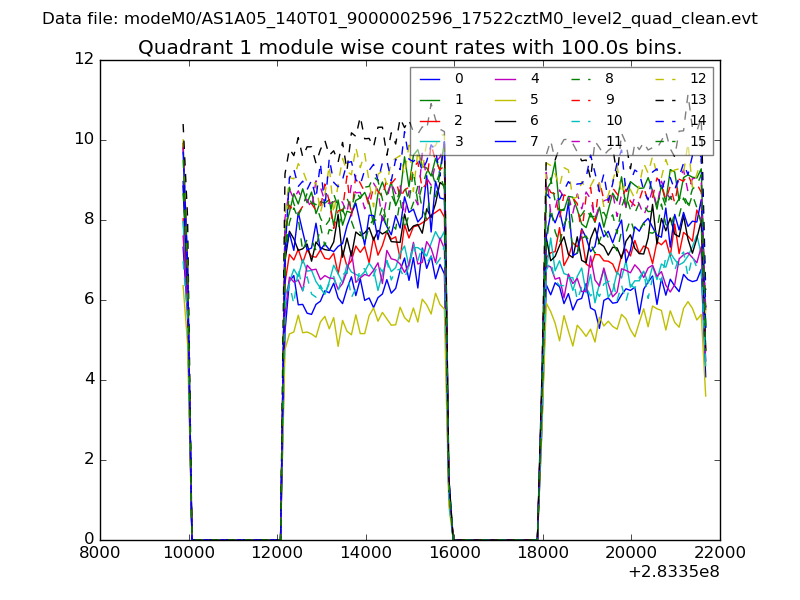
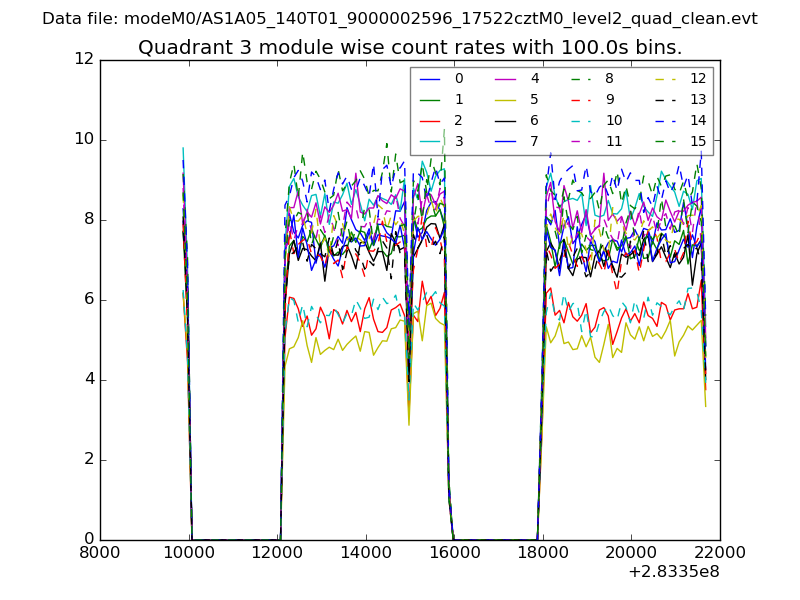
| Module-wise count rates for Quadrant A Data is divided into 100 sec bins |
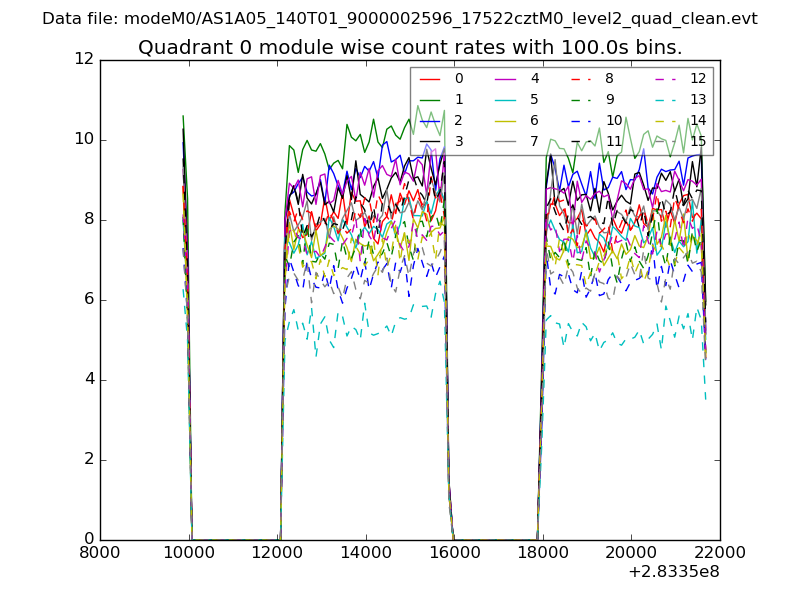 |
 |
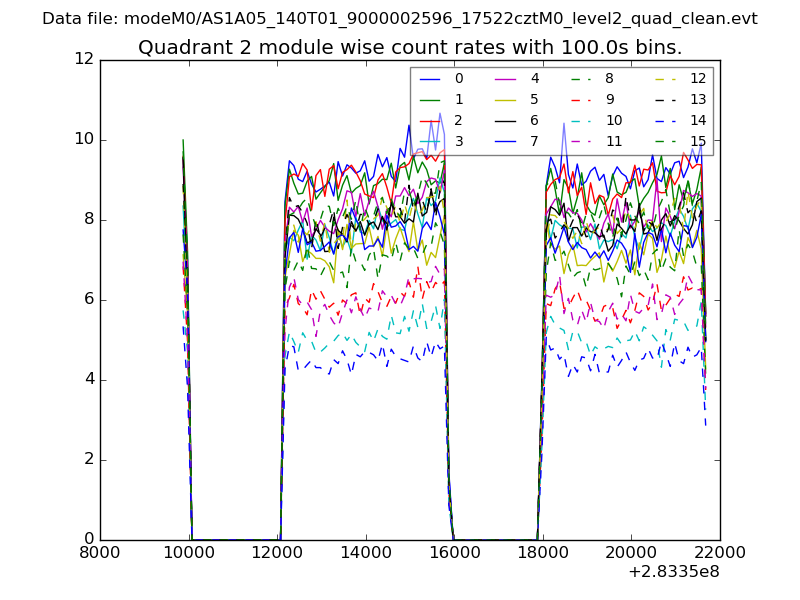
| Module-wise count rates for Quadrant B Data is divided into 100 sec bins |
 |
 |
| Module-wise count rates for Quadrant C Data is divided into 100 sec bins |
 |
 |
| Module-wise count rates for Quadrant D Data is divided into 100 sec bins |
 |
 |
| Parameter | Plot |
|---|---|
| CZT HV Monitor | 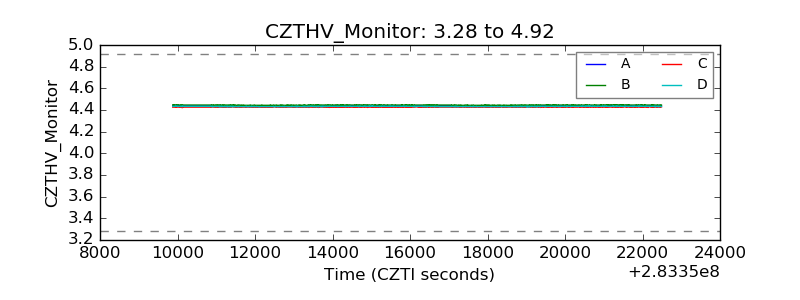 |
| D_VDD | 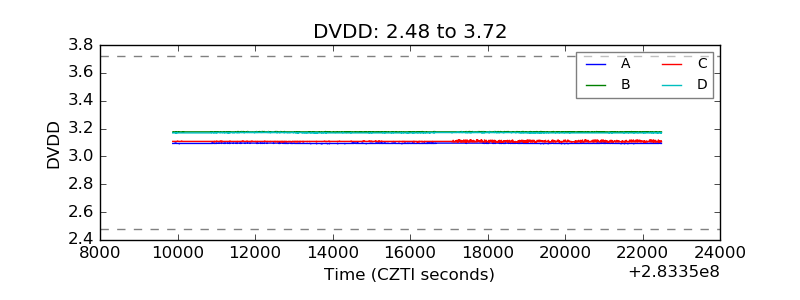 |
| Temperature 1 | 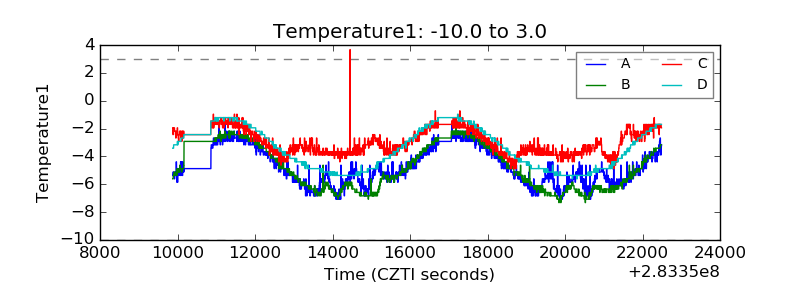 |
| Veto HV Monitor | 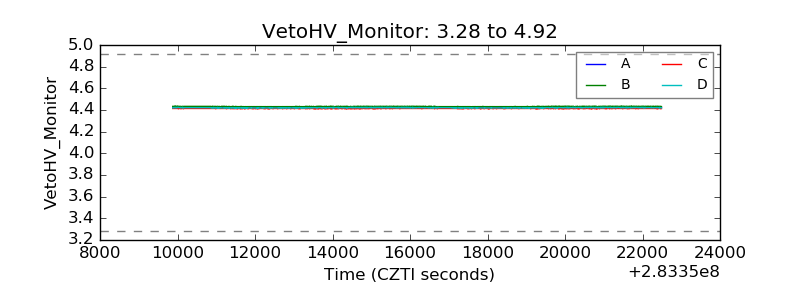 |
| Veto LLD | 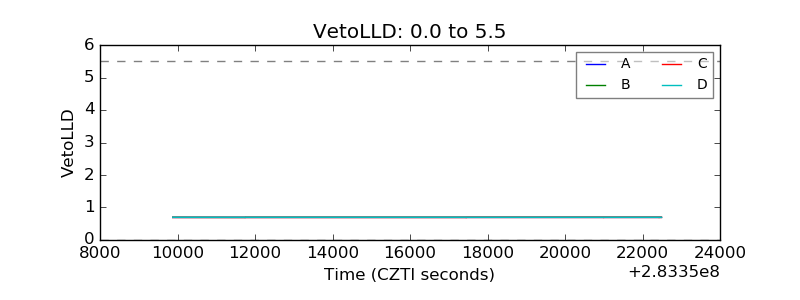 |
| Alpha Counter | 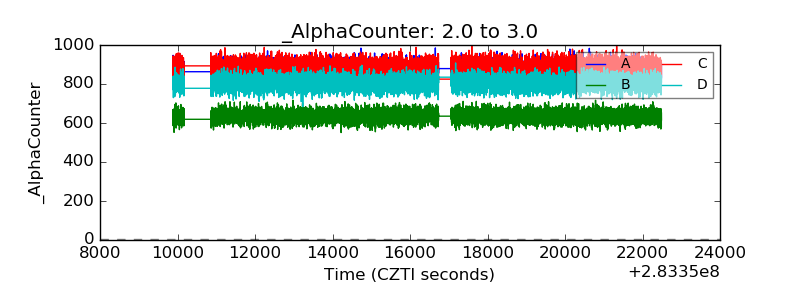 |
| _CPM_Rate | 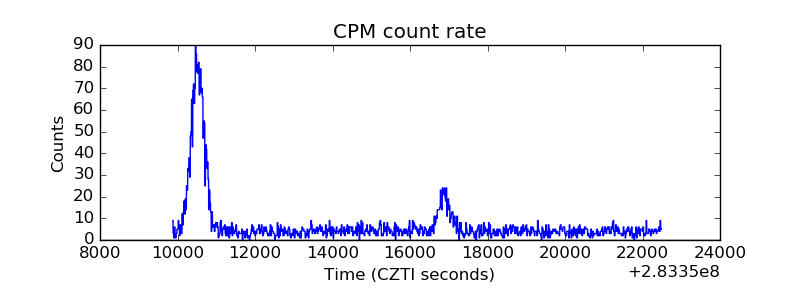 |
| CZT Counter | 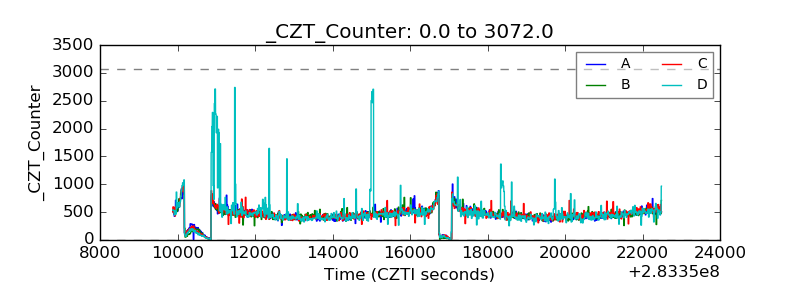 |
| +2.5 Volts monitor |  |
| +5 Volts monitor |  |
| _ROLL_ROT | 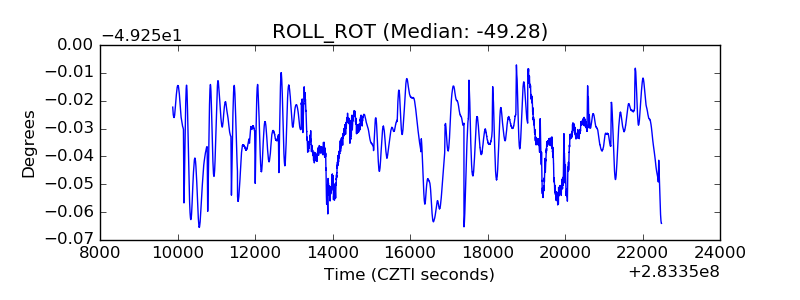 |
| _Roll_DEC | 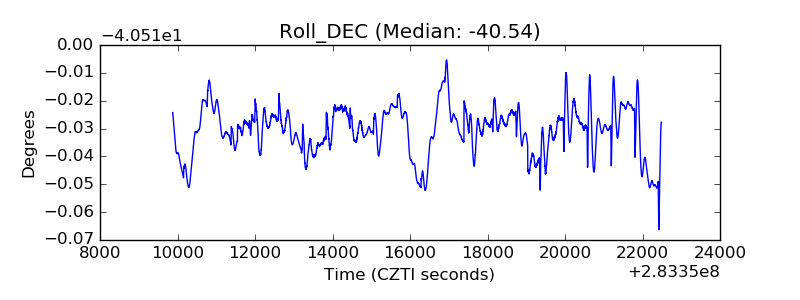 |
| _Roll_RA | 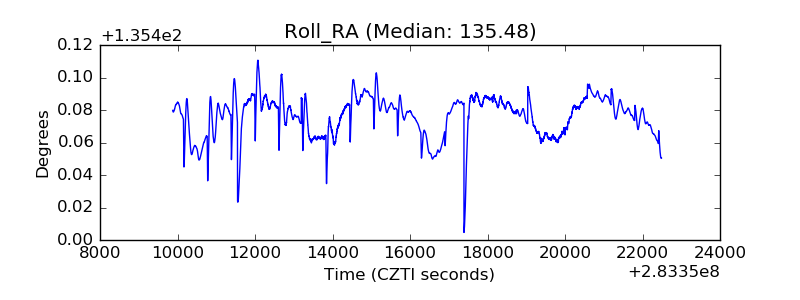 |
| Veto Counter | 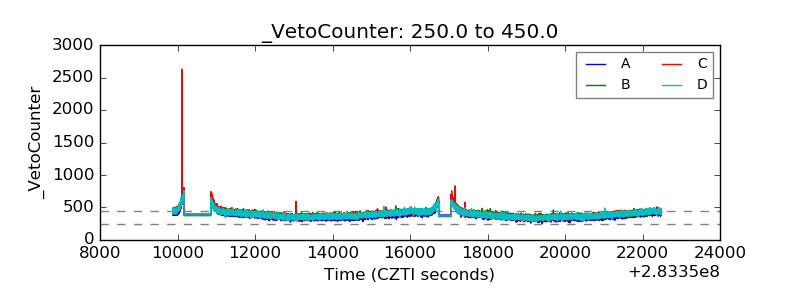 |