| Param | Original file | Final file |
|---|---|---|
| Filename | modeM0/AS1A05_140T01_9000002596_17523cztM0_level2.evt | modeM0/AS1A05_140T01_9000002596_17523cztM0_level2_quad_clean.evt |
| Size (bytes) | 1,747,517,760 | 310,363,200 |
| Size | 1.6 GB | 296.0 MB |
| Events in quadrant A | 13,267,247 | 1,941,754 |
| Events in quadrant B | 12,036,453 | 1,975,369 |
| Events in quadrant C | 12,707,714 | 1,877,417 |
| Events in quadrant D | 13,181,894 | 1,844,307 |
| Mode SS | |||
|---|---|---|---|
| Quadrant | BADHDUFLAG | Total packets | Discarded packets |
| A | 0 | 522 | 0 |
| B | 0 | 522 | 0 |
| C | 0 | 522 | 0 |
| D | 0 | 522 | 0 |
| Mode M0 | |||
|---|---|---|---|
| Quadrant | BADHDUFLAG | Total packets | Discarded packets |
| A | 0 | 56860 | 5 |
| B | 0 | 52406 | 5 |
| C | 0 | 53944 | 5 |
| D | 0 | 56678 | 5 |
| Mode M9 | |||
|---|---|---|---|
| Quadrant | BADHDUFLAG | Total packets | Discarded packets |
| A | 0 | 30 | 0 |
| B | 0 | 30 | 0 |
| C | 0 | 30 | 0 |
| D | 0 | 30 | 0 |
| Quadrant | Total seconds | Saturated seconds | Saturation percentage |
|---|---|---|---|
| A | 25610 | 510 | 1.991410% |
| B | 25611 | 174 | 0.679396% |
| C | 25611 | 302 | 1.179181% |
| D | 25611 | 225 | 0.878529% |
Noise dominated data is calculated using 1-second bins in cleaned event files. If a bin has >2000 counts, and if more than 50% of those come from <1% of pixels, then it is considered to be noise-dominated and hence unusable.
| Quadrant | # 1 sec bins | Bins with >0 counts | Bins with >2000 counts | High rate bins dominated by noise | Noise dominated (total time) | Noise dominated (detector-on time) | Marked lightcurve |
|---|---|---|---|---|---|---|---|
| A | 28625 | 25616 | 177 | 177 | 0.62% | 0.69% | 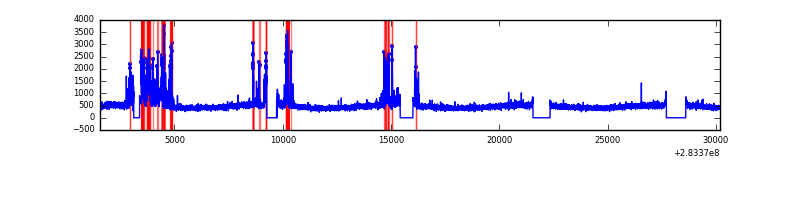 |
| B | 28626 | 25617 | 3 | 3 | 0.01% | 0.01% | 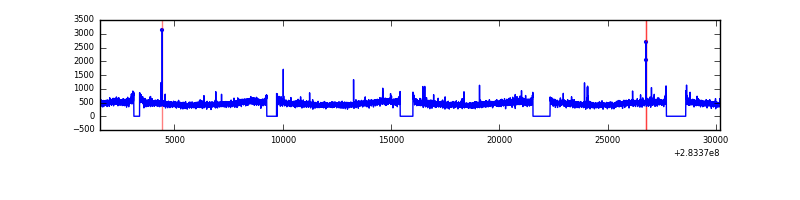 |
| C | 28626 | 25617 | 0 | 0 | 0.00% | 0.00% | 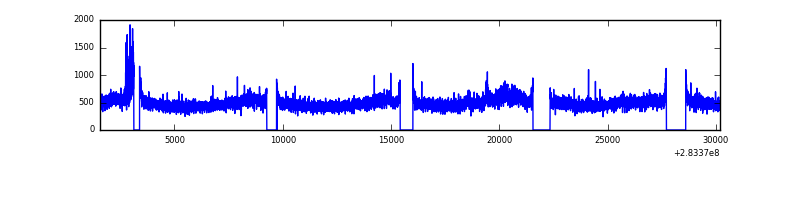 |
| D | 28626 | 25617 | 159 | 159 | 0.56% | 0.62% | 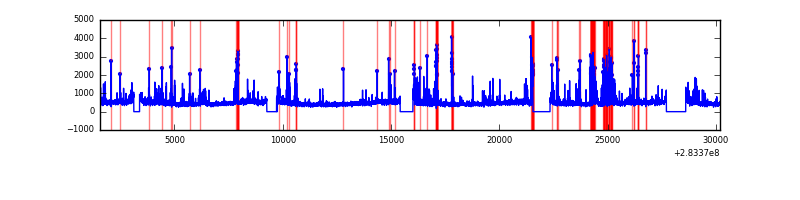 |
Top three noisy pixels from each quadrant. If the there are fewer than three noisy pixels in the level2.evt file, extra rows are filled as -1
| Pixel properties | Quadrant properties | ||||||
|---|---|---|---|---|---|---|---|
| Quadrant | DetID | PixID | Counts | Sigma | Mean | Median | Sigma |
| A | 15 | 174 | 1528084 | 2490.68 | 3051 | 2983 | 612.3 |
| A | 0 | 226 | 26312 | 38.1 | 3051 | 2983 | 612.3 |
| A | 3 | 137 | 23135 | 32.91 | 3051 | 2983 | 612.3 |
| B | 12 | 111 | 72101 | 117.8 | 3067 | 2986 | 586.7 |
| B | 11 | 111 | 62702 | 101.78 | 3067 | 2986 | 586.7 |
| B | 14 | 111 | 53892 | 86.77 | 3067 | 2986 | 586.7 |
| C | 3 | 233 | 626441 | 895.23 | 2957 | 2972 | 696.4 |
| C | 14 | 238 | 453611 | 647.07 | 2957 | 2972 | 696.4 |
| C | 5 | 218 | 100911 | 140.63 | 2957 | 2972 | 696.4 |
| D | 5 | 222 | 1231992 | 1704.87 | 2981 | 2899 | 720.9 |
| D | 13 | 189 | 491285 | 677.44 | 2981 | 2899 | 720.9 |
| D | 13 | 232 | 102216 | 137.76 | 2981 | 2899 | 720.9 |
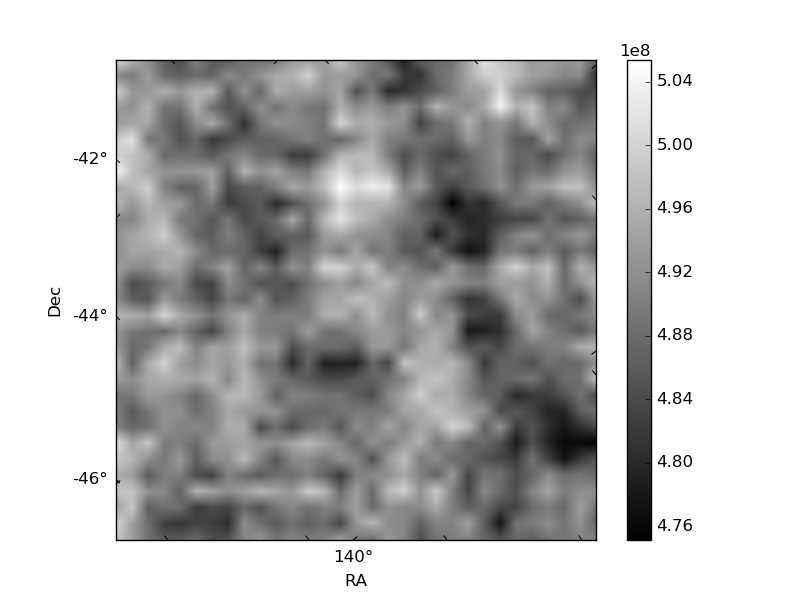
Histogram calculated using DETX and DETY for each event in the final _common_clean file
| Quadrant A |  |
 |
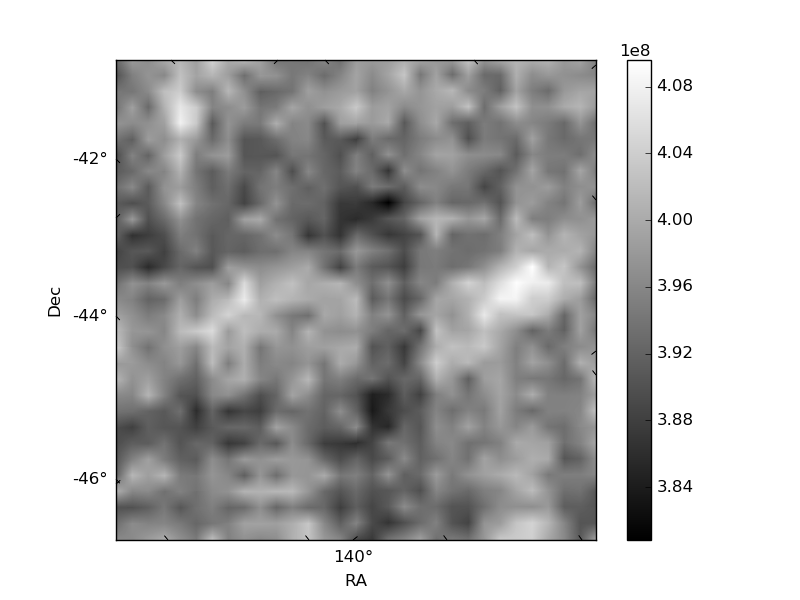
Quadrant B |
|---|---|---|---|
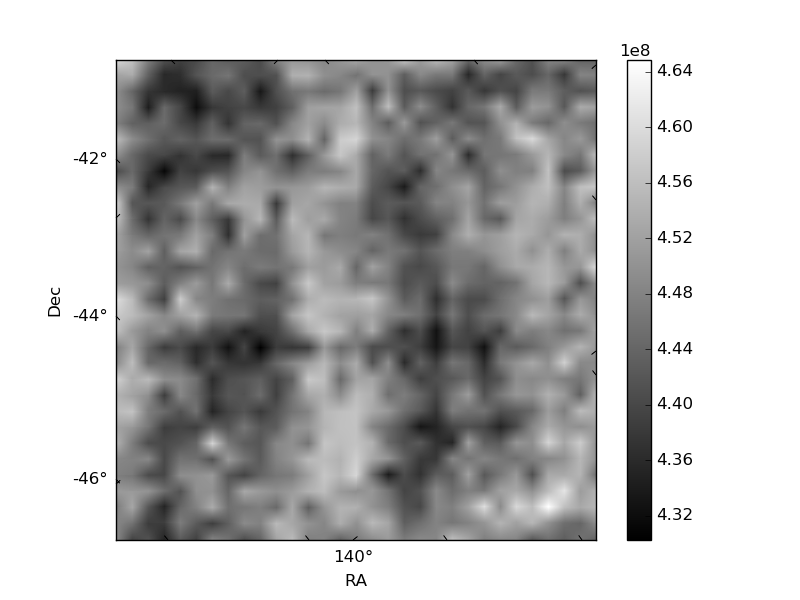
| Quadrant D |  |
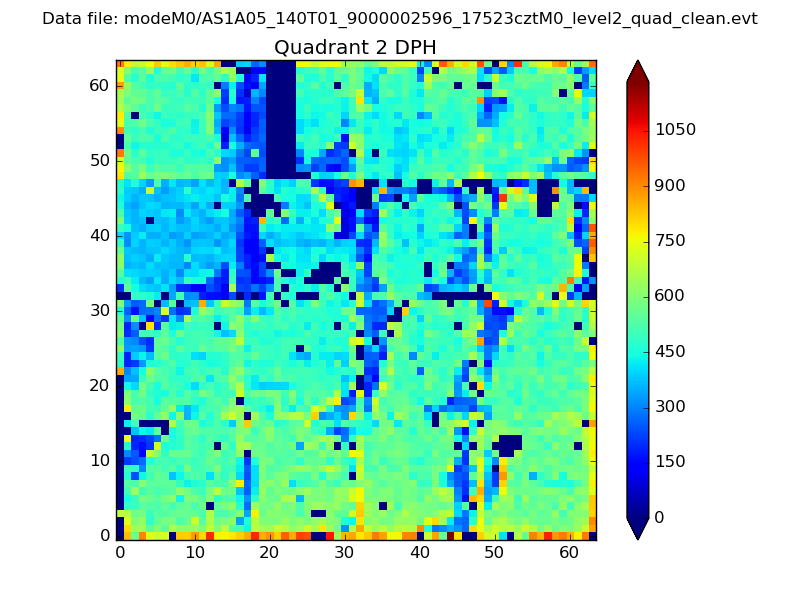 |
Quadrant C |
| Plot type | Count rate plots | Images |
|---|---|---|
| Comparison with Poisson distribution Blue bars denote a histogram of data divided into 1 sec bins. Red curve is a Poisson curve with rate = median count rate of data. |
 |
 |
| Quadrant-wise count rates Data is divided into 100 sec bins |
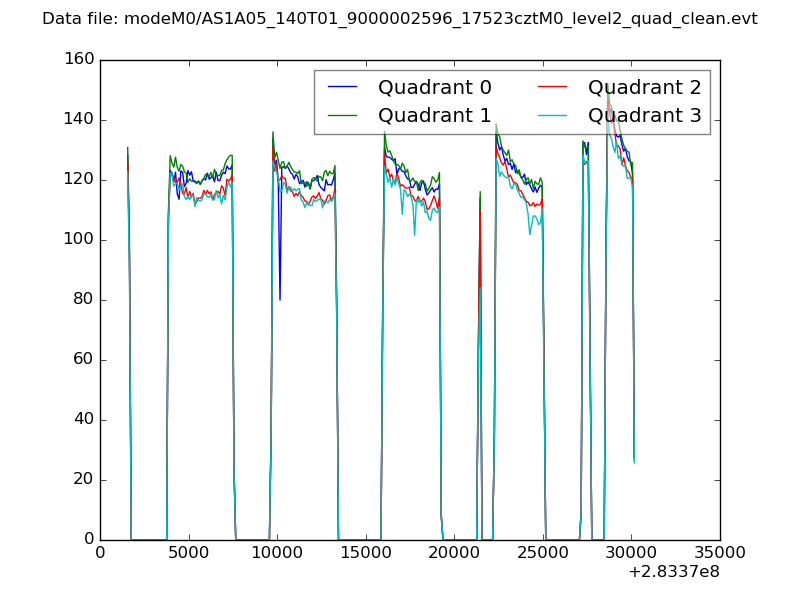 |
|
| Module-wise count rates for Quadrant A Data is divided into 100 sec bins |
 |
 |
| Module-wise count rates for Quadrant B Data is divided into 100 sec bins |
 |
 |
| Module-wise count rates for Quadrant C Data is divided into 100 sec bins |
 |
 |
| Module-wise count rates for Quadrant D Data is divided into 100 sec bins |
 |
 |
| Parameter | Plot |
|---|---|
| CZT HV Monitor |  |
| D_VDD | 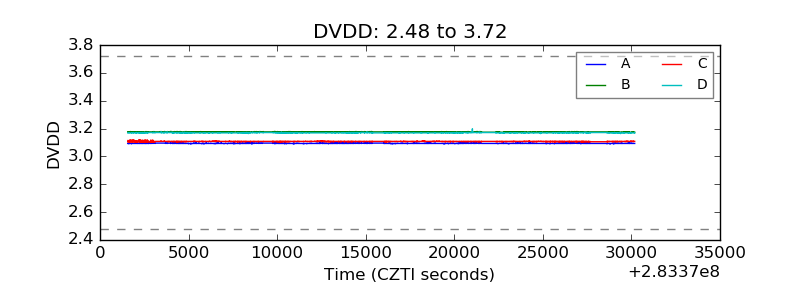 |
| Temperature 1 | 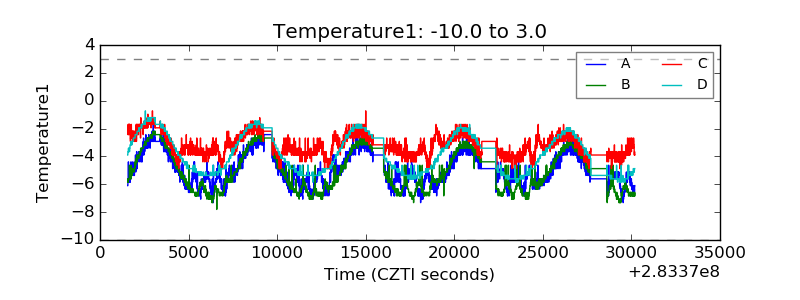 |
| Veto HV Monitor | 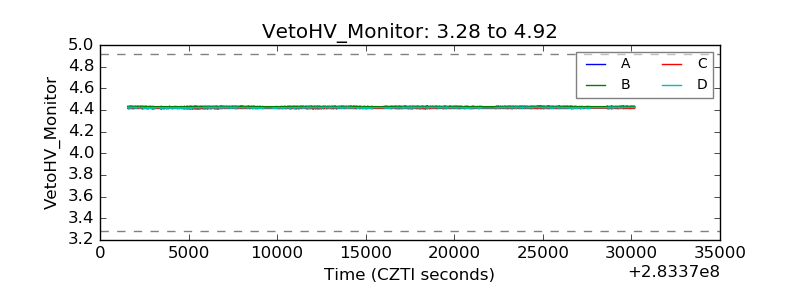 |
| Veto LLD | 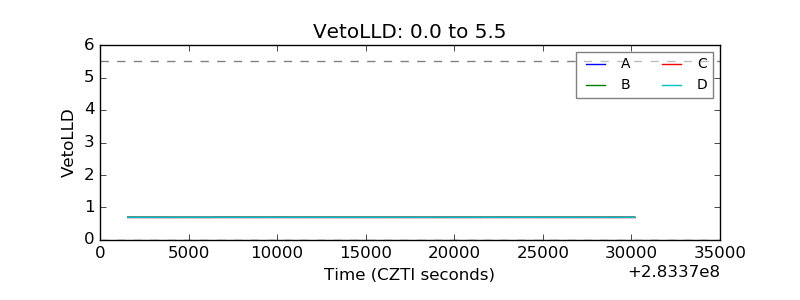 |
| Alpha Counter | 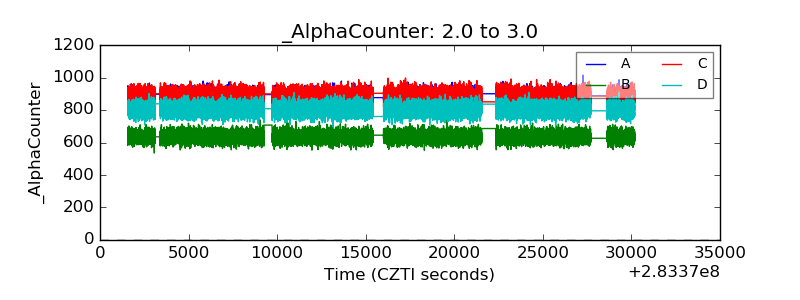 |
| _CPM_Rate | 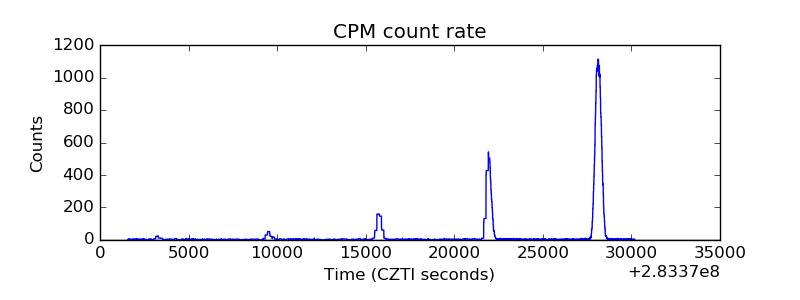 |
| CZT Counter | 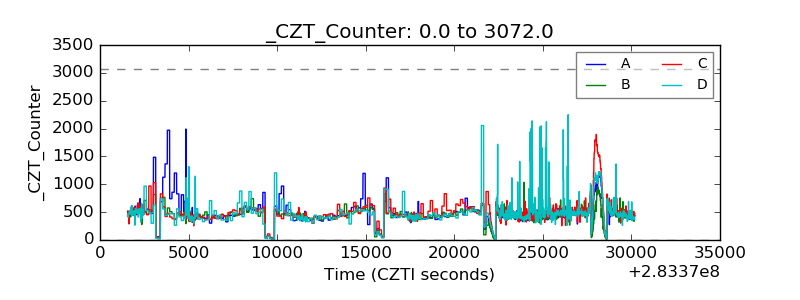 |
| +2.5 Volts monitor | 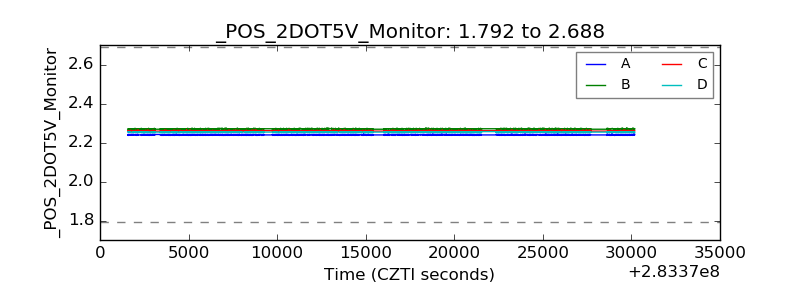 |
| +5 Volts monitor |  |
| _ROLL_ROT |  |
| _Roll_DEC | 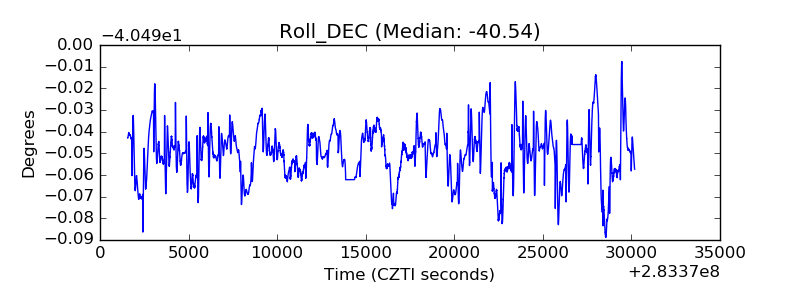 |
| _Roll_RA | 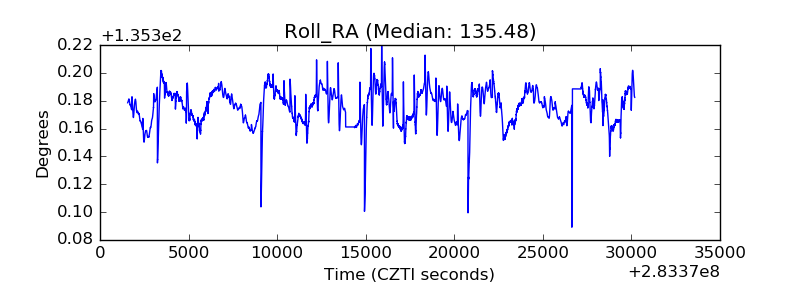 |
| Veto Counter |  |