| Param | Original file | Final file |
|---|---|---|
| Filename | modeM0/AS1A05_140T01_9000002596_17524cztM0_level2.evt | modeM0/AS1A05_140T01_9000002596_17524cztM0_level2_quad_clean.evt |
| Size (bytes) | 404,703,360 | 84,041,280 |
| Size | 386.0 MB | 80.1 MB |
| Events in quadrant A | 2,942,699 | 534,675 |
| Events in quadrant B | 2,906,365 | 546,890 |
| Events in quadrant C | 3,053,590 | 521,720 |
| Events in quadrant D | 2,937,333 | 514,236 |
| Mode SS | |||
|---|---|---|---|
| Quadrant | BADHDUFLAG | Total packets | Discarded packets |
| A | 0 | 124 | 0 |
| B | 0 | 124 | 0 |
| C | 0 | 124 | 0 |
| D | 0 | 124 | 0 |
| Mode M0 | |||
|---|---|---|---|
| Quadrant | BADHDUFLAG | Total packets | Discarded packets |
| A | 0 | 12705 | 1 |
| B | 0 | 12480 | 1 |
| C | 0 | 12784 | 1 |
| D | 0 | 12838 | 1 |
| Mode M9 | |||
|---|---|---|---|
| Quadrant | BADHDUFLAG | Total packets | Discarded packets |
| A | 0 | 11 | 0 |
| B | 0 | 11 | 0 |
| C | 0 | 11 | 0 |
| D | 0 | 11 | 0 |
| Quadrant | Total seconds | Saturated seconds | Saturation percentage |
|---|---|---|---|
| A | 6122 | 45 | 0.735054% |
| B | 6123 | 41 | 0.669606% |
| C | 6123 | 46 | 0.751266% |
| D | 6123 | 39 | 0.636943% |
Noise dominated data is calculated using 1-second bins in cleaned event files. If a bin has >2000 counts, and if more than 50% of those come from <1% of pixels, then it is considered to be noise-dominated and hence unusable.
| Quadrant | # 1 sec bins | Bins with >0 counts | Bins with >2000 counts | High rate bins dominated by noise | Noise dominated (total time) | Noise dominated (detector-on time) | Marked lightcurve |
|---|---|---|---|---|---|---|---|
| A | 7202 | 6123 | 12 | 12 | 0.17% | 0.20% | 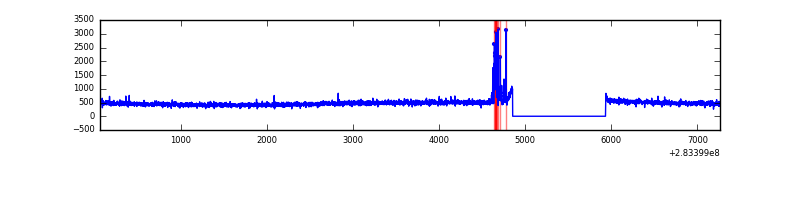 |
| B | 7203 | 6124 | 0 | 0 | 0.00% | 0.00% | 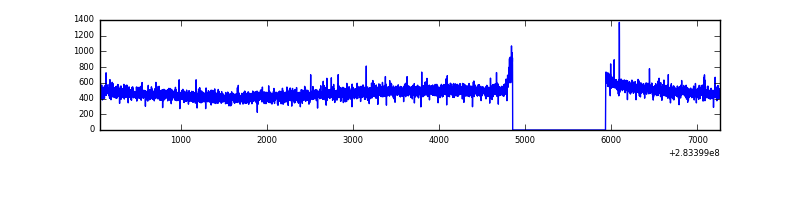 |
| C | 7203 | 6124 | 0 | 0 | 0.00% | 0.00% |  |
| D | 7203 | 6124 | 7 | 7 | 0.10% | 0.11% | 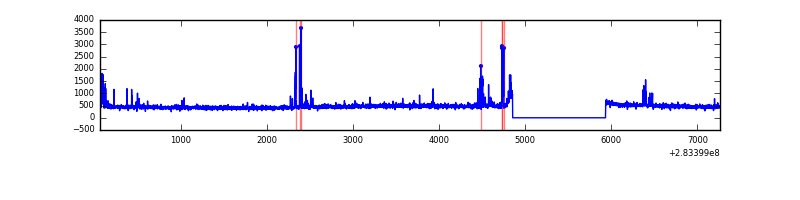 |
Top three noisy pixels from each quadrant. If the there are fewer than three noisy pixels in the level2.evt file, extra rows are filled as -1
| Pixel properties | Quadrant properties | ||||||
|---|---|---|---|---|---|---|---|
| Quadrant | DetID | PixID | Counts | Sigma | Mean | Median | Sigma |
| A | 15 | 174 | 93092 | 624.49 | 741 | 726 | 147.9 |
| A | 0 | 226 | 6504 | 39.07 | 741 | 726 | 147.9 |
| A | 3 | 137 | 5346 | 31.24 | 741 | 726 | 147.9 |
| B | 12 | 111 | 16972 | 114.82 | 741 | 722 | 141.5 |
| B | 11 | 111 | 14485 | 97.25 | 741 | 722 | 141.5 |
| B | 14 | 111 | 12740 | 84.92 | 741 | 722 | 141.5 |
| C | 14 | 238 | 112030 | 654.63 | 722 | 727 | 170.0 |
| C | 3 | 233 | 98357 | 574.21 | 722 | 727 | 170.0 |
| C | 5 | 218 | 28281 | 162.06 | 722 | 727 | 170.0 |
| D | 5 | 222 | 119734 | 677.28 | 726 | 706 | 175.7 |
| D | 13 | 189 | 55440 | 311.44 | 726 | 706 | 175.7 |
| D | 2 | 234 | 25742 | 142.46 | 726 | 706 | 175.7 |
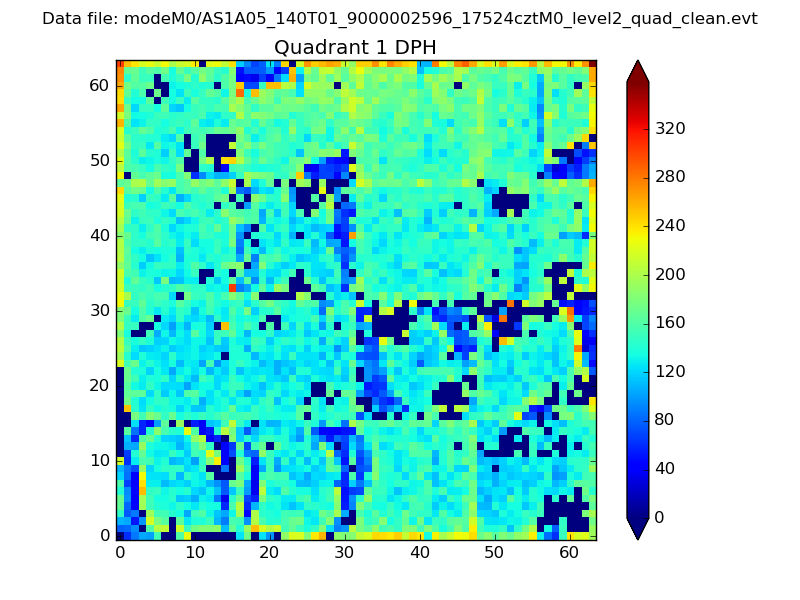
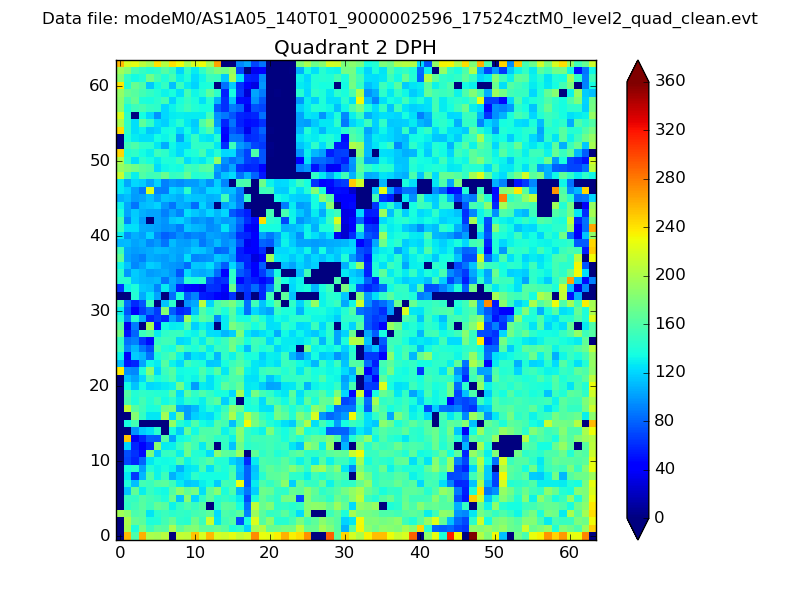
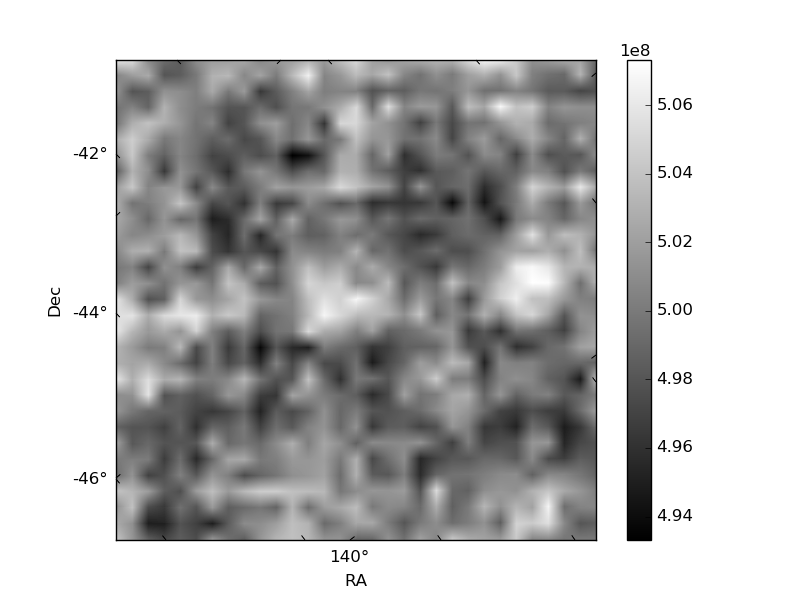
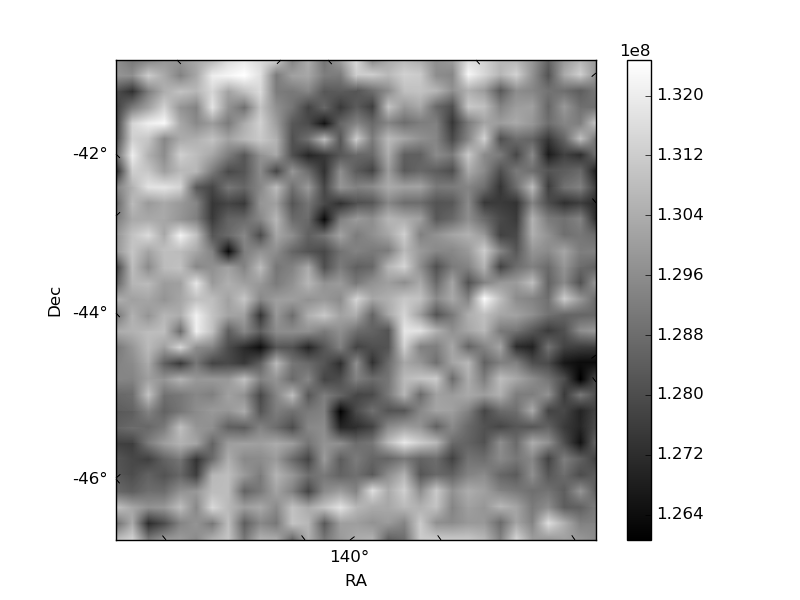
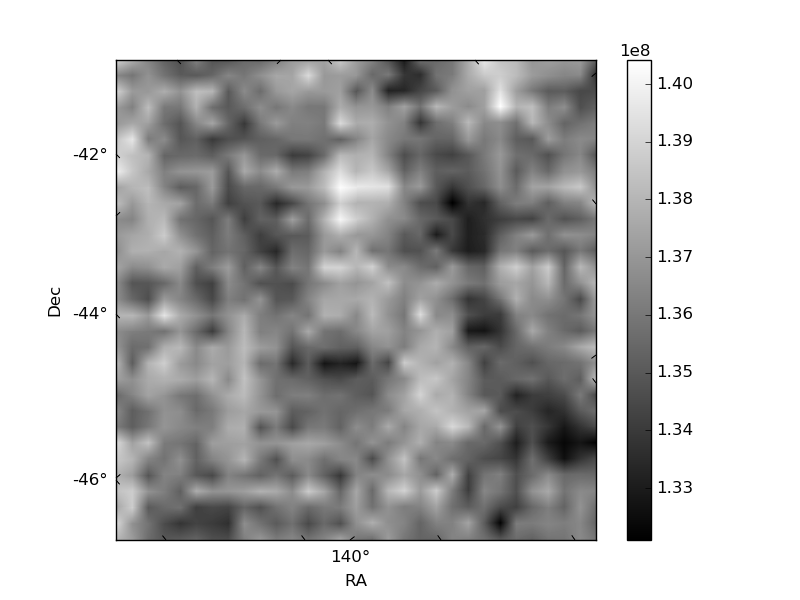
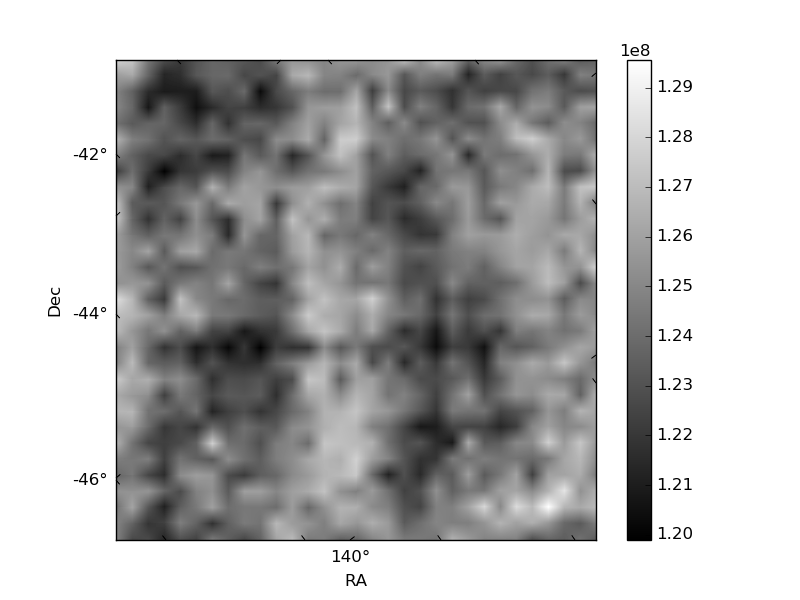
Histogram calculated using DETX and DETY for each event in the final _common_clean file
| Quadrant A | 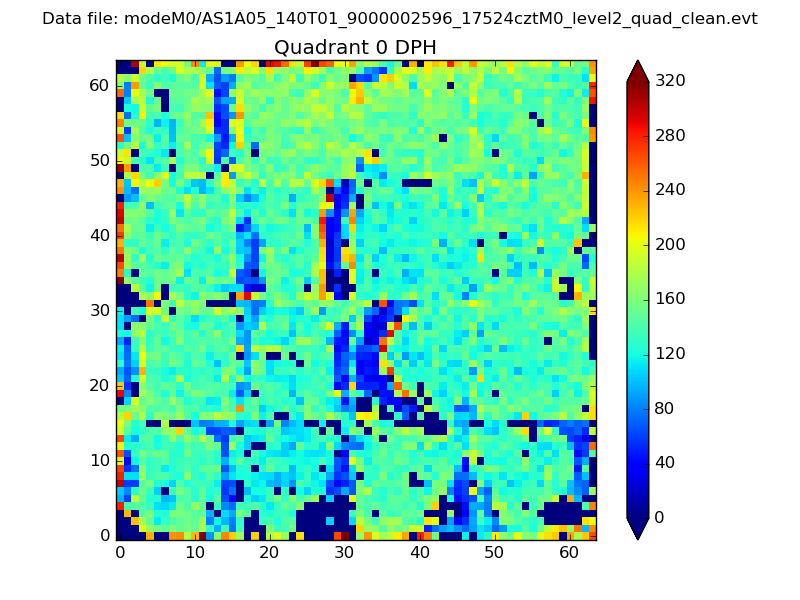 |
 |
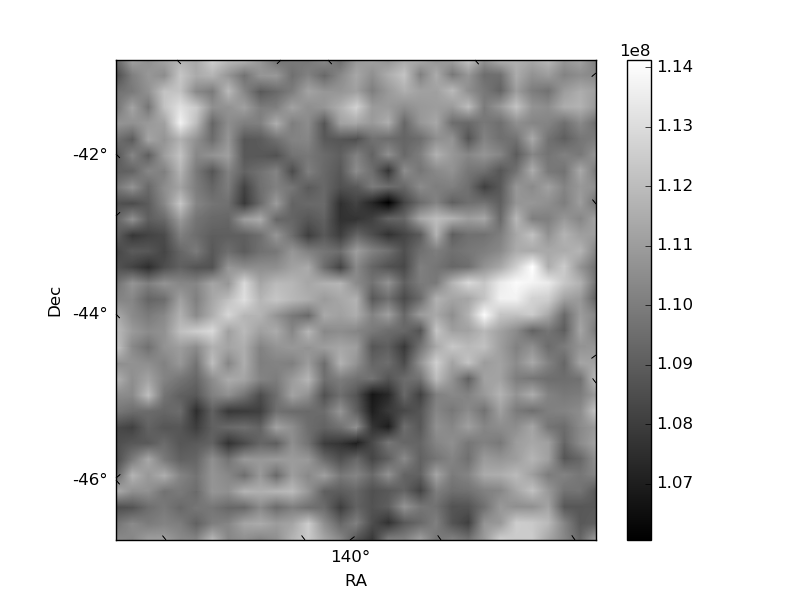
Quadrant B |
|---|---|---|---|
| Quadrant D | 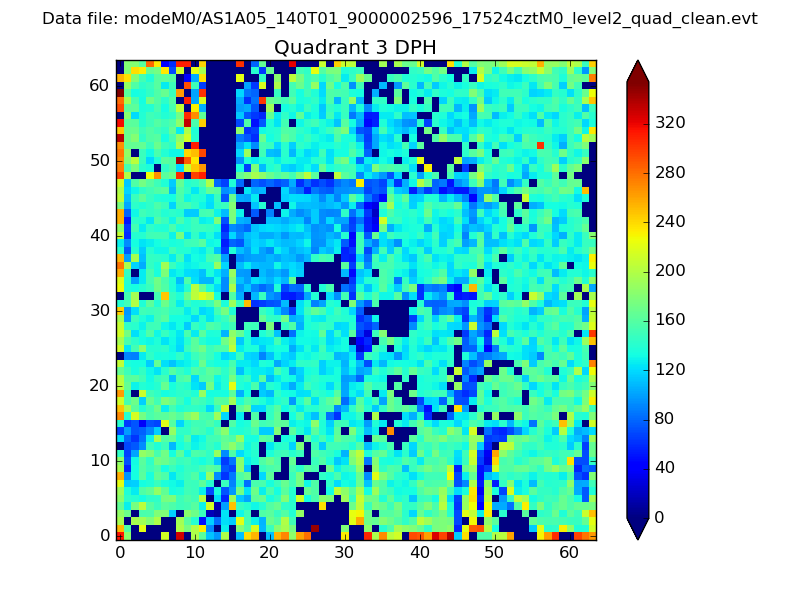 |
 |
Quadrant C |
| Plot type | Count rate plots | Images |
|---|---|---|
| Comparison with Poisson distribution Blue bars denote a histogram of data divided into 1 sec bins. Red curve is a Poisson curve with rate = median count rate of data. |
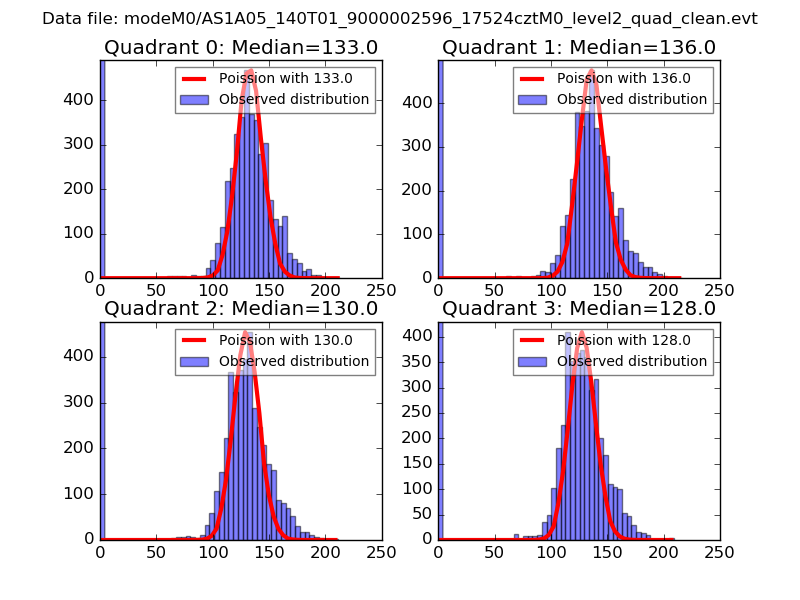 |
 |
| Quadrant-wise count rates Data is divided into 100 sec bins |
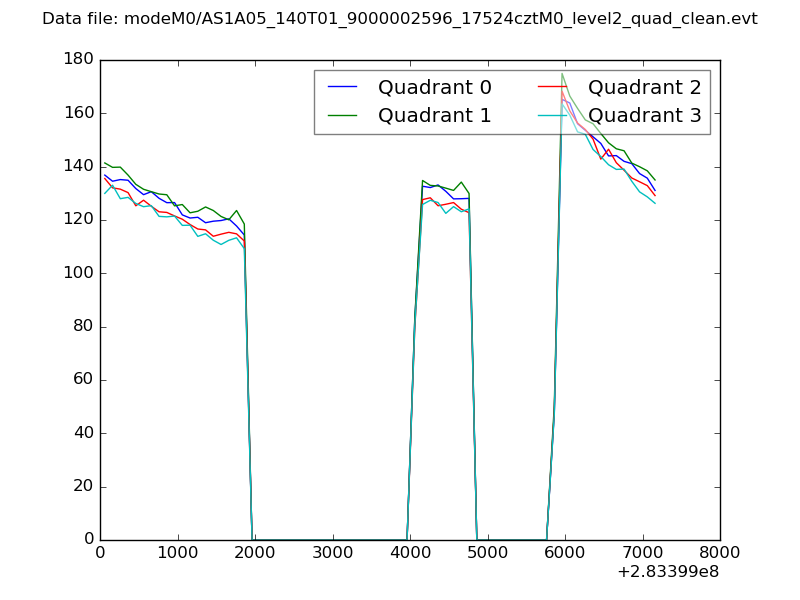 |
|
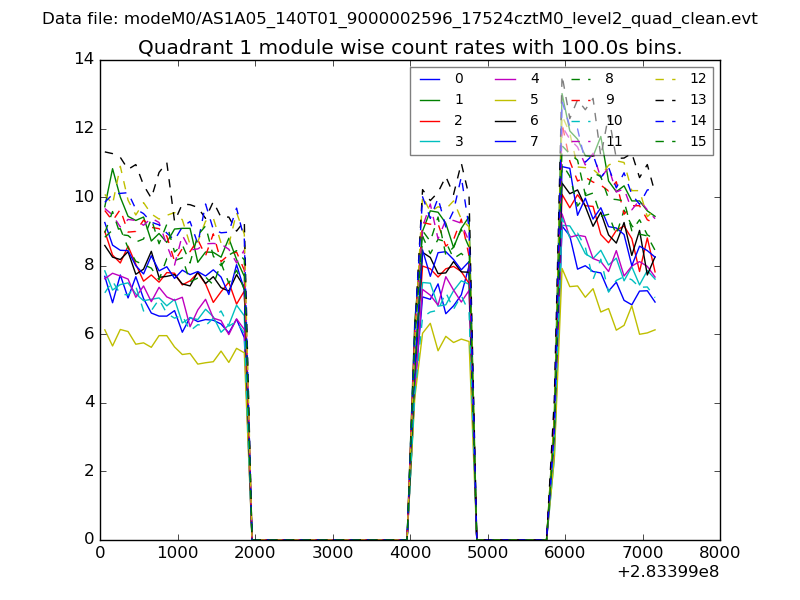
| Module-wise count rates for Quadrant A Data is divided into 100 sec bins |
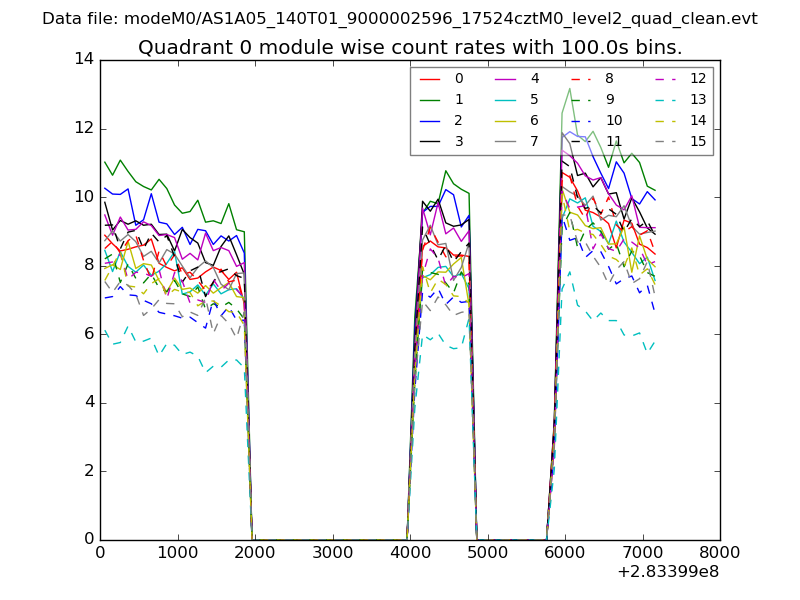 |
 |
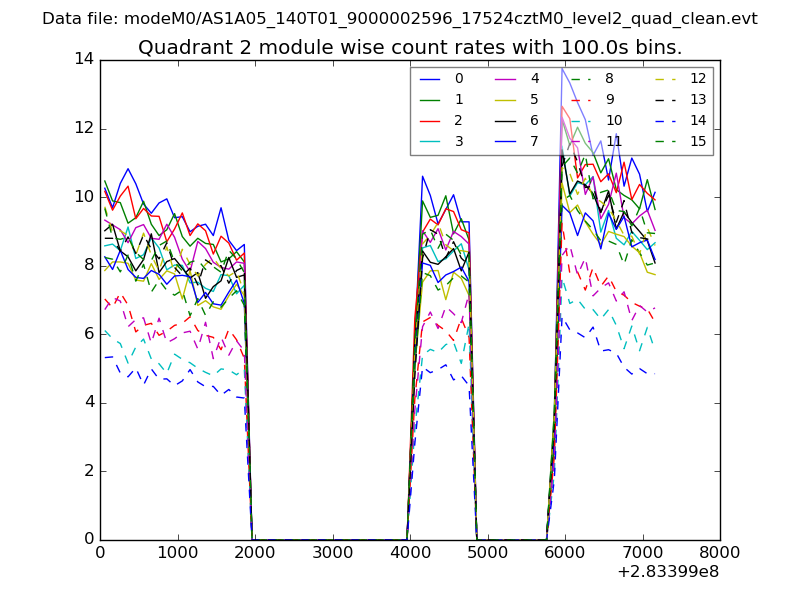
| Module-wise count rates for Quadrant B Data is divided into 100 sec bins |
 |
 |
| Module-wise count rates for Quadrant C Data is divided into 100 sec bins |
 |
 |
| Module-wise count rates for Quadrant D Data is divided into 100 sec bins |
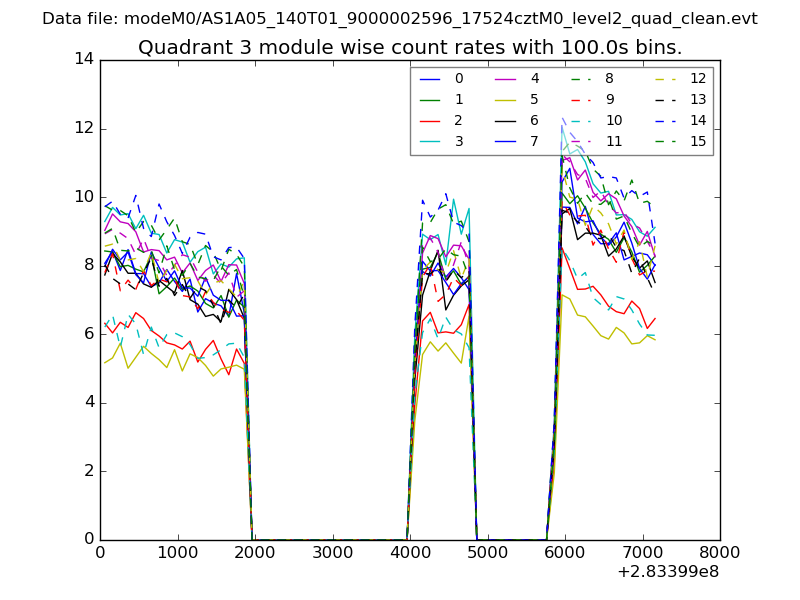 |
 |
| Parameter | Plot |
|---|---|
| CZT HV Monitor | 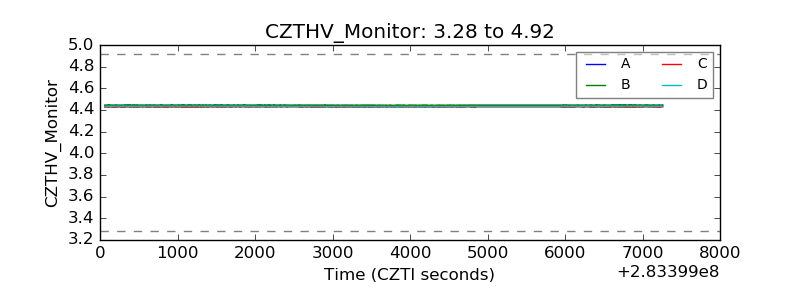 |
| D_VDD | 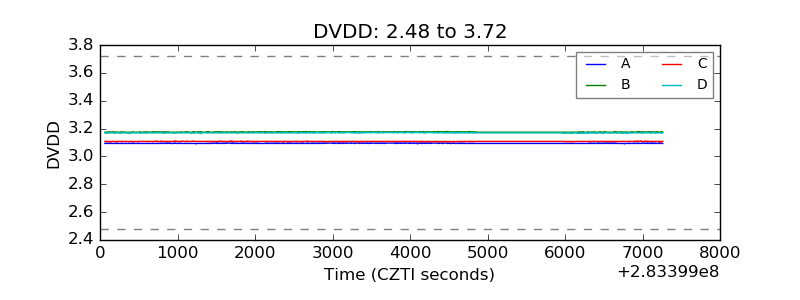 |
| Temperature 1 | 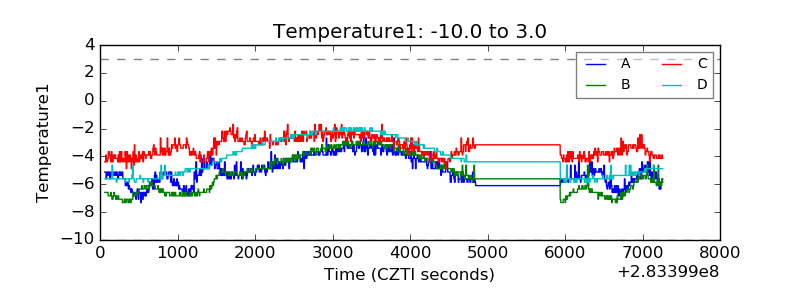 |
| Veto HV Monitor | 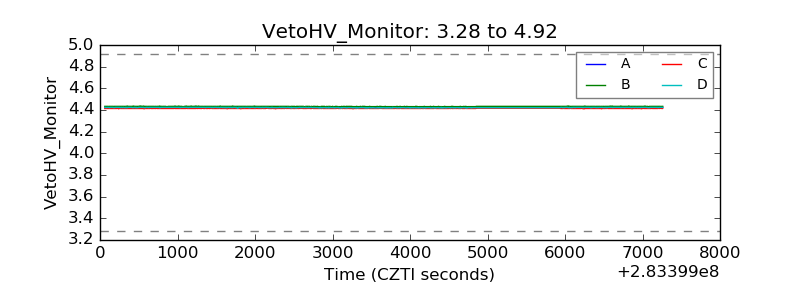 |
| Veto LLD | 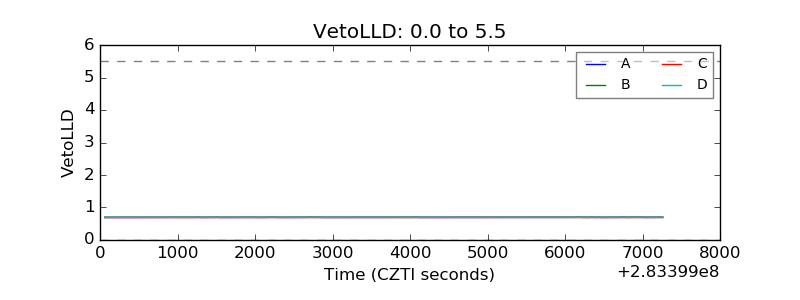 |
| Alpha Counter | 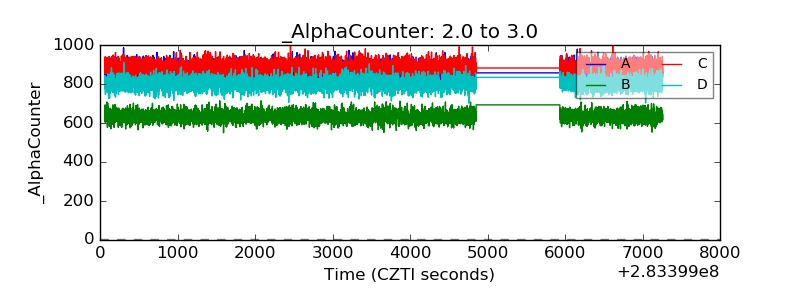 |
| _CPM_Rate | 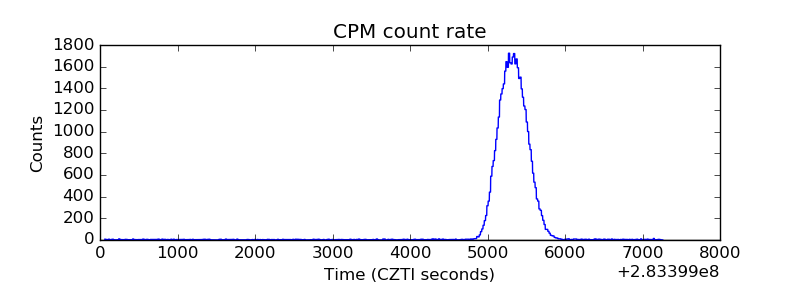 |
| CZT Counter | 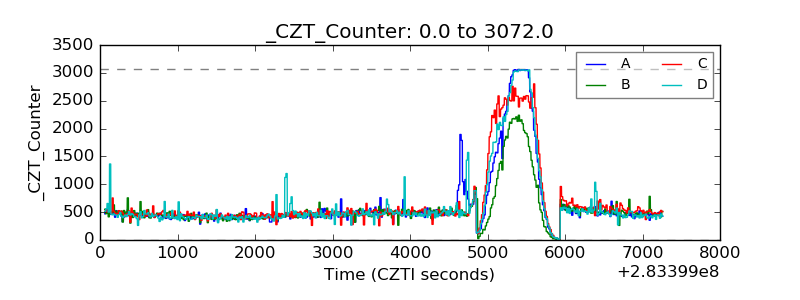 |
| +2.5 Volts monitor |  |
| +5 Volts monitor |  |
| _ROLL_ROT |  |
| _Roll_DEC |  |
| _Roll_RA | 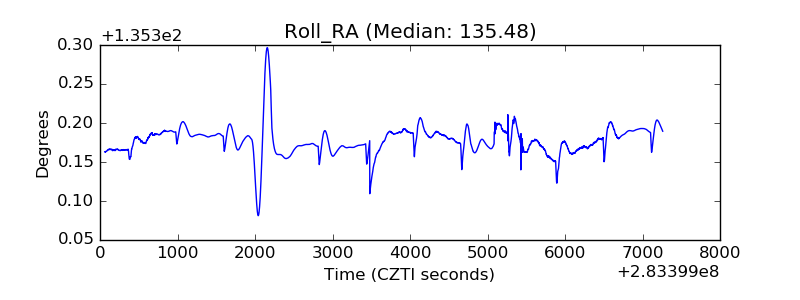 |
| Veto Counter | 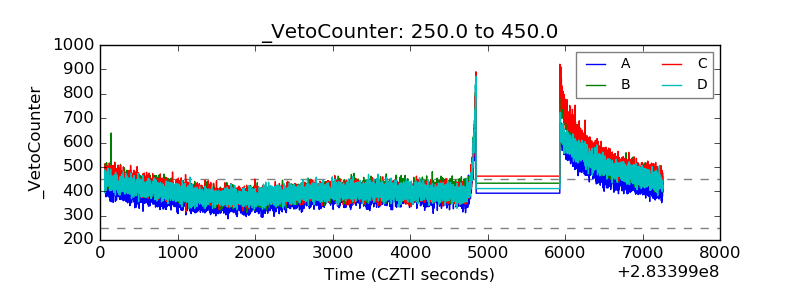 |