| Param | Original file | Final file |
|---|---|---|
| Filename | modeM0/AS1A05_140T01_9000002596_17526cztM0_level2.evt | modeM0/AS1A05_140T01_9000002596_17526cztM0_level2_quad_clean.evt |
| Size (bytes) | 414,538,560 | 84,876,480 |
| Size | 395.3 MB | 80.9 MB |
| Events in quadrant A | 2,863,223 | 546,880 |
| Events in quadrant B | 2,976,029 | 557,370 |
| Events in quadrant C | 3,097,401 | 536,418 |
| Events in quadrant D | 3,217,646 | 518,552 |
| Mode SS | |||
|---|---|---|---|
| Quadrant | BADHDUFLAG | Total packets | Discarded packets |
| A | 0 | 120 | 0 |
| B | 0 | 120 | 0 |
| C | 0 | 120 | 0 |
| D | 0 | 120 | 0 |
| Mode M0 | |||
|---|---|---|---|
| Quadrant | BADHDUFLAG | Total packets | Discarded packets |
| A | 0 | 12149 | 1 |
| B | 0 | 12445 | 1 |
| C | 0 | 12602 | 1 |
| D | 0 | 13264 | 1 |
| Mode M9 | |||
|---|---|---|---|
| Quadrant | BADHDUFLAG | Total packets | Discarded packets |
| A | 0 | 11 | 0 |
| B | 0 | 11 | 0 |
| C | 0 | 11 | 0 |
| D | 0 | 11 | 0 |
| Quadrant | Total seconds | Saturated seconds | Saturation percentage |
|---|---|---|---|
| A | 5881 | 41 | 0.697160% |
| B | 5882 | 56 | 0.952057% |
| C | 5882 | 76 | 1.292078% |
| D | 5882 | 112 | 1.904114% |
Noise dominated data is calculated using 1-second bins in cleaned event files. If a bin has >2000 counts, and if more than 50% of those come from <1% of pixels, then it is considered to be noise-dominated and hence unusable.
| Quadrant | # 1 sec bins | Bins with >0 counts | Bins with >2000 counts | High rate bins dominated by noise | Noise dominated (total time) | Noise dominated (detector-on time) | Marked lightcurve |
|---|---|---|---|---|---|---|---|
| A | 7041 | 5882 | 0 | 0 | 0.00% | 0.00% | 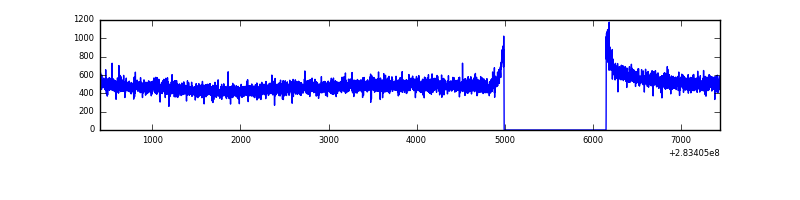 |
| B | 7042 | 5883 | 4 | 4 | 0.06% | 0.07% | 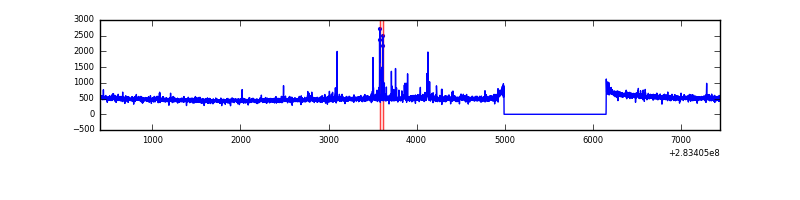 |
| C | 7042 | 5883 | 0 | 0 | 0.00% | 0.00% | 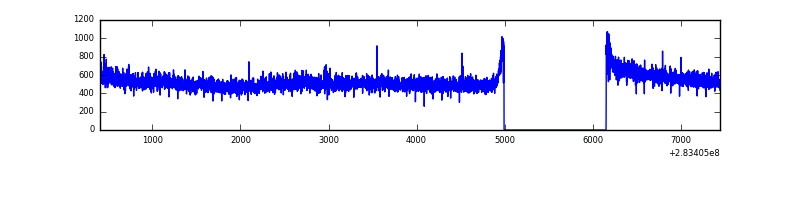 |
| D | 7042 | 5883 | 68 | 68 | 0.97% | 1.16% | 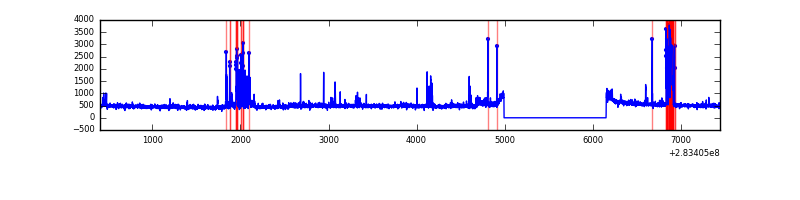 |
Top three noisy pixels from each quadrant. If the there are fewer than three noisy pixels in the level2.evt file, extra rows are filled as -1
| Pixel properties | Quadrant properties | ||||||
|---|---|---|---|---|---|---|---|
| Quadrant | DetID | PixID | Counts | Sigma | Mean | Median | Sigma |
| A | 0 | 226 | 6601 | 39.16 | 744 | 729 | 150.0 |
| A | 12 | 194 | 5441 | 31.42 | 744 | 729 | 150.0 |
| A | 3 | 137 | 5309 | 30.54 | 744 | 729 | 150.0 |
| B | 0 | 244 | 38597 | 267.44 | 742 | 723 | 141.6 |
| B | 10 | 245 | 33157 | 229.03 | 742 | 723 | 141.6 |
| B | 12 | 111 | 16614 | 112.21 | 742 | 723 | 141.6 |
| C | 14 | 238 | 112586 | 657.2 | 729 | 735 | 170.2 |
| C | 3 | 233 | 111950 | 653.46 | 729 | 735 | 170.2 |
| C | 5 | 218 | 29069 | 166.48 | 729 | 735 | 170.2 |
| D | 2 | 120 | 163330 | 916.77 | 729 | 709 | 177.4 |
| D | 5 | 222 | 161633 | 907.2 | 729 | 709 | 177.4 |
| D | 10 | 70 | 98318 | 550.27 | 729 | 709 | 177.4 |
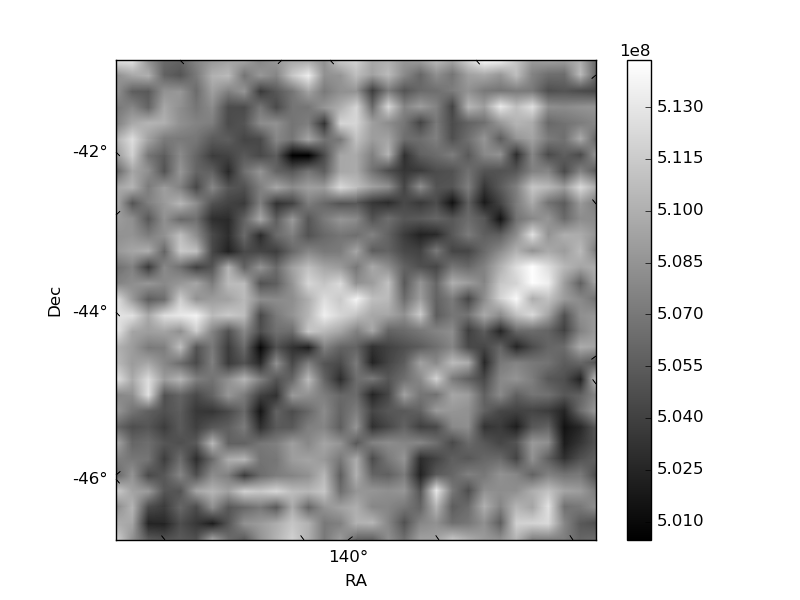
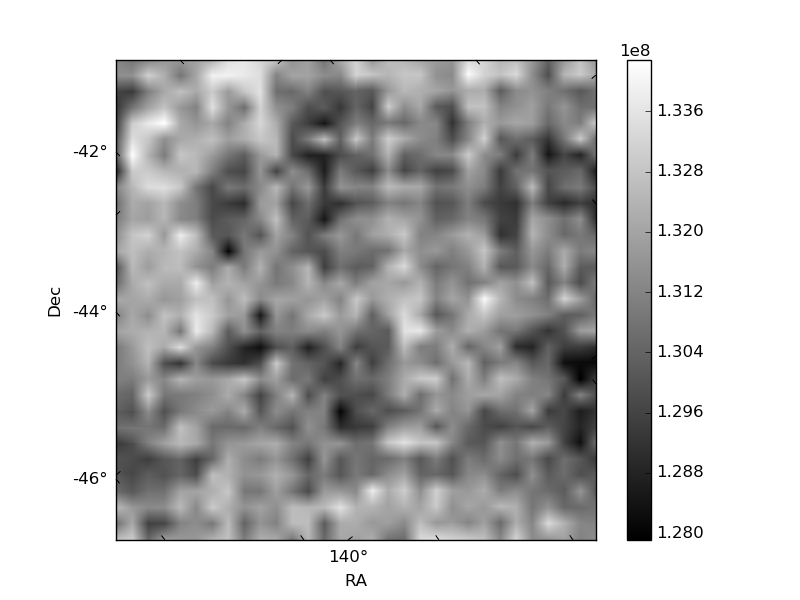
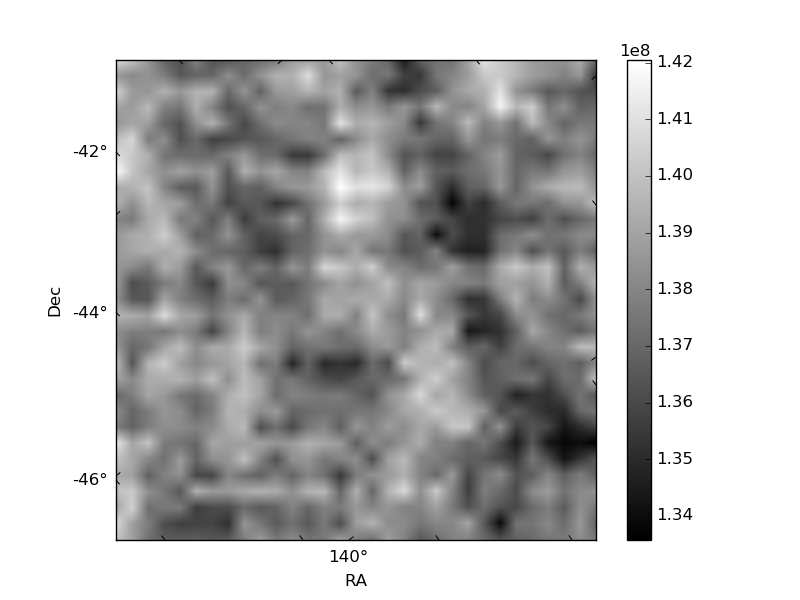
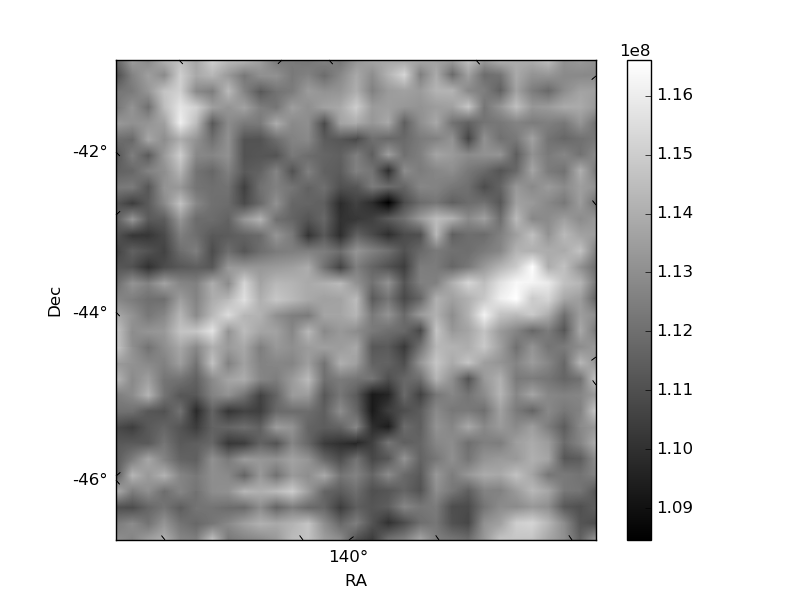
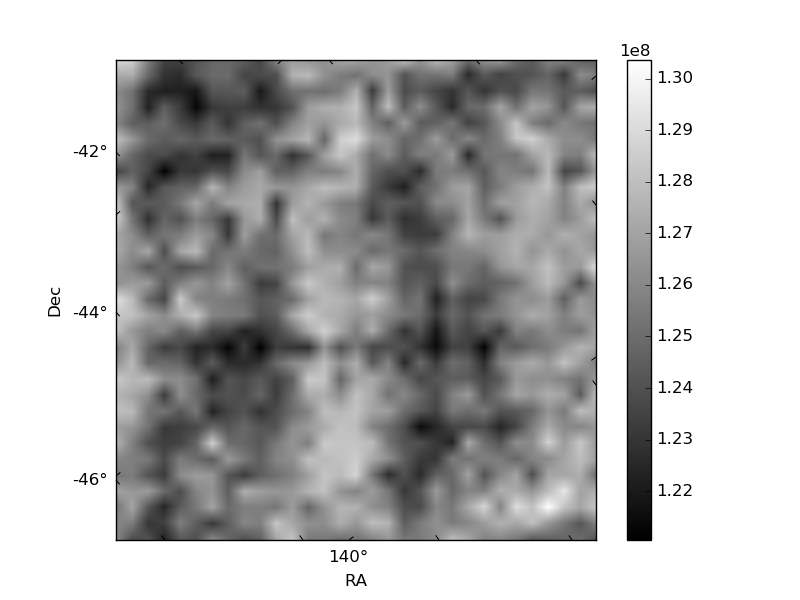
Histogram calculated using DETX and DETY for each event in the final _common_clean file
| Quadrant A | 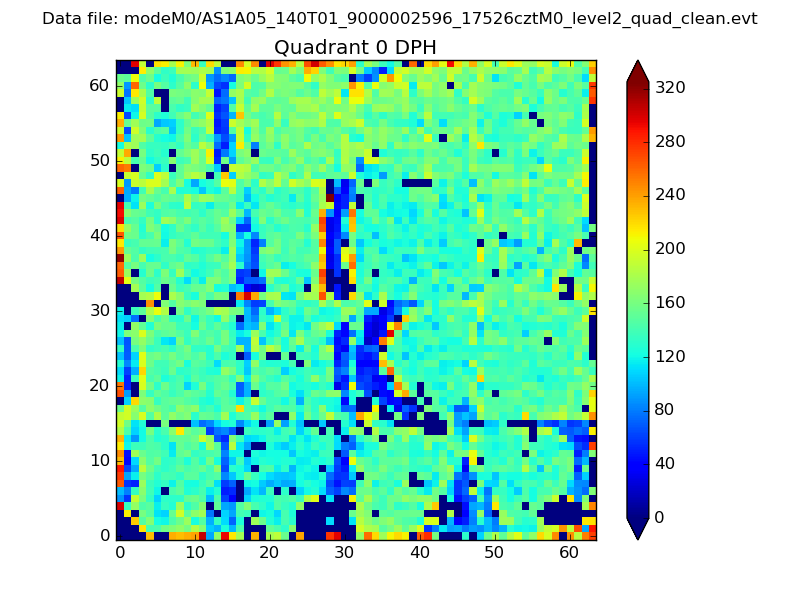 |
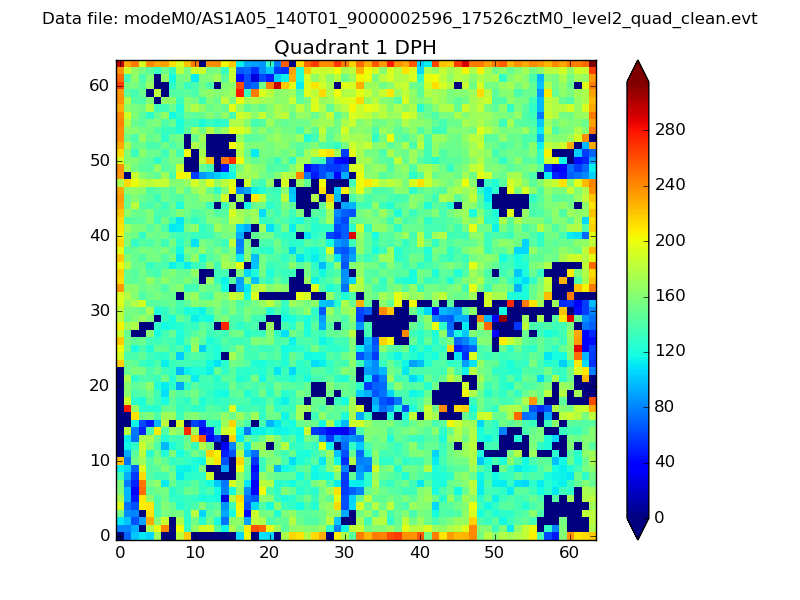 |
Quadrant B |
|---|---|---|---|
| Quadrant D | 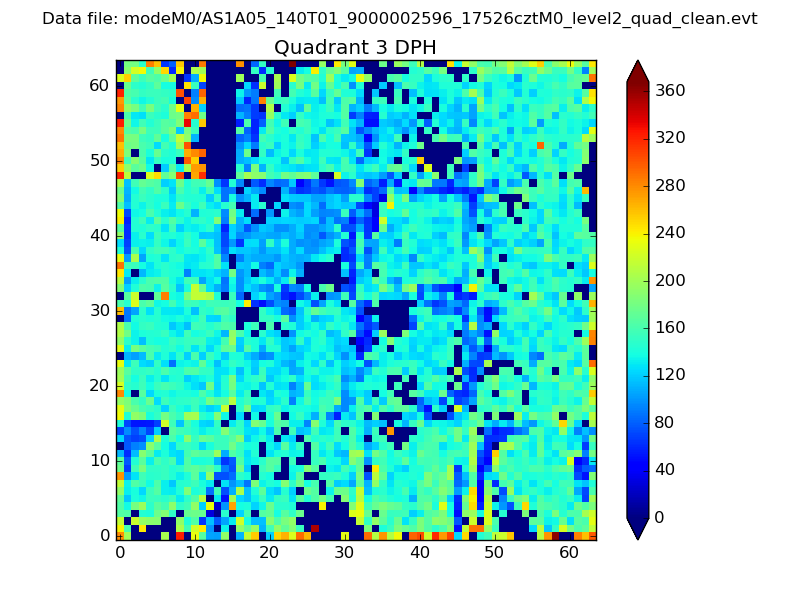 |
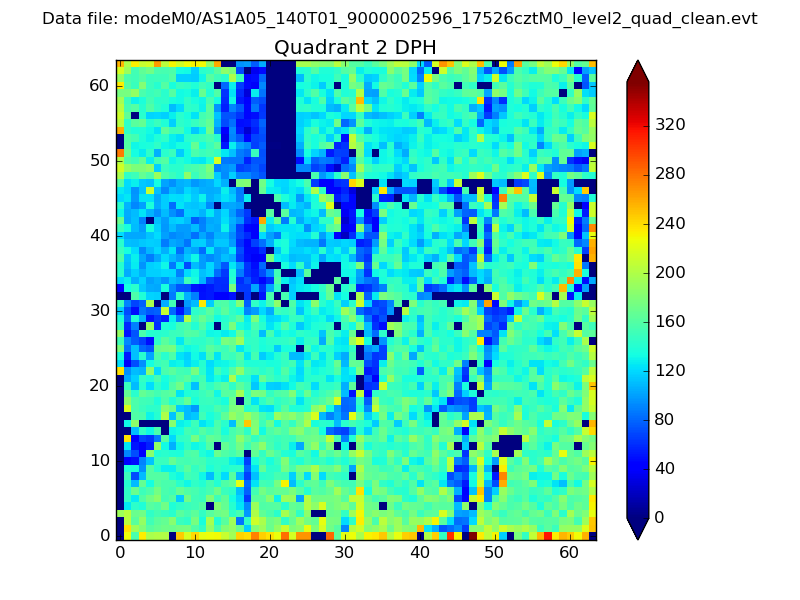 |
Quadrant C |
| Plot type | Count rate plots | Images |
|---|---|---|
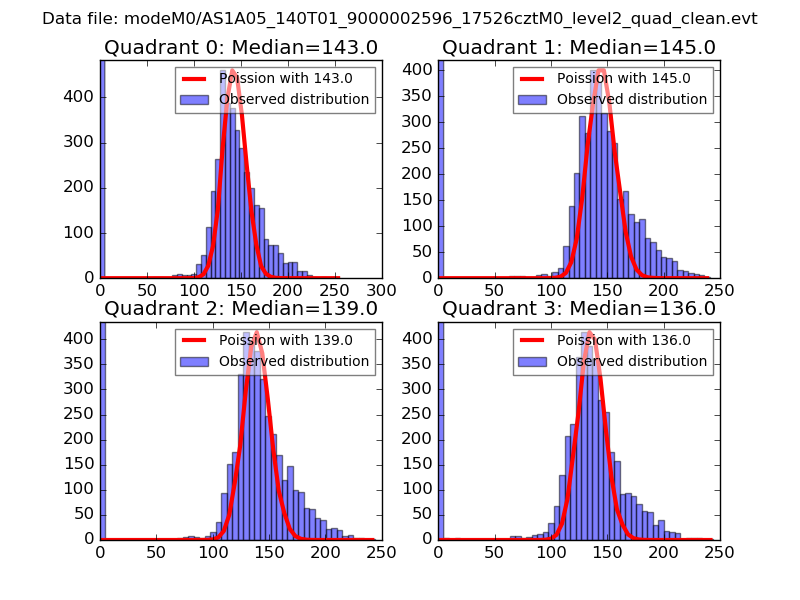
| Comparison with Poisson distribution Blue bars denote a histogram of data divided into 1 sec bins. Red curve is a Poisson curve with rate = median count rate of data. |
 |
 |
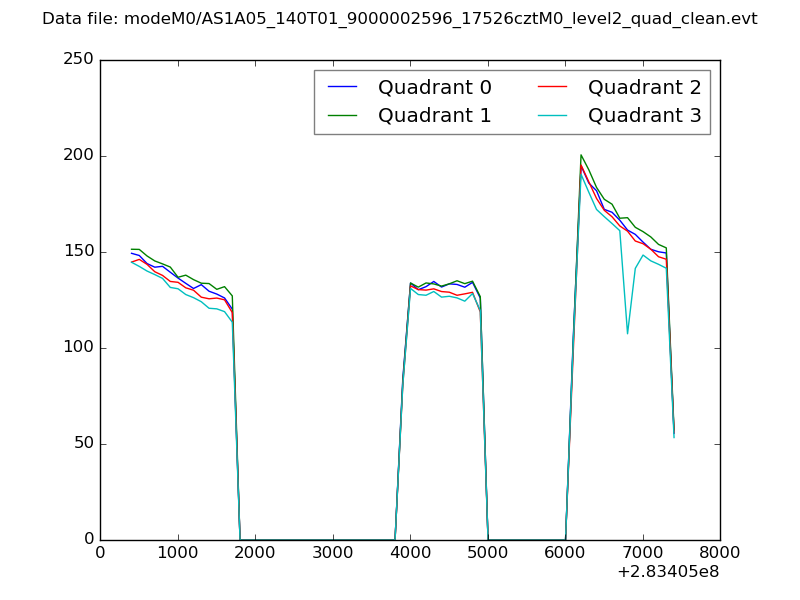
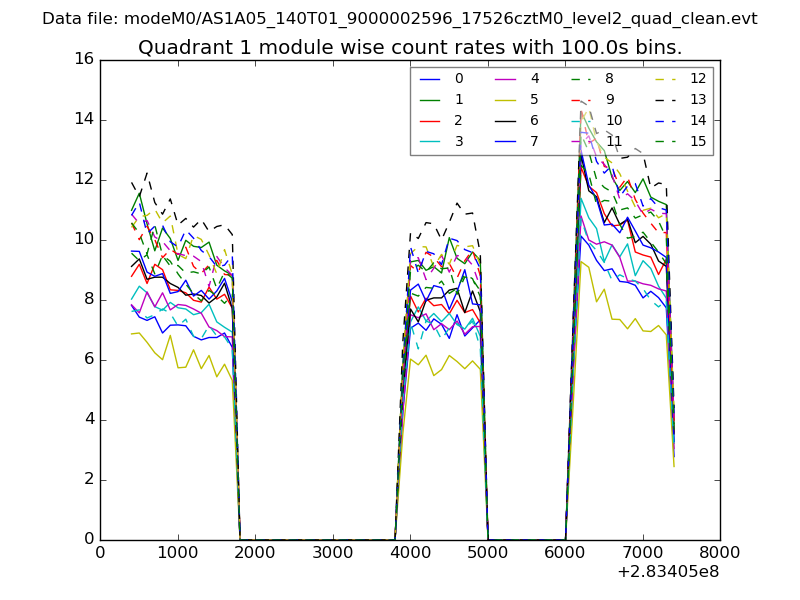
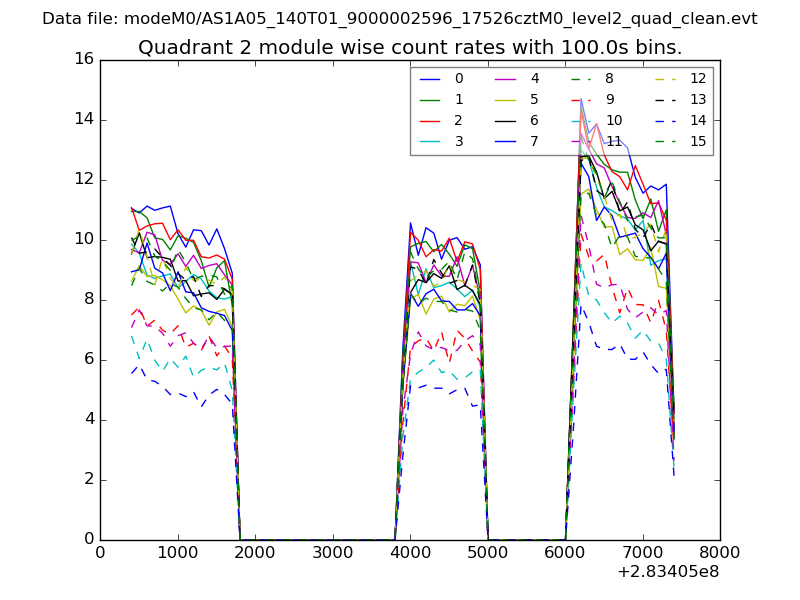
| Quadrant-wise count rates Data is divided into 100 sec bins |
 |
|
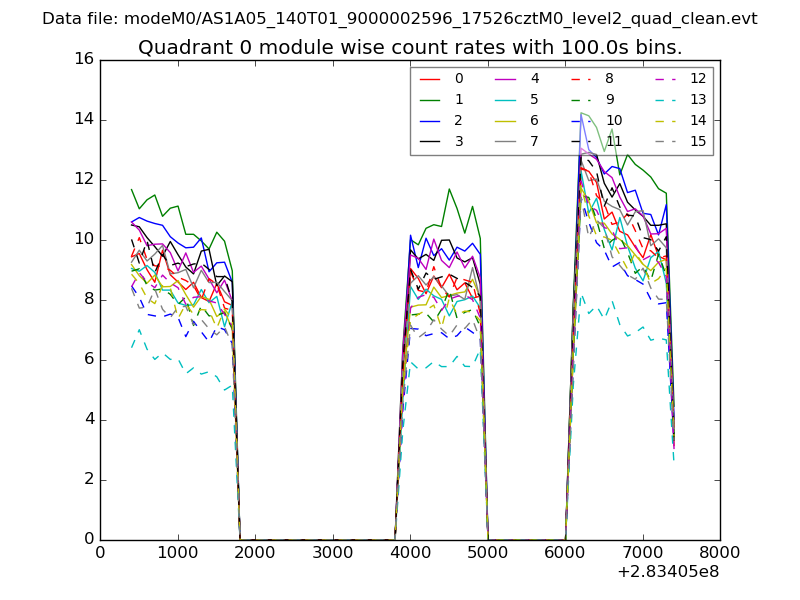
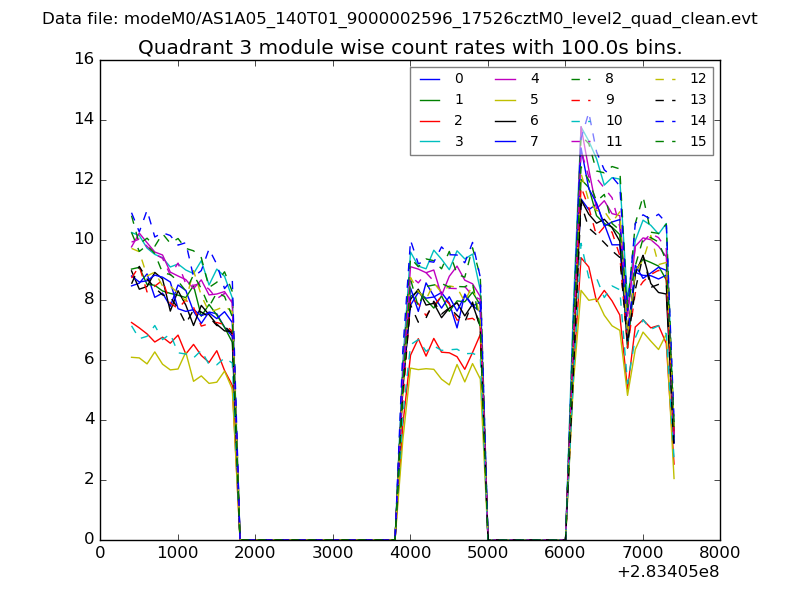
| Module-wise count rates for Quadrant A Data is divided into 100 sec bins |
 |
 |
| Module-wise count rates for Quadrant B Data is divided into 100 sec bins |
 |
 |
| Module-wise count rates for Quadrant C Data is divided into 100 sec bins |
 |
 |
| Module-wise count rates for Quadrant D Data is divided into 100 sec bins |
 |
 |
| Parameter | Plot |
|---|---|
| CZT HV Monitor | 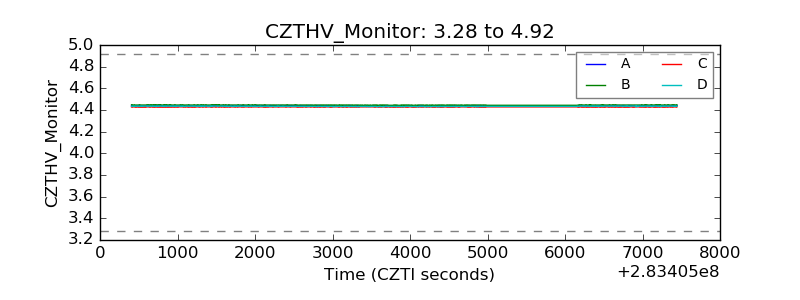 |
| D_VDD |  |
| Temperature 1 | 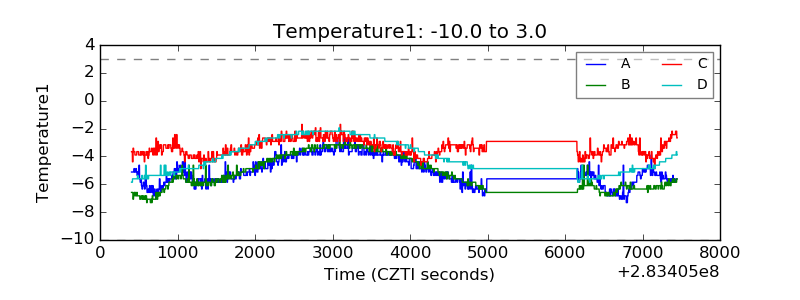 |
| Veto HV Monitor | 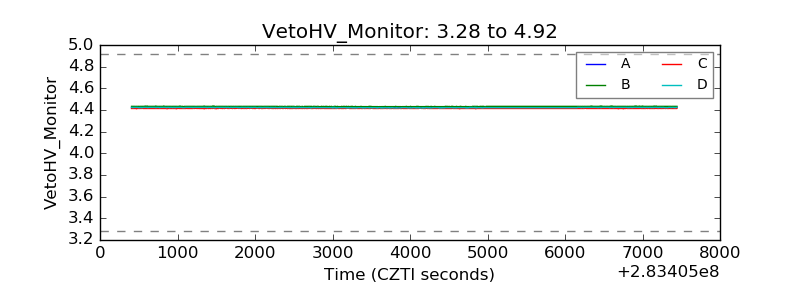 |
| Veto LLD | 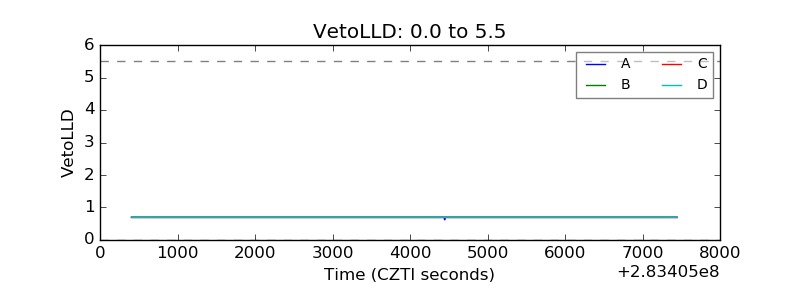 |
| Alpha Counter | 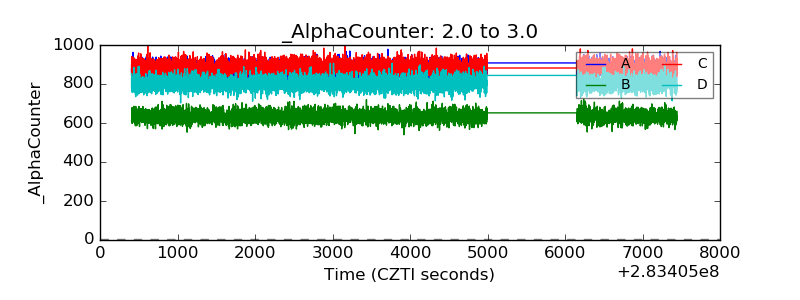 |
| _CPM_Rate | 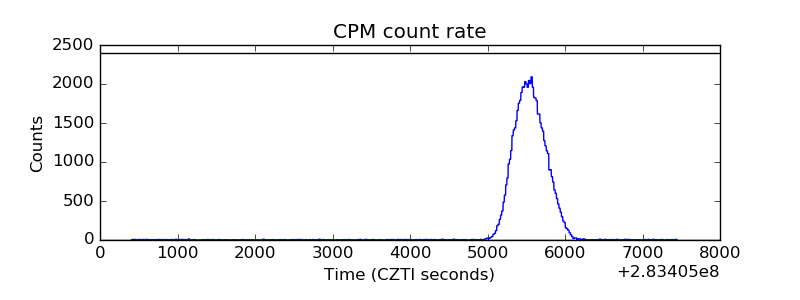 |
| CZT Counter | 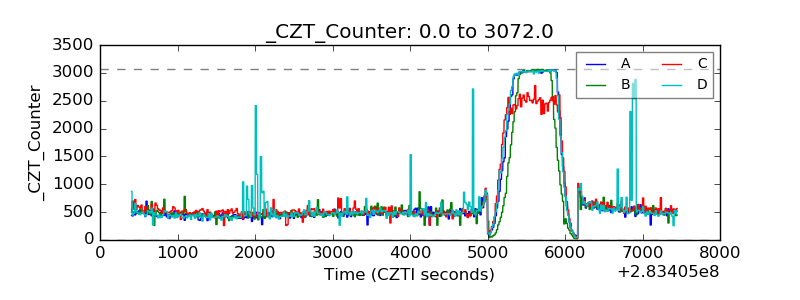 |
| +2.5 Volts monitor | 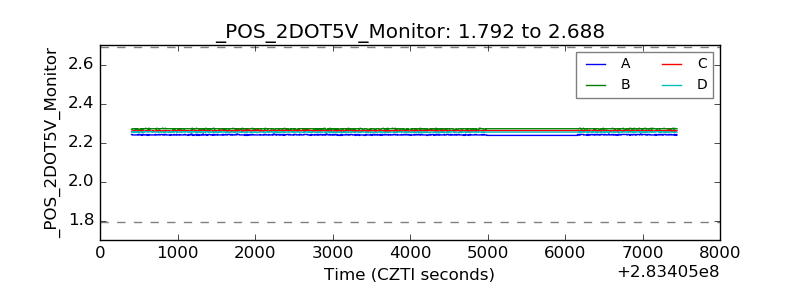 |
| +5 Volts monitor |  |
| _ROLL_ROT | 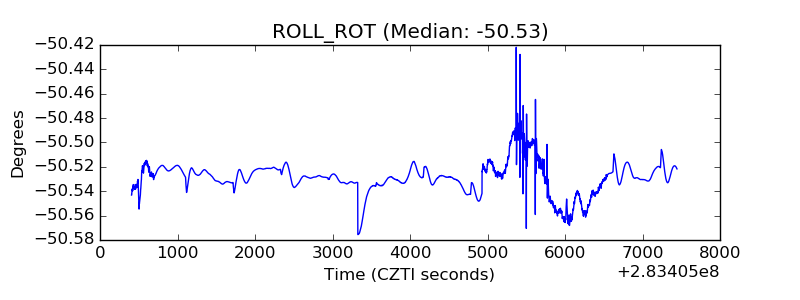 |
| _Roll_DEC | 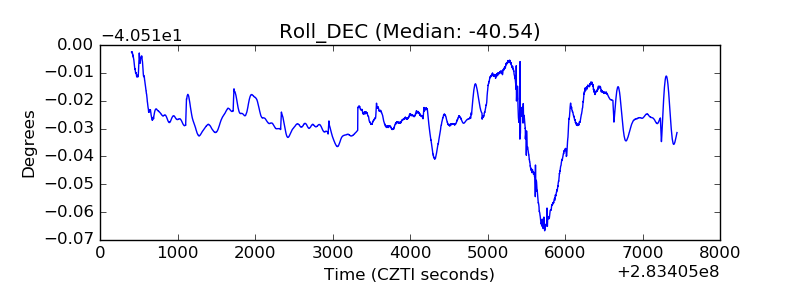 |
| _Roll_RA | 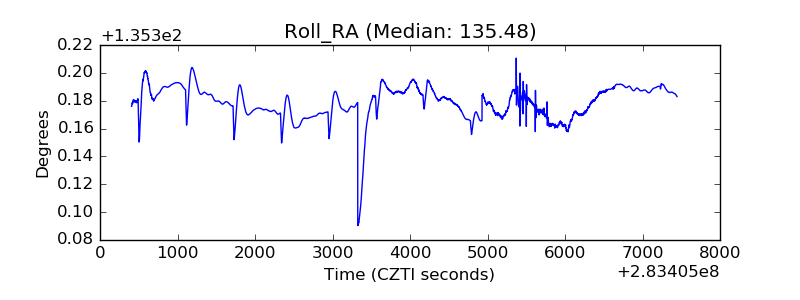 |
| Veto Counter | 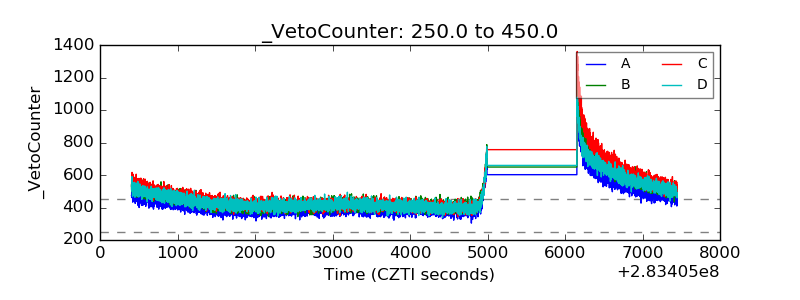 |