| Param | Original file | Final file |
|---|---|---|
| Filename | modeM0/AS1A05_140T01_9000002596_17528cztM0_level2.evt | modeM0/AS1A05_140T01_9000002596_17528cztM0_level2_quad_clean.evt |
| Size (bytes) | 484,096,320 | 86,880,960 |
| Size | 461.7 MB | 82.9 MB |
| Events in quadrant A | 3,311,692 | 558,549 |
| Events in quadrant B | 3,350,693 | 568,368 |
| Events in quadrant C | 3,520,846 | 544,711 |
| Events in quadrant D | 4,054,317 | 523,751 |
| Mode SS | |||
|---|---|---|---|
| Quadrant | BADHDUFLAG | Total packets | Discarded packets |
| A | 0 | 126 | 0 |
| B | 0 | 126 | 0 |
| C | 0 | 126 | 0 |
| D | 0 | 126 | 0 |
| Mode M0 | |||
|---|---|---|---|
| Quadrant | BADHDUFLAG | Total packets | Discarded packets |
| A | 0 | 13548 | 1 |
| B | 0 | 13621 | 1 |
| C | 0 | 14321 | 1 |
| D | 0 | 15925 | 1 |
| Mode M9 | |||
|---|---|---|---|
| Quadrant | BADHDUFLAG | Total packets | Discarded packets |
| A | 0 | 14 | 0 |
| B | 0 | 14 | 0 |
| C | 0 | 14 | 0 |
| D | 0 | 14 | 0 |
| Quadrant | Total seconds | Saturated seconds | Saturation percentage |
|---|---|---|---|
| A | 6242 | 82 | 1.313682% |
| B | 6243 | 88 | 1.409579% |
| C | 6243 | 114 | 1.826045% |
| D | 6243 | 197 | 3.155534% |
Noise dominated data is calculated using 1-second bins in cleaned event files. If a bin has >2000 counts, and if more than 50% of those come from <1% of pixels, then it is considered to be noise-dominated and hence unusable.
| Quadrant | # 1 sec bins | Bins with >0 counts | Bins with >2000 counts | High rate bins dominated by noise | Noise dominated (total time) | Noise dominated (detector-on time) | Marked lightcurve |
|---|---|---|---|---|---|---|---|
| A | 7547 | 6243 | 0 | 0 | 0.00% | 0.00% | 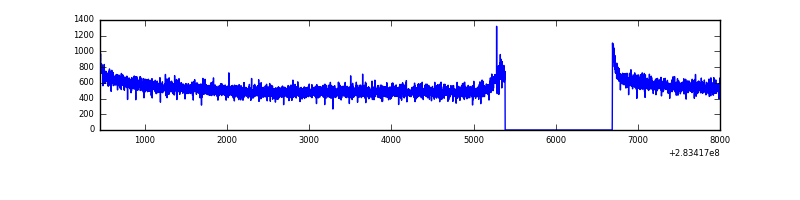 |
| B | 7548 | 6243 | 1 | 1 | 0.01% | 0.02% | 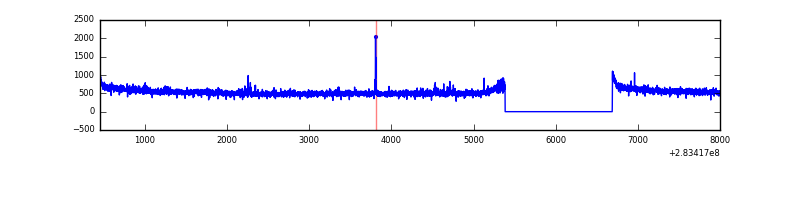 |
| C | 7548 | 6243 | 0 | 0 | 0.00% | 0.00% | 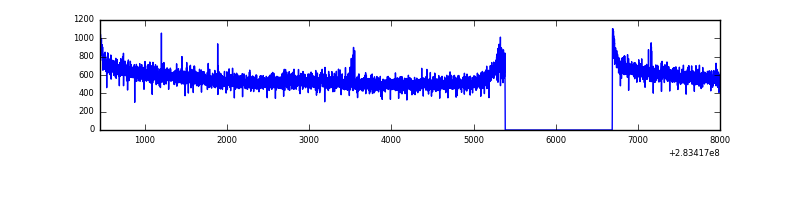 |
| D | 7548 | 6243 | 104 | 104 | 1.38% | 1.67% | 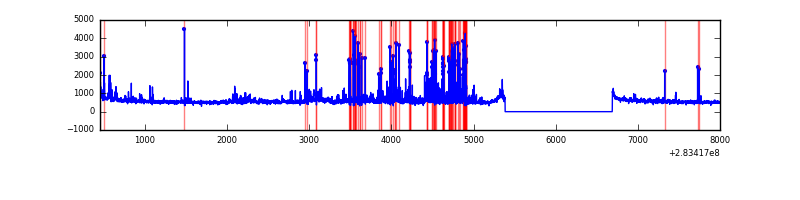 |
Top three noisy pixels from each quadrant. If the there are fewer than three noisy pixels in the level2.evt file, extra rows are filled as -1
| Pixel properties | Quadrant properties | ||||||
|---|---|---|---|---|---|---|---|
| Quadrant | DetID | PixID | Counts | Sigma | Mean | Median | Sigma |
| A | 0 | 226 | 7743 | 40.81 | 861 | 847 | 169.0 |
| A | 12 | 194 | 6272 | 32.1 | 861 | 847 | 169.0 |
| A | 3 | 137 | 5811 | 29.37 | 861 | 847 | 169.0 |
| B | 12 | 111 | 17995 | 108.26 | 852 | 832 | 158.5 |
| B | 11 | 111 | 15842 | 94.68 | 852 | 832 | 158.5 |
| B | 0 | 230 | 14175 | 84.16 | 852 | 832 | 158.5 |
| C | 14 | 238 | 130974 | 679.74 | 836 | 842 | 191.4 |
| C | 3 | 233 | 106212 | 550.4 | 836 | 842 | 191.4 |
| C | 5 | 218 | 25340 | 127.96 | 836 | 842 | 191.4 |
| D | 5 | 222 | 693954 | 3463.01 | 837 | 816 | 200.2 |
| D | 13 | 189 | 102224 | 506.65 | 837 | 816 | 200.2 |
| D | 7 | 38 | 78354 | 387.39 | 837 | 816 | 200.2 |
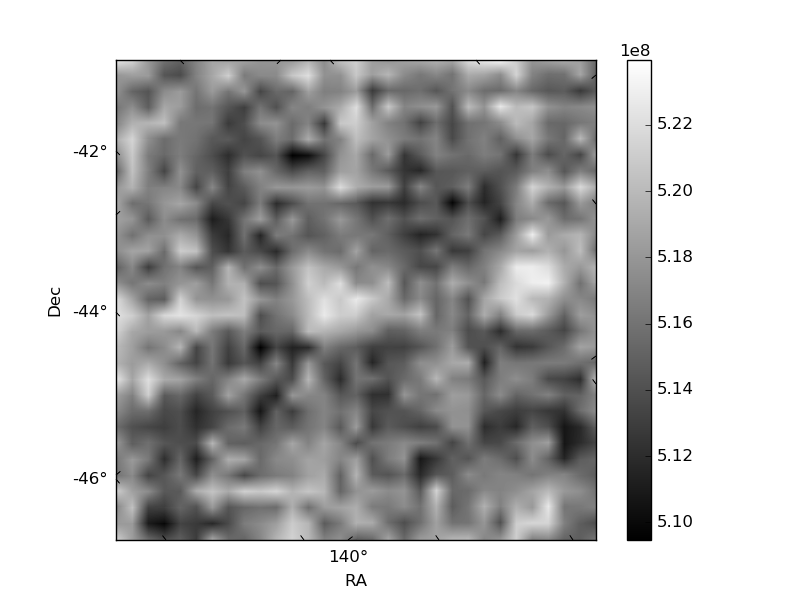
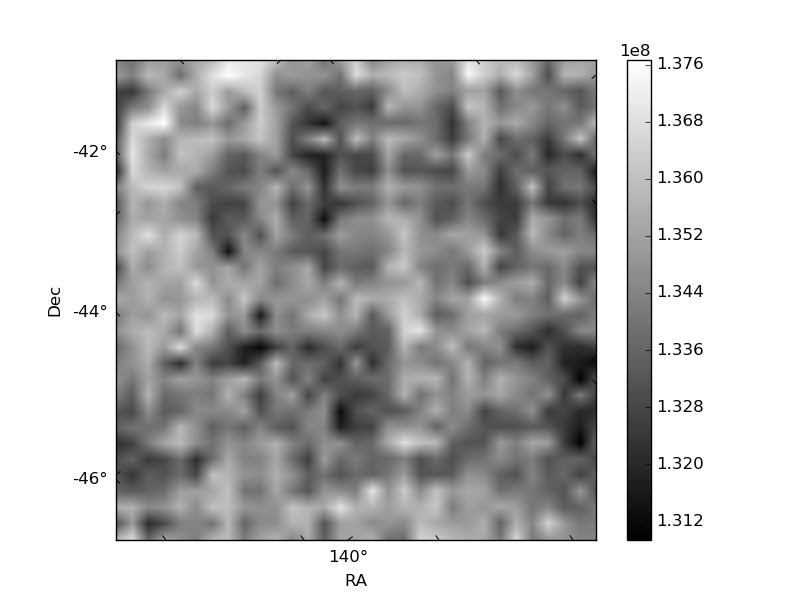
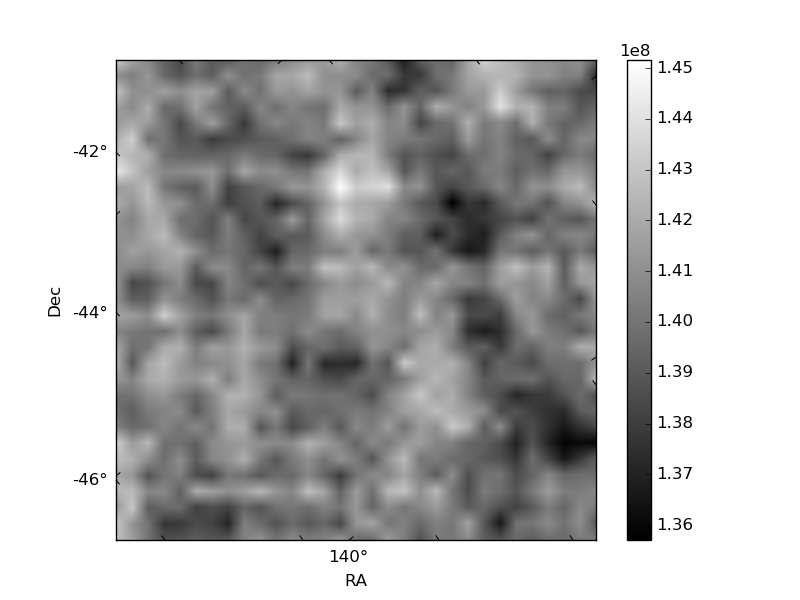
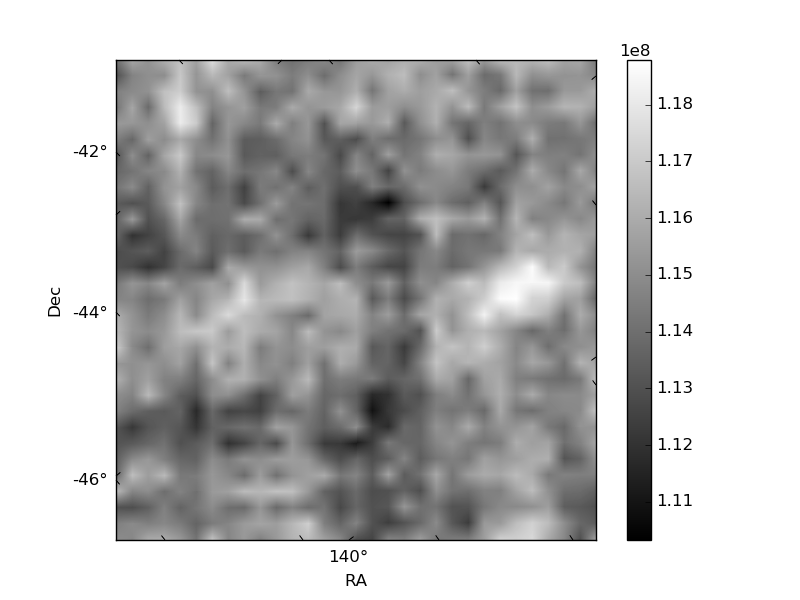
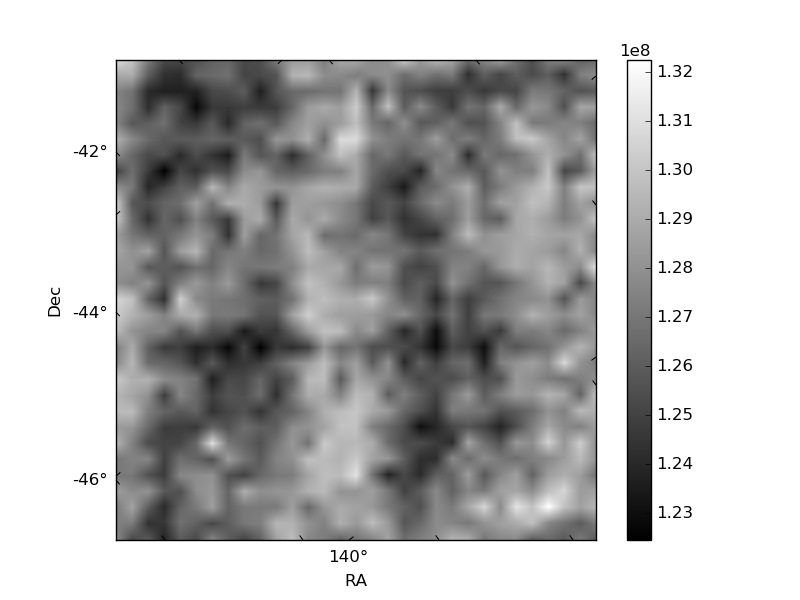
Histogram calculated using DETX and DETY for each event in the final _common_clean file
| Quadrant A | 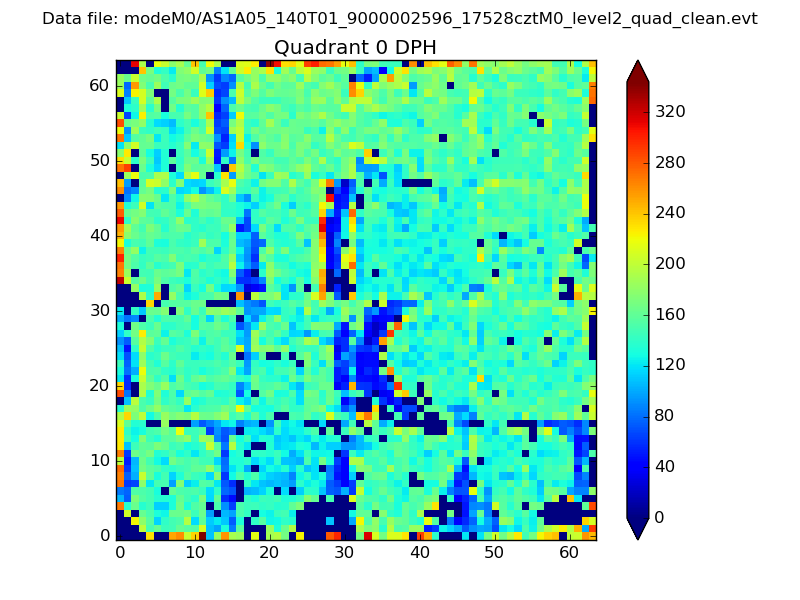 |
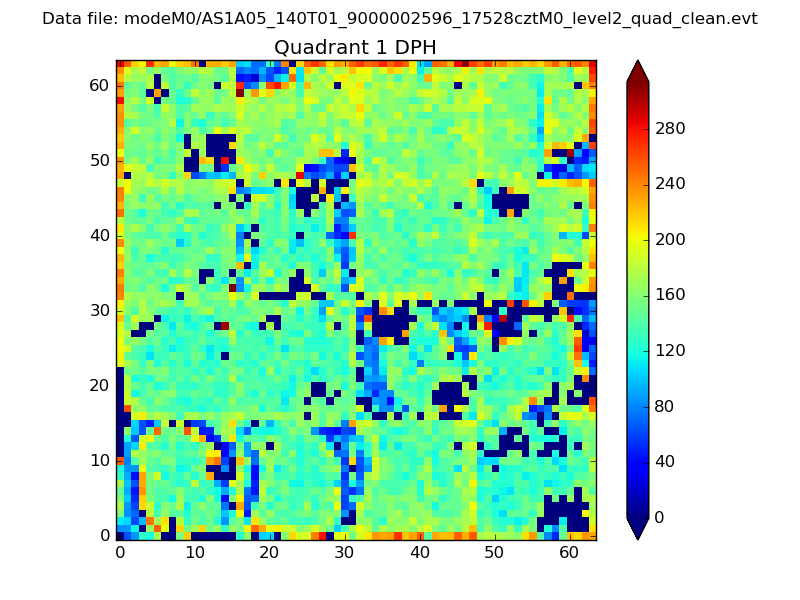 |
Quadrant B |
|---|---|---|---|
| Quadrant D |  |
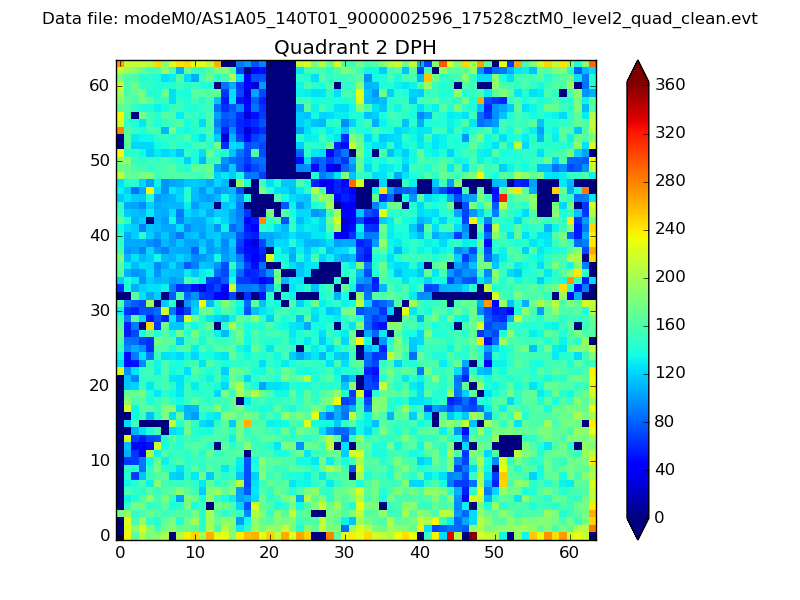 |
Quadrant C |
| Plot type | Count rate plots | Images |
|---|---|---|
| Comparison with Poisson distribution Blue bars denote a histogram of data divided into 1 sec bins. Red curve is a Poisson curve with rate = median count rate of data. |
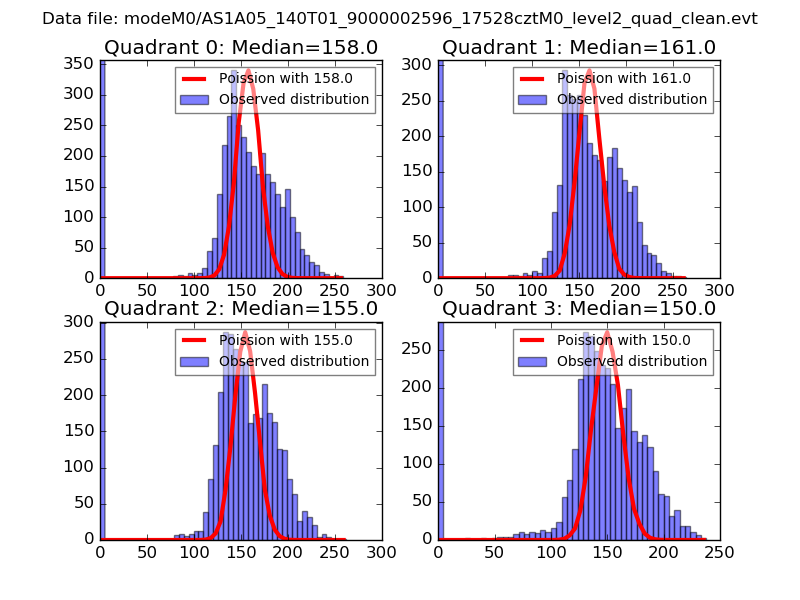 |
 |
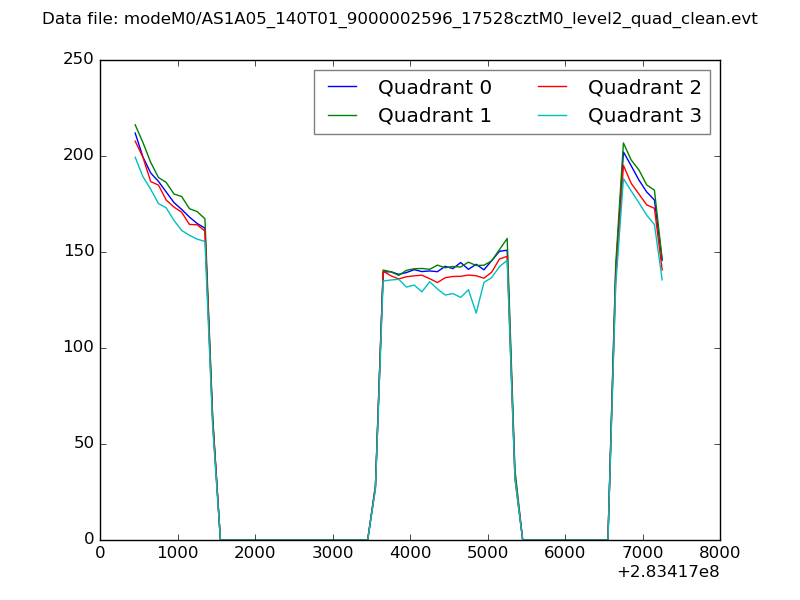
| Quadrant-wise count rates Data is divided into 100 sec bins |
 |
|
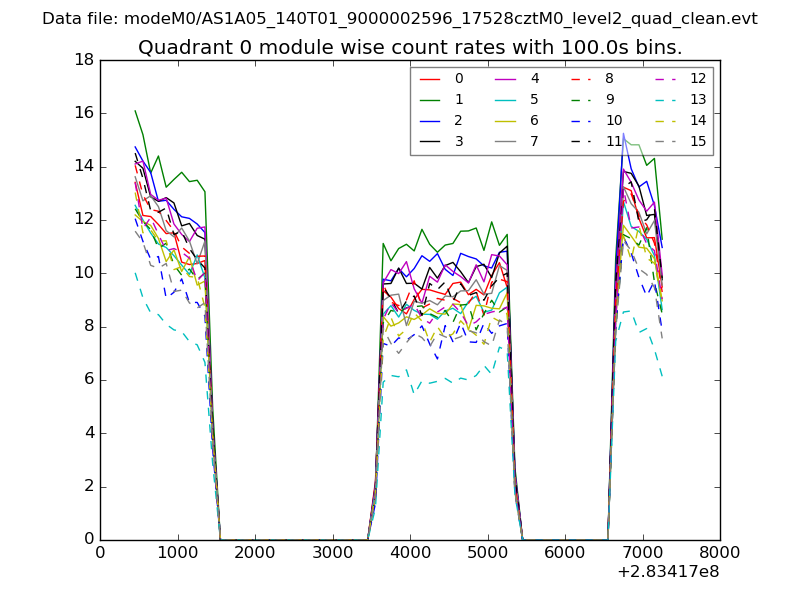
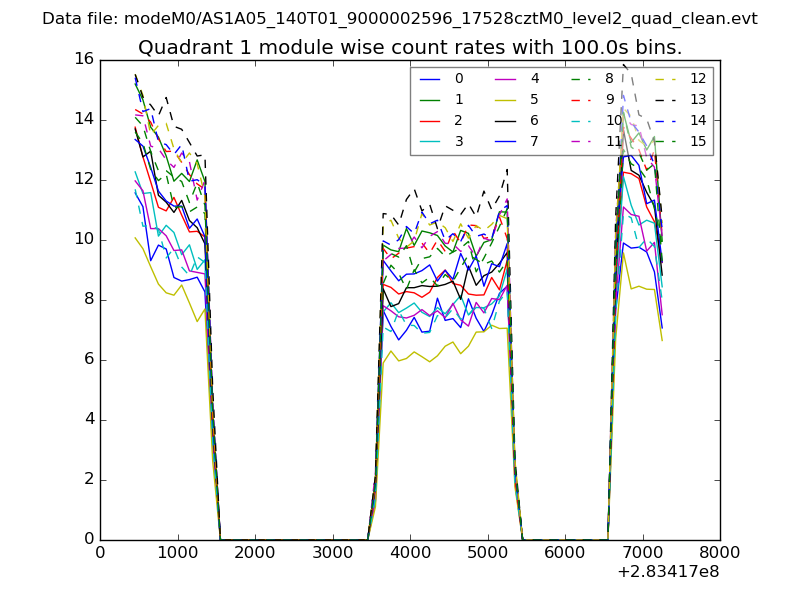
| Module-wise count rates for Quadrant A Data is divided into 100 sec bins |
 |
 |
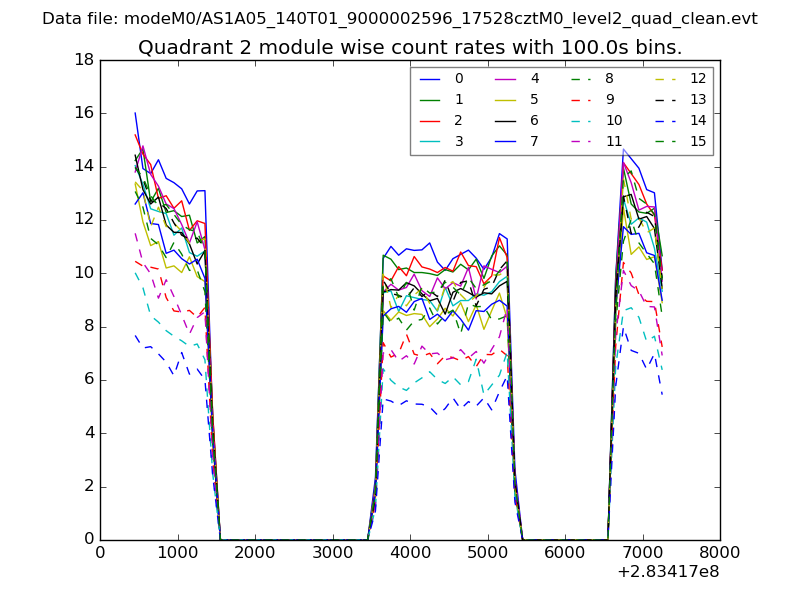
| Module-wise count rates for Quadrant B Data is divided into 100 sec bins |
 |
 |
| Module-wise count rates for Quadrant C Data is divided into 100 sec bins |
 |
 |
| Module-wise count rates for Quadrant D Data is divided into 100 sec bins |
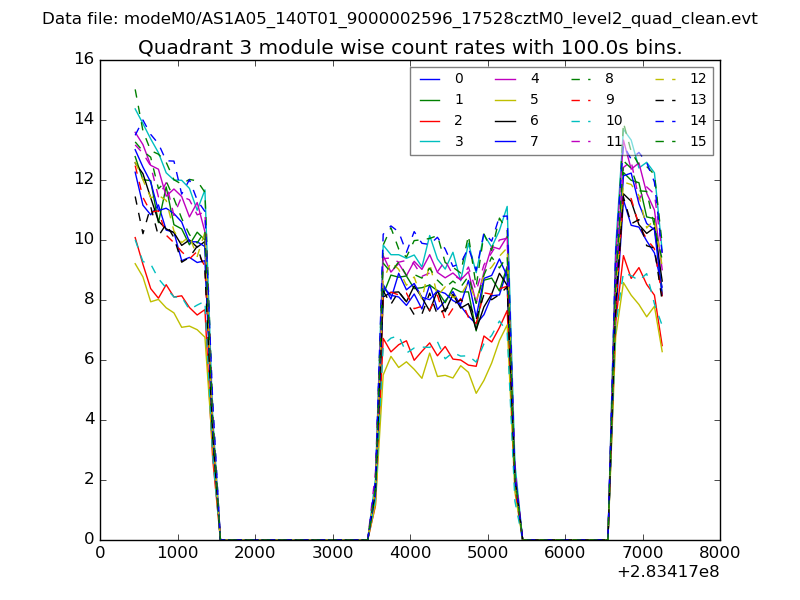 |
 |
| Parameter | Plot |
|---|---|
| CZT HV Monitor |  |
| D_VDD | 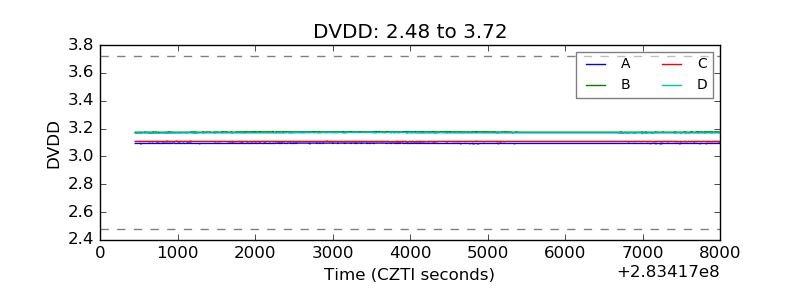 |
| Temperature 1 | 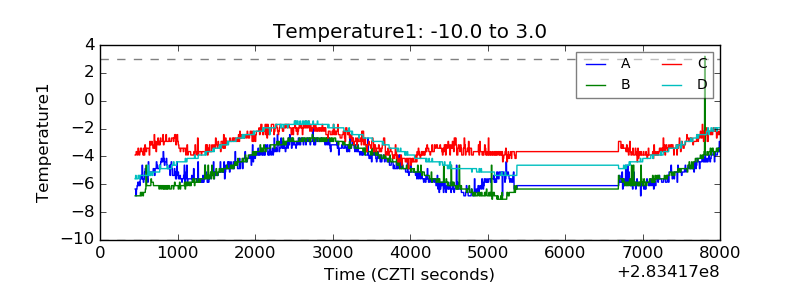 |
| Veto HV Monitor | 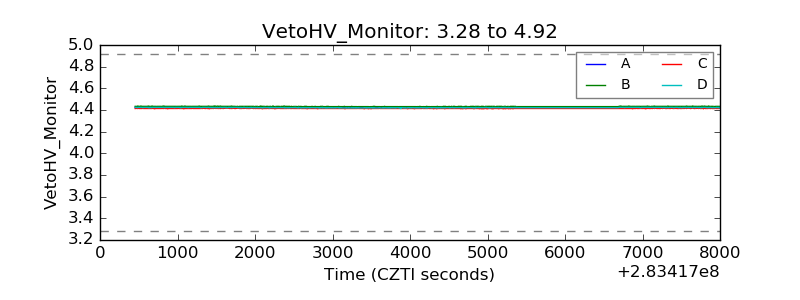 |
| Veto LLD | 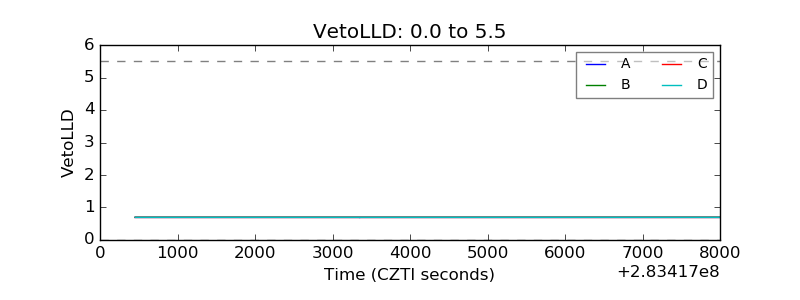 |
| Alpha Counter | 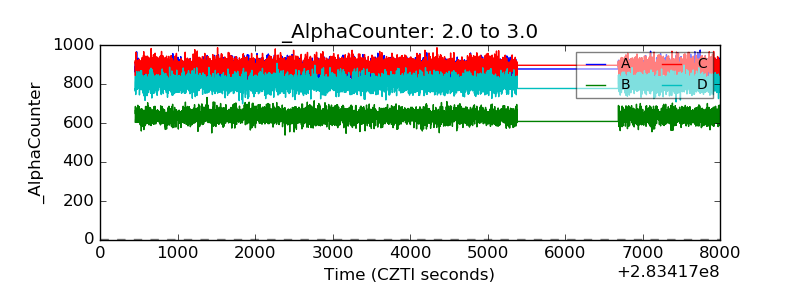 |
| _CPM_Rate | 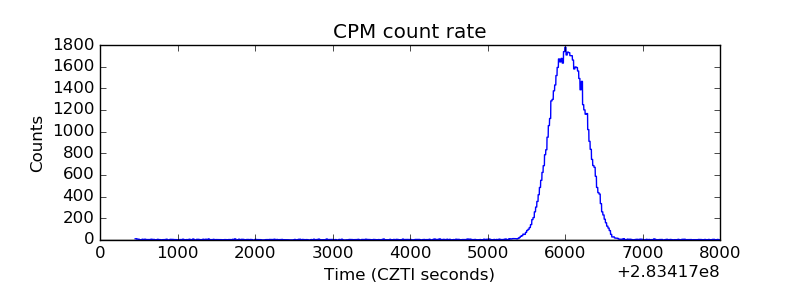 |
| CZT Counter | 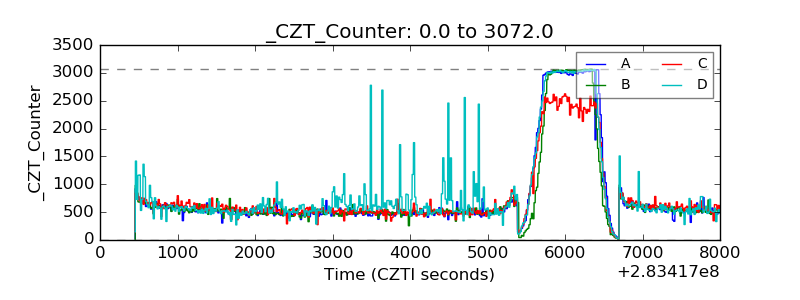 |
| +2.5 Volts monitor |  |
| +5 Volts monitor | 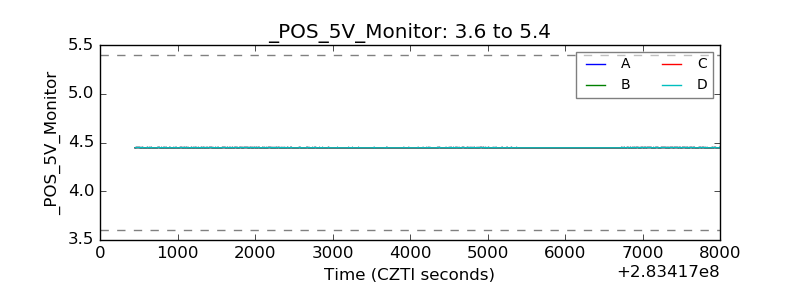 |
| _ROLL_ROT | 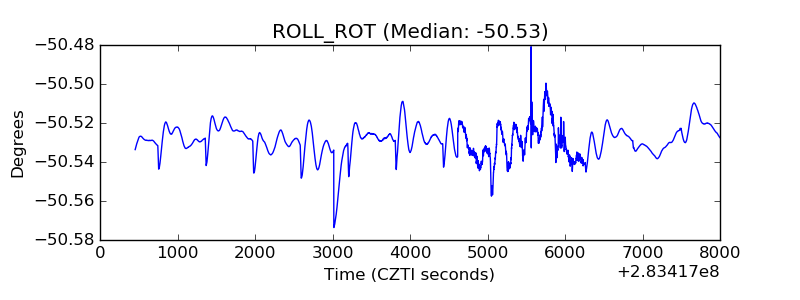 |
| _Roll_DEC | 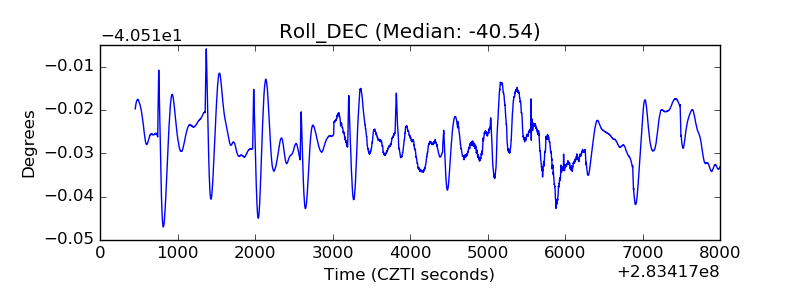 |
| _Roll_RA | 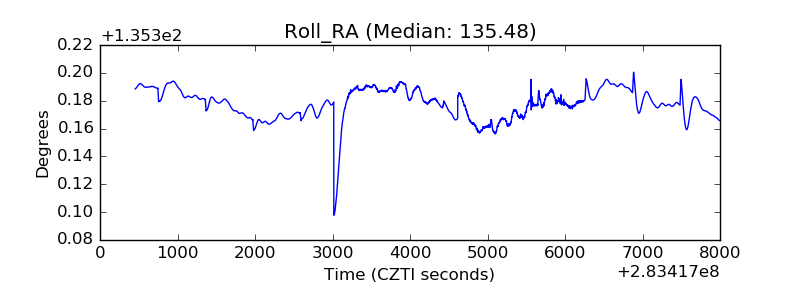 |
| Veto Counter | 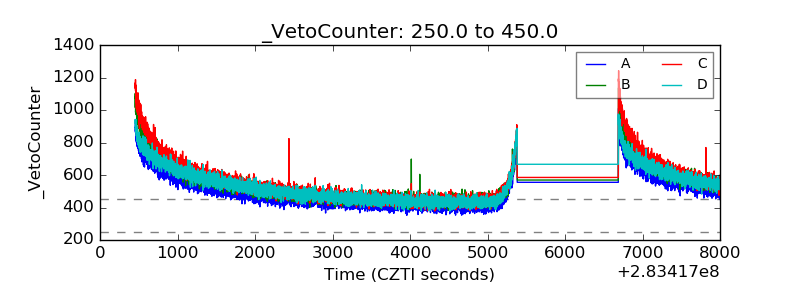 |