| Param | Original file | Final file |
|---|---|---|
| Filename | modeM0/AS1A05_140T01_9000002596_17530cztM0_level2.evt | modeM0/AS1A05_140T01_9000002596_17530cztM0_level2_quad_clean.evt |
| Size (bytes) | 469,535,040 | 68,218,560 |
| Size | 447.8 MB | 65.1 MB |
| Events in quadrant A | 3,196,219 | 417,233 |
| Events in quadrant B | 3,307,956 | 419,889 |
| Events in quadrant C | 3,797,505 | 399,814 |
| Events in quadrant D | 3,494,579 | 393,250 |
| Mode SS | |||
|---|---|---|---|
| Quadrant | BADHDUFLAG | Total packets | Discarded packets |
| A | 0 | 126 | 0 |
| B | 0 | 126 | 0 |
| C | 0 | 126 | 0 |
| D | 0 | 126 | 0 |
| Mode M0 | |||
|---|---|---|---|
| Quadrant | BADHDUFLAG | Total packets | Discarded packets |
| A | 0 | 13227 | 2 |
| B | 0 | 13613 | 2 |
| C | 0 | 15462 | 2 |
| D | 0 | 14112 | 2 |
| Mode M9 | |||
|---|---|---|---|
| Quadrant | BADHDUFLAG | Total packets | Discarded packets |
| A | 0 | 19 | 0 |
| B | 0 | 20 | 0 |
| C | 0 | 20 | 0 |
| D | 0 | 20 | 0 |
| Quadrant | Total seconds | Saturated seconds | Saturation percentage |
|---|---|---|---|
| A | 6232 | 125 | 2.005777% |
| B | 6232 | 133 | 2.134146% |
| C | 6232 | 179 | 2.872272% |
| D | 6232 | 99 | 1.588575% |
Noise dominated data is calculated using 1-second bins in cleaned event files. If a bin has >2000 counts, and if more than 50% of those come from <1% of pixels, then it is considered to be noise-dominated and hence unusable.
| Quadrant | # 1 sec bins | Bins with >0 counts | Bins with >2000 counts | High rate bins dominated by noise | Noise dominated (total time) | Noise dominated (detector-on time) | Marked lightcurve |
|---|---|---|---|---|---|---|---|
| A | 7422 | 6232 | 0 | 0 | 0.00% | 0.00% | 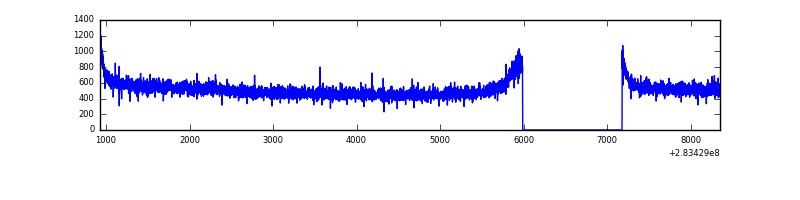 |
| B | 7422 | 6232 | 1 | 1 | 0.01% | 0.02% | 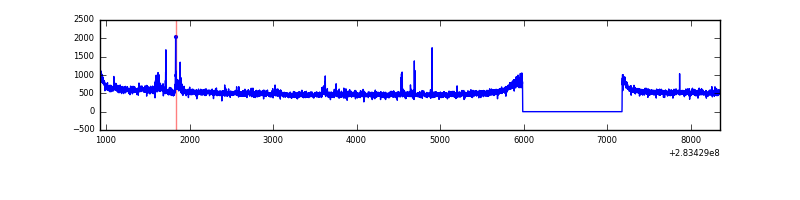 |
| C | 7422 | 6232 | 0 | 0 | 0.00% | 0.00% | 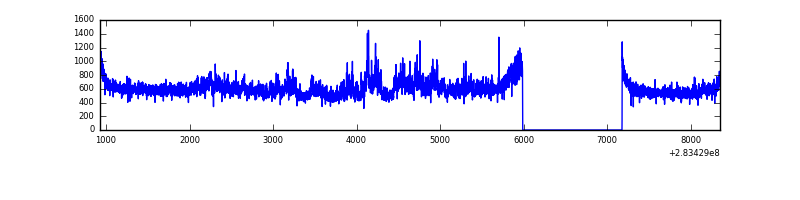 |
| D | 7422 | 6232 | 13 | 13 | 0.18% | 0.21% | 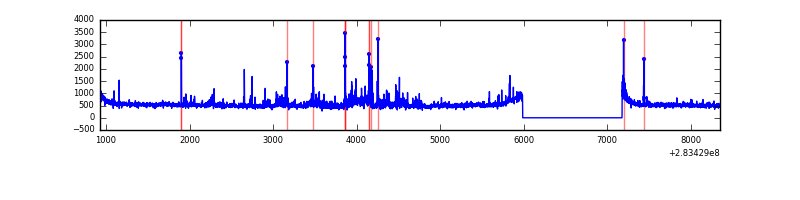 |
Top three noisy pixels from each quadrant. If the there are fewer than three noisy pixels in the level2.evt file, extra rows are filled as -1
| Pixel properties | Quadrant properties | ||||||
|---|---|---|---|---|---|---|---|
| Quadrant | DetID | PixID | Counts | Sigma | Mean | Median | Sigma |
| A | 0 | 226 | 7272 | 39.17 | 831 | 814 | 164.9 |
| A | 12 | 194 | 6041 | 31.7 | 831 | 814 | 164.9 |
| A | 3 | 137 | 5699 | 29.63 | 831 | 814 | 164.9 |
| B | 10 | 245 | 72228 | 463.52 | 822 | 803 | 154.1 |
| B | 12 | 111 | 18300 | 113.55 | 822 | 803 | 154.1 |
| B | 11 | 111 | 15981 | 98.5 | 822 | 803 | 154.1 |
| C | 3 | 233 | 540047 | 2936.79 | 793 | 798 | 183.6 |
| C | 14 | 238 | 123731 | 669.5 | 793 | 798 | 183.6 |
| C | 5 | 218 | 38946 | 207.76 | 793 | 798 | 183.6 |
| D | 5 | 222 | 288848 | 1469.52 | 809 | 786 | 196.0 |
| D | 13 | 189 | 73809 | 372.52 | 809 | 786 | 196.0 |
| D | 7 | 223 | 30621 | 152.2 | 809 | 786 | 196.0 |
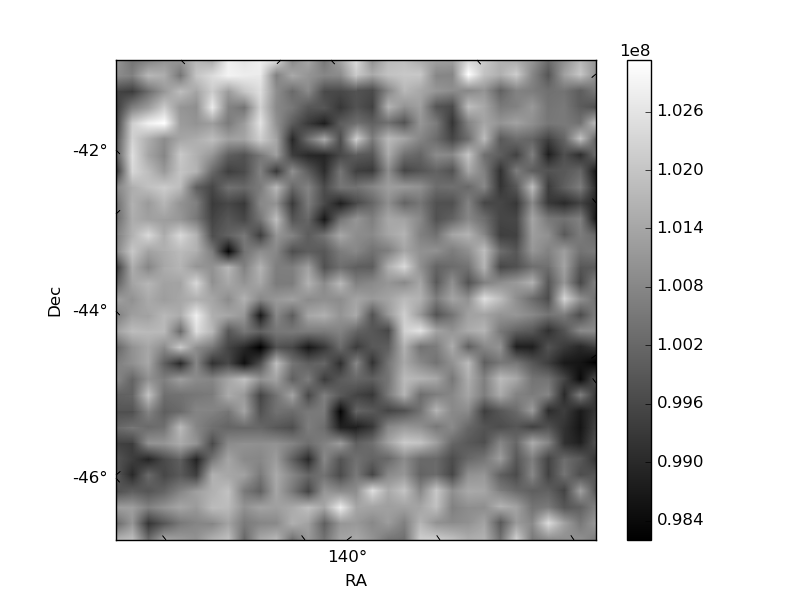
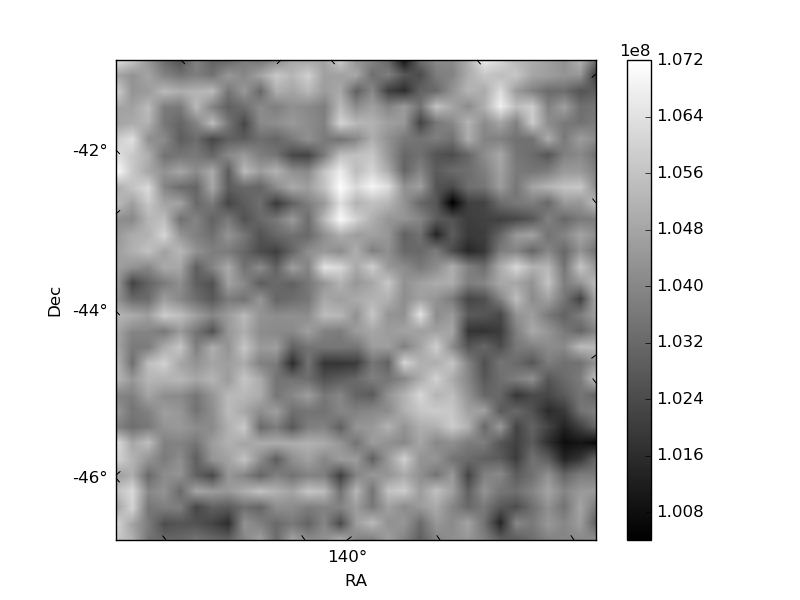
Histogram calculated using DETX and DETY for each event in the final _common_clean file
| Quadrant A |  |
 |
Quadrant B |
|---|---|---|---|
| Quadrant D |  |
 |
Quadrant C |
| Plot type | Count rate plots | Images |
|---|---|---|
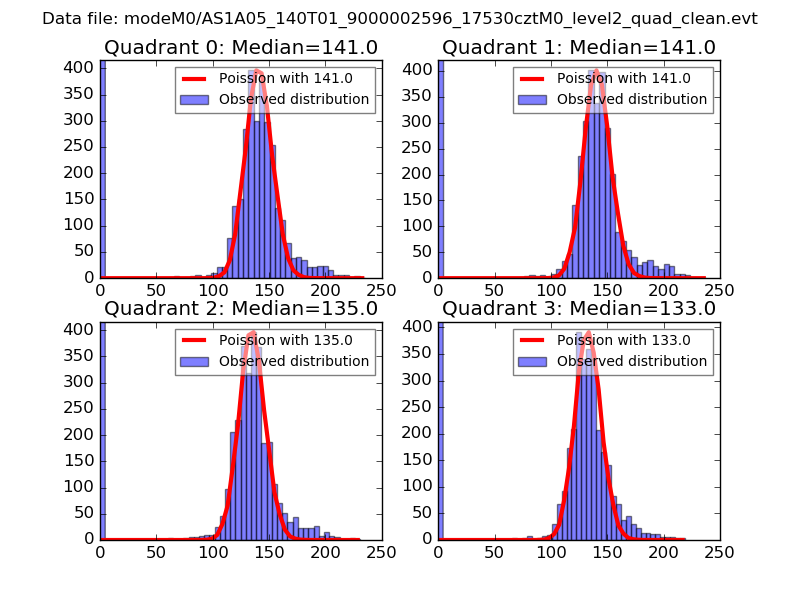
| Comparison with Poisson distribution Blue bars denote a histogram of data divided into 1 sec bins. Red curve is a Poisson curve with rate = median count rate of data. |
 |
 |
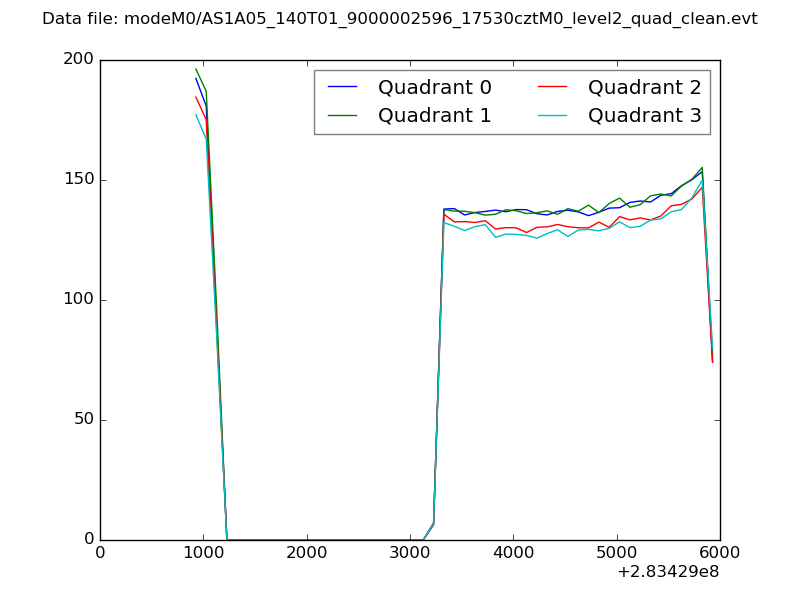
| Quadrant-wise count rates Data is divided into 100 sec bins |
 |
|
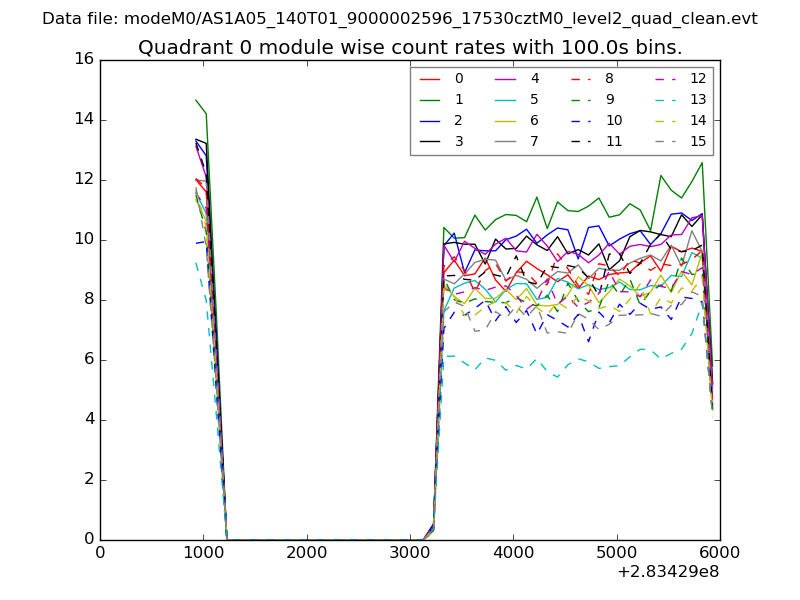
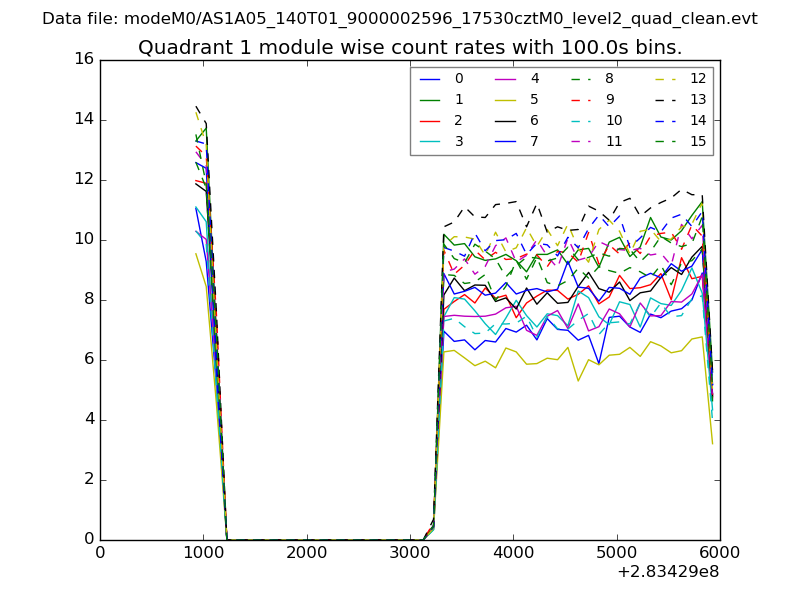
| Module-wise count rates for Quadrant A Data is divided into 100 sec bins |
 |
 |
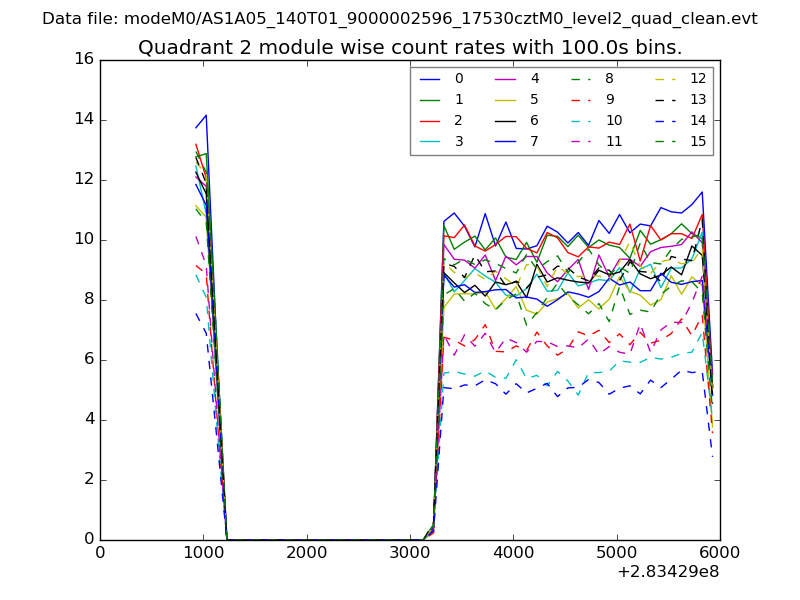
| Module-wise count rates for Quadrant B Data is divided into 100 sec bins |
 |
 |
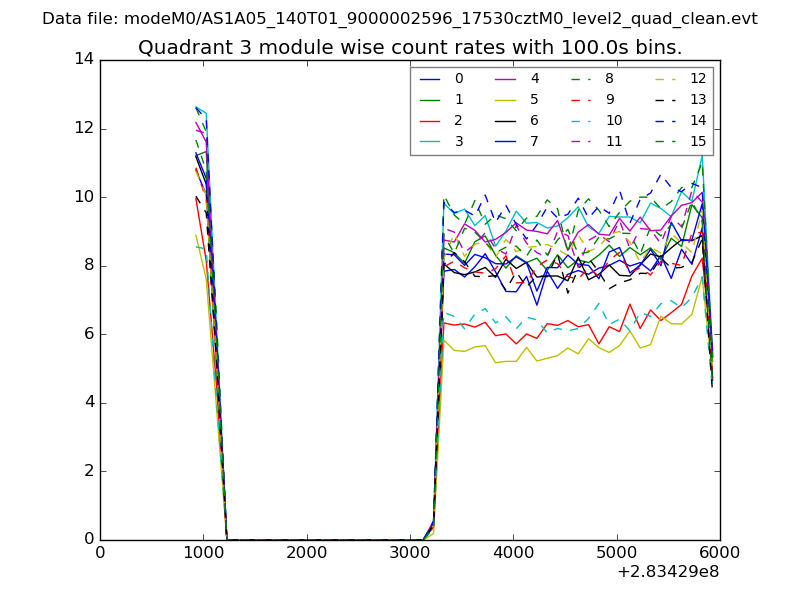
| Module-wise count rates for Quadrant C Data is divided into 100 sec bins |
 |
 |
| Module-wise count rates for Quadrant D Data is divided into 100 sec bins |
 |
 |
| Parameter | Plot |
|---|---|
| CZT HV Monitor |  |
| D_VDD | 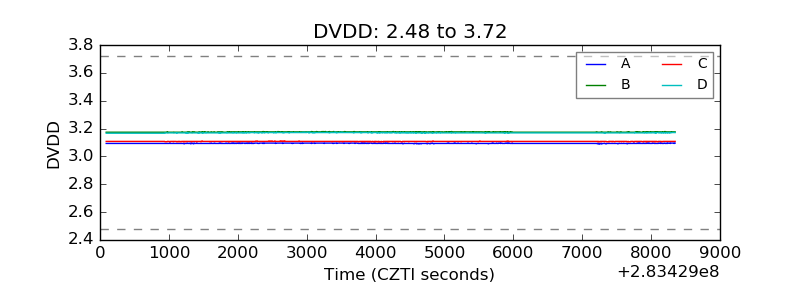 |
| Temperature 1 | 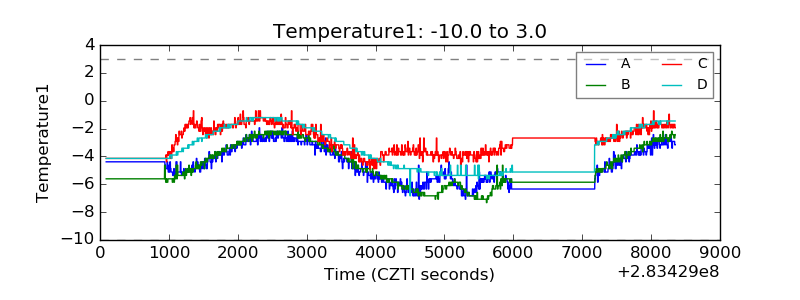 |
| Veto HV Monitor | 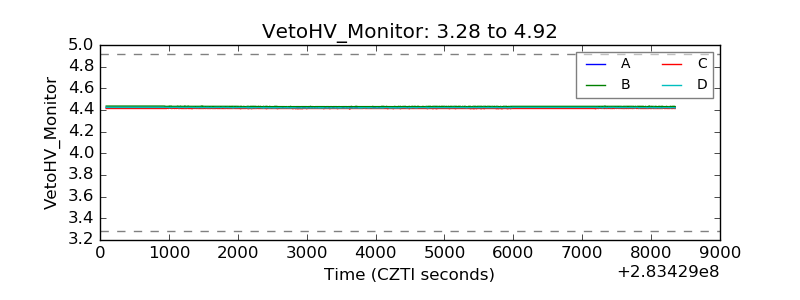 |
| Veto LLD | 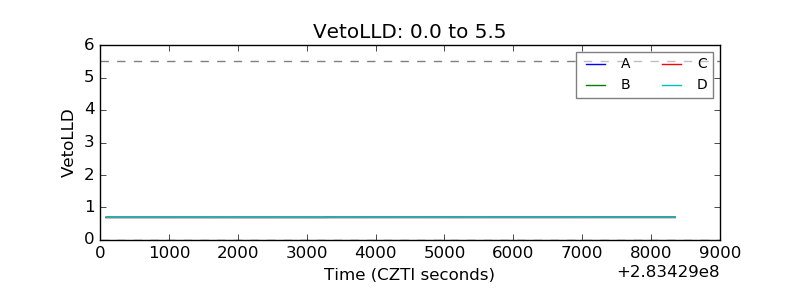 |
| Alpha Counter | 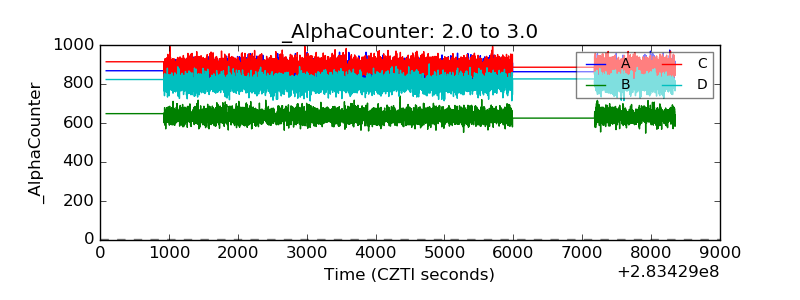 |
| _CPM_Rate | 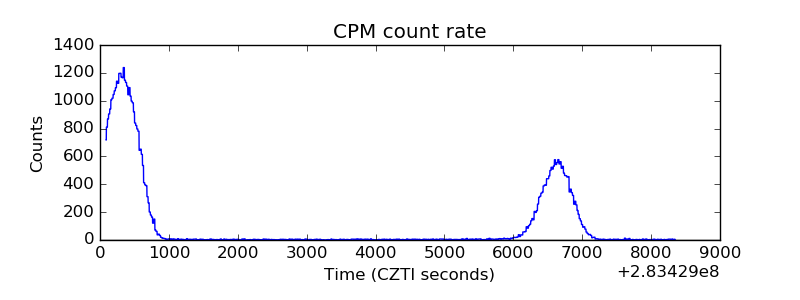 |
| CZT Counter | 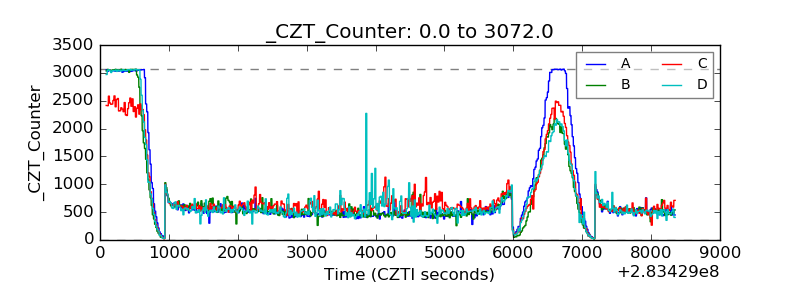 |
| +2.5 Volts monitor |  |
| +5 Volts monitor |  |
| _ROLL_ROT | 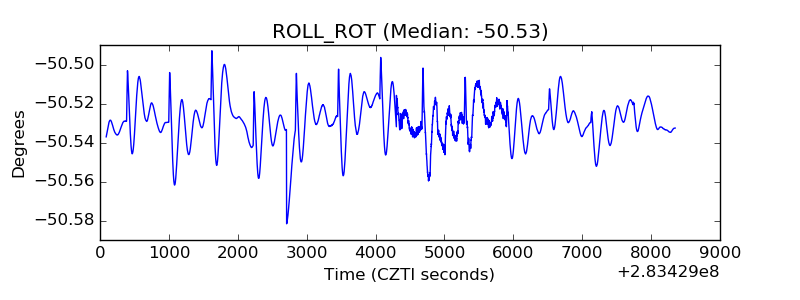 |
| _Roll_DEC | 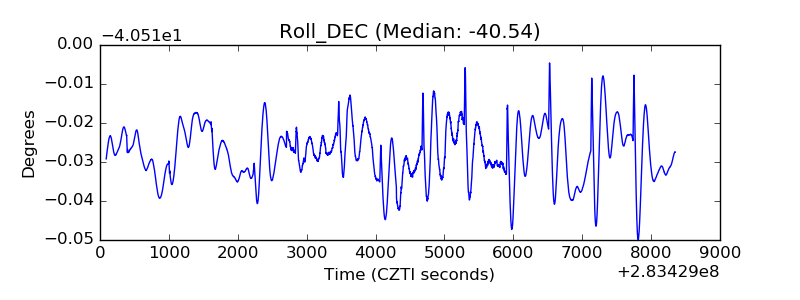 |
| _Roll_RA | 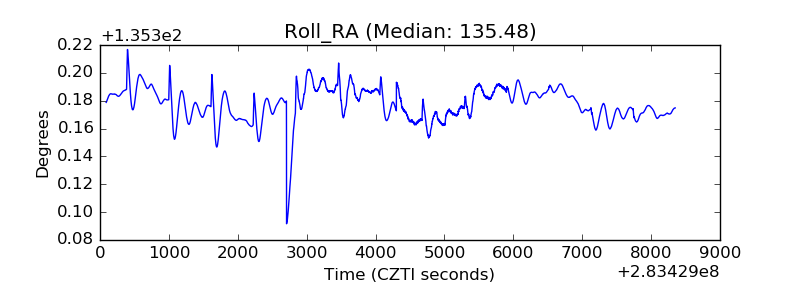 |
| Veto Counter | 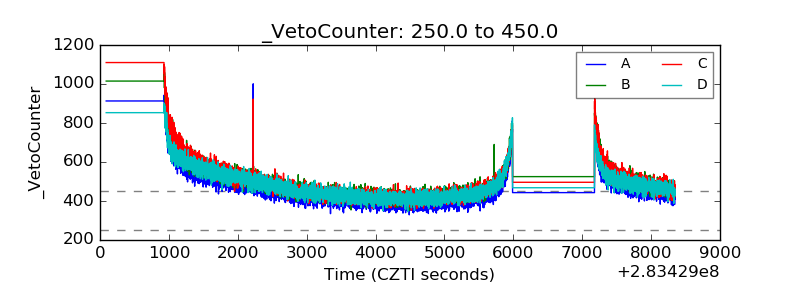 |