| Param | Original file | Final file |
|---|---|---|
| Filename | modeM0/AS1A05_140T01_9000002596_17531cztM0_level2.evt | modeM0/AS1A05_140T01_9000002596_17531cztM0_level2_quad_clean.evt |
| Size (bytes) | 496,745,280 | 76,521,600 |
| Size | 473.7 MB | 73.0 MB |
| Events in quadrant A | 3,486,509 | 464,406 |
| Events in quadrant B | 3,634,023 | 464,210 |
| Events in quadrant C | 3,766,111 | 447,140 |
| Events in quadrant D | 3,674,710 | 446,527 |
| Mode SS | |||
|---|---|---|---|
| Quadrant | BADHDUFLAG | Total packets | Discarded packets |
| A | 0 | 144 | 0 |
| B | 0 | 144 | 0 |
| C | 0 | 144 | 0 |
| D | 0 | 144 | 0 |
| Mode M0 | |||
|---|---|---|---|
| Quadrant | BADHDUFLAG | Total packets | Discarded packets |
| A | 0 | 14823 | 2 |
| B | 0 | 15151 | 2 |
| C | 0 | 15366 | 2 |
| D | 0 | 15561 | 2 |
| Mode M9 | |||
|---|---|---|---|
| Quadrant | BADHDUFLAG | Total packets | Discarded packets |
| A | 0 | 14 | 0 |
| B | 0 | 15 | 0 |
| C | 0 | 15 | 0 |
| D | 0 | 15 | 0 |
| Quadrant | Total seconds | Saturated seconds | Saturation percentage |
|---|---|---|---|
| A | 7104 | 133 | 1.872185% |
| B | 7104 | 161 | 2.266329% |
| C | 7104 | 162 | 2.280405% |
| D | 7104 | 141 | 1.984797% |
Noise dominated data is calculated using 1-second bins in cleaned event files. If a bin has >2000 counts, and if more than 50% of those come from <1% of pixels, then it is considered to be noise-dominated and hence unusable.
| Quadrant | # 1 sec bins | Bins with >0 counts | Bins with >2000 counts | High rate bins dominated by noise | Noise dominated (total time) | Noise dominated (detector-on time) | Marked lightcurve |
|---|---|---|---|---|---|---|---|
| A | 7954 | 7104 | 0 | 0 | 0.00% | 0.00% | 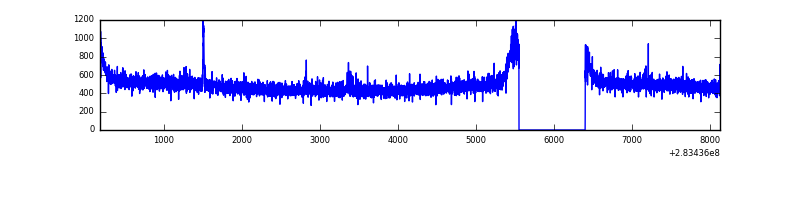 |
| B | 7954 | 7104 | 8 | 8 | 0.10% | 0.11% | 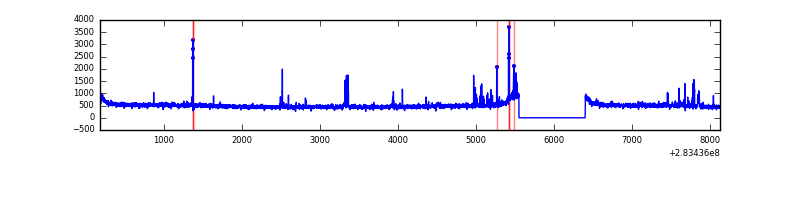 |
| C | 7954 | 7104 | 0 | 0 | 0.00% | 0.00% | 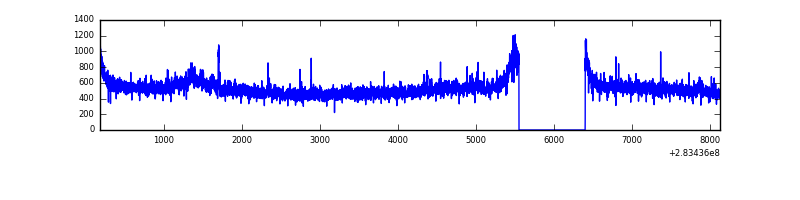 |
| D | 7954 | 7104 | 47 | 47 | 0.59% | 0.66% | 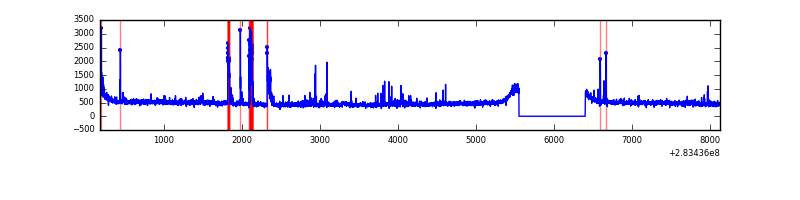 |
Top three noisy pixels from each quadrant. If the there are fewer than three noisy pixels in the level2.evt file, extra rows are filled as -1
| Pixel properties | Quadrant properties | ||||||
|---|---|---|---|---|---|---|---|
| Quadrant | DetID | PixID | Counts | Sigma | Mean | Median | Sigma |
| A | 15 | 174 | 25796 | 138.57 | 900 | 882 | 179.8 |
| A | 0 | 226 | 7996 | 39.57 | 900 | 882 | 179.8 |
| A | 12 | 194 | 6610 | 31.86 | 900 | 882 | 179.8 |
| B | 10 | 245 | 80694 | 472.3 | 893 | 873 | 169.0 |
| B | 0 | 189 | 30078 | 172.81 | 893 | 873 | 169.0 |
| B | 12 | 111 | 20068 | 113.58 | 893 | 873 | 169.0 |
| C | 3 | 233 | 241987 | 1204.23 | 860 | 868 | 200.2 |
| C | 14 | 238 | 134119 | 665.5 | 860 | 868 | 200.2 |
| C | 5 | 218 | 35988 | 175.4 | 860 | 868 | 200.2 |
| D | 2 | 14 | 176317 | 827.53 | 877 | 852 | 212.0 |
| D | 13 | 189 | 62650 | 291.45 | 877 | 852 | 212.0 |
| D | 5 | 222 | 59456 | 276.39 | 877 | 852 | 212.0 |
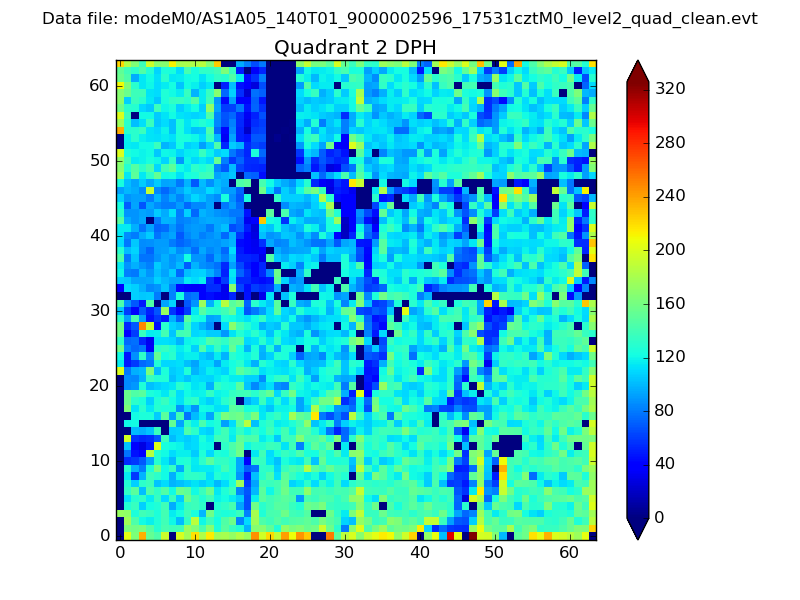
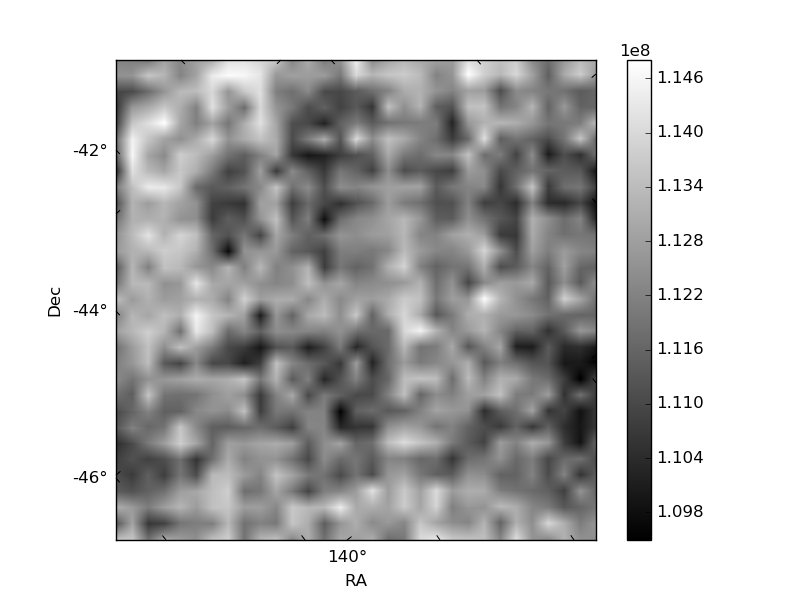
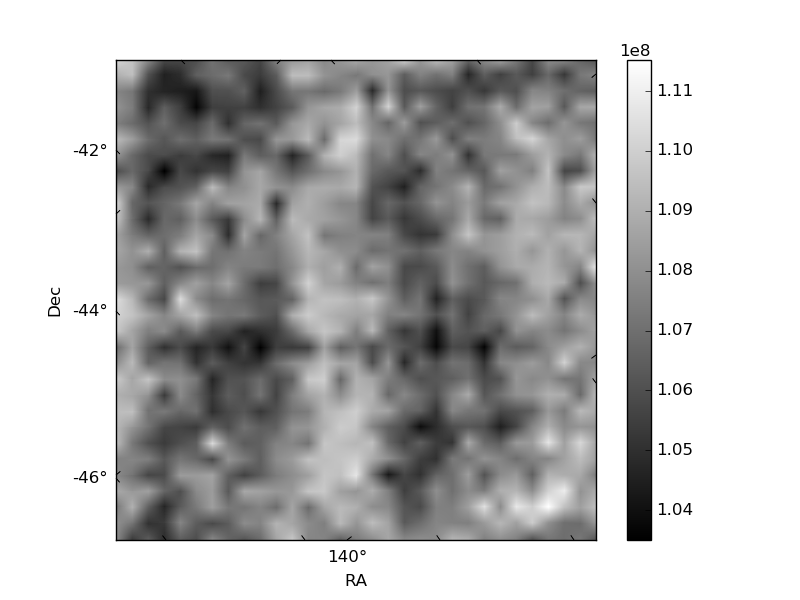
Histogram calculated using DETX and DETY for each event in the final _common_clean file
| Quadrant A |  |
 |
Quadrant B |
|---|---|---|---|
| Quadrant D | 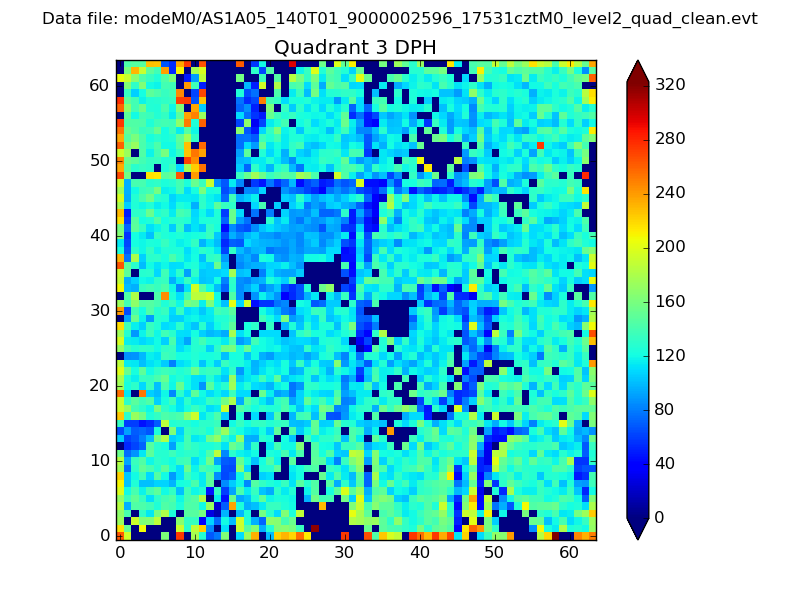 |
 |
Quadrant C |
| Plot type | Count rate plots | Images |
|---|---|---|
| Comparison with Poisson distribution Blue bars denote a histogram of data divided into 1 sec bins. Red curve is a Poisson curve with rate = median count rate of data. |
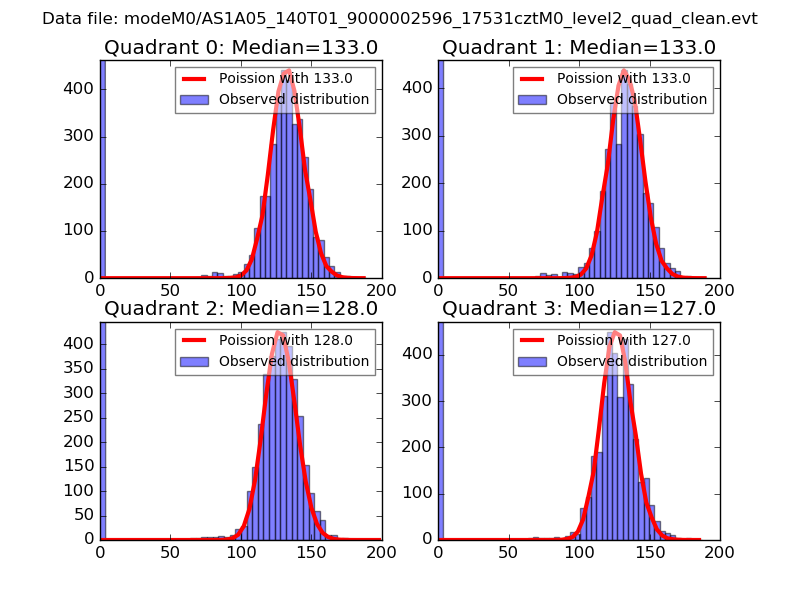 |
 |
| Quadrant-wise count rates Data is divided into 100 sec bins |
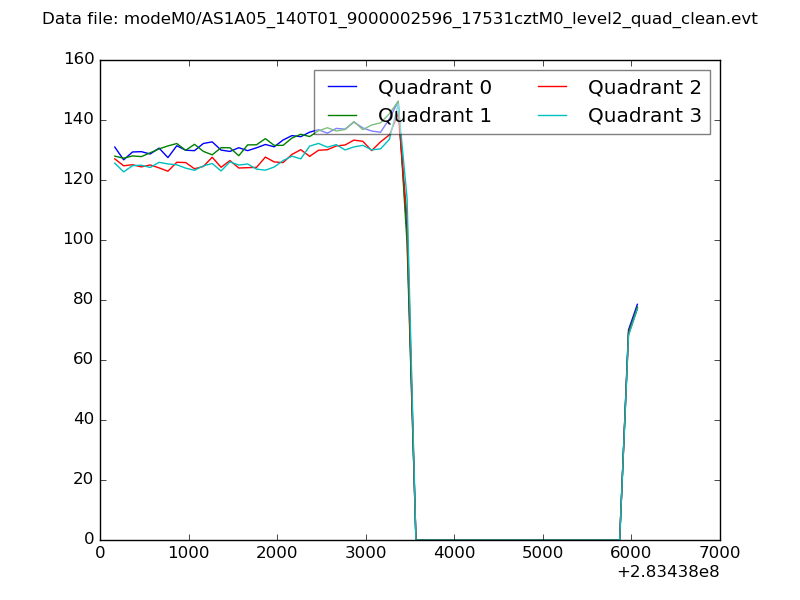 |
|
| Module-wise count rates for Quadrant A Data is divided into 100 sec bins |
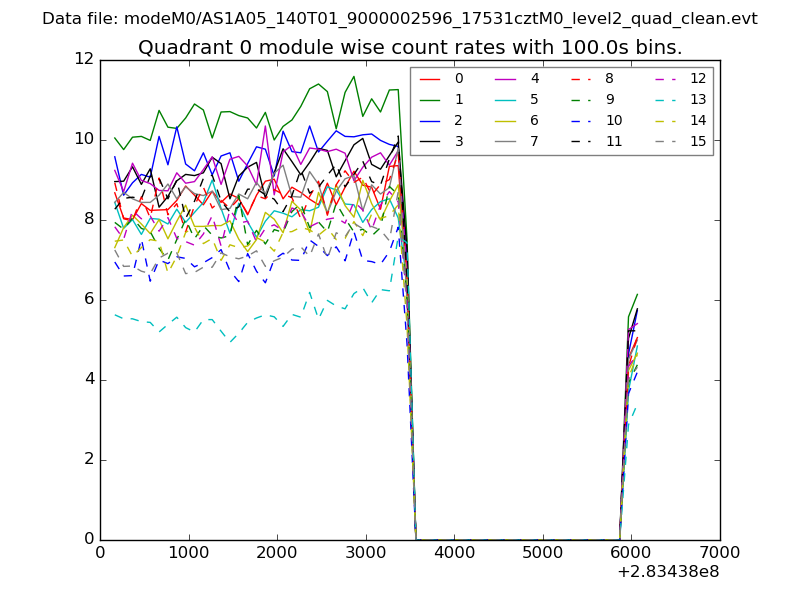 |
 |
| Module-wise count rates for Quadrant B Data is divided into 100 sec bins |
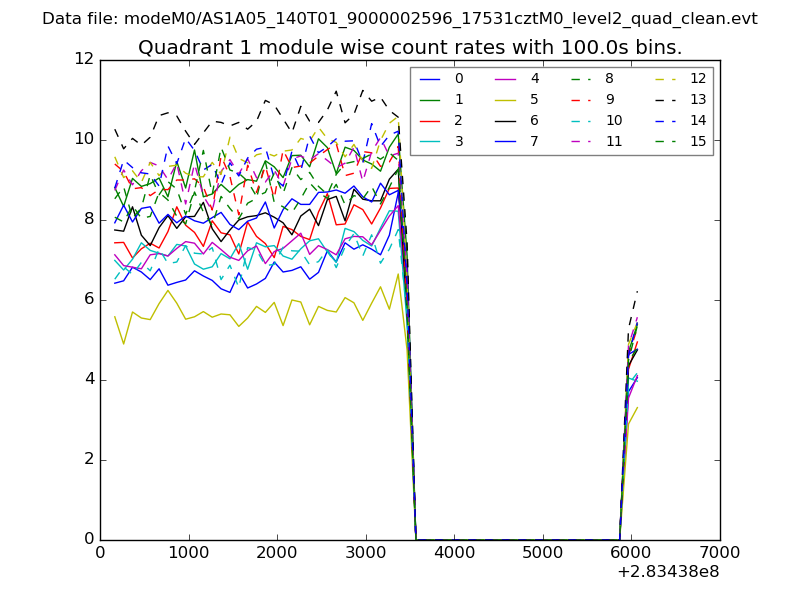 |
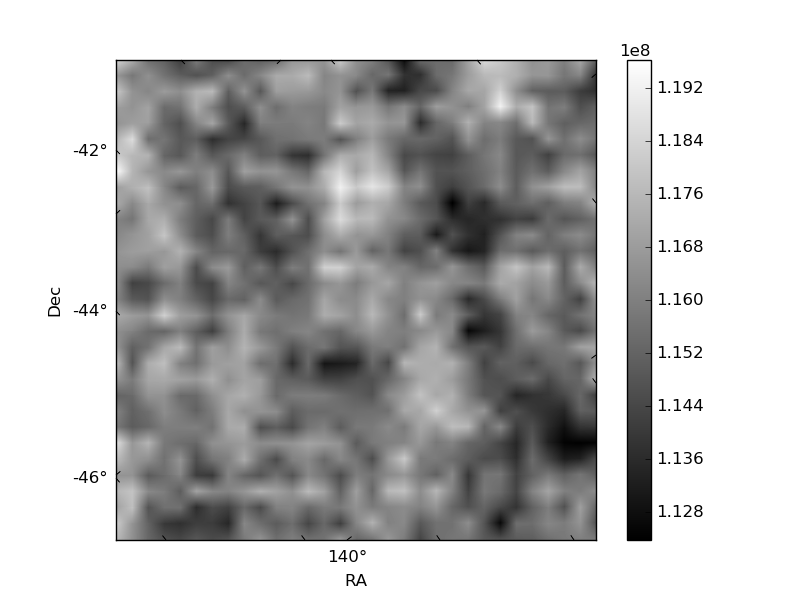 |
| Module-wise count rates for Quadrant C Data is divided into 100 sec bins |
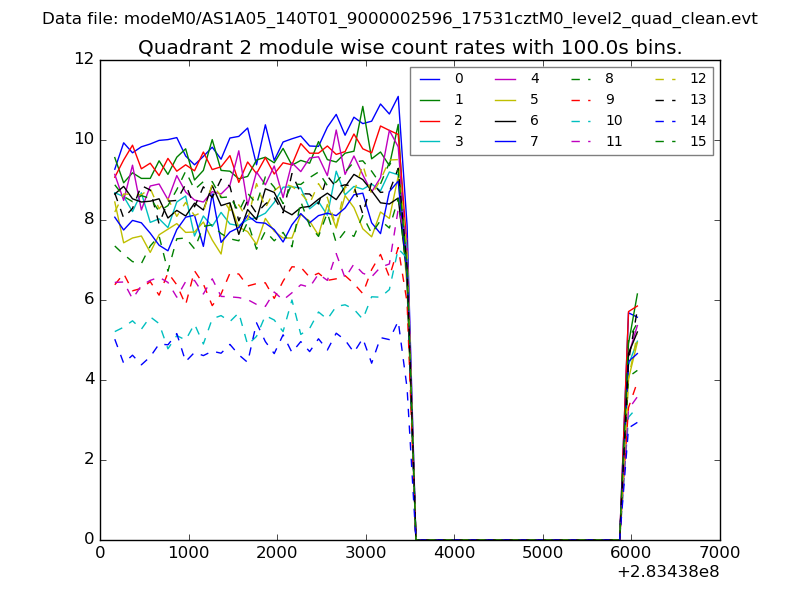 |
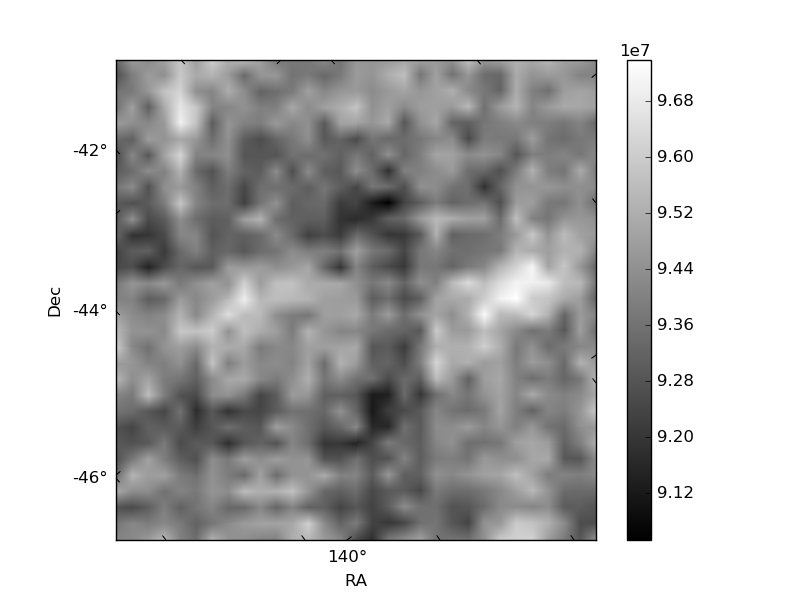 |
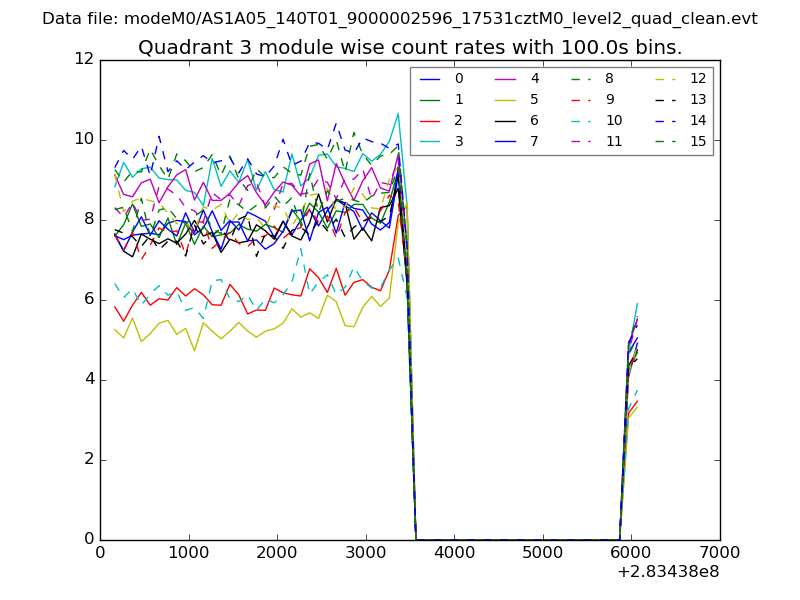
| Module-wise count rates for Quadrant D Data is divided into 100 sec bins |
 |
 |
| Parameter | Plot |
|---|---|
| CZT HV Monitor | 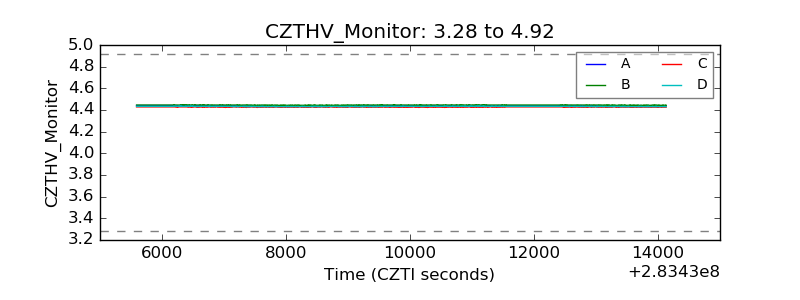 |
| D_VDD | 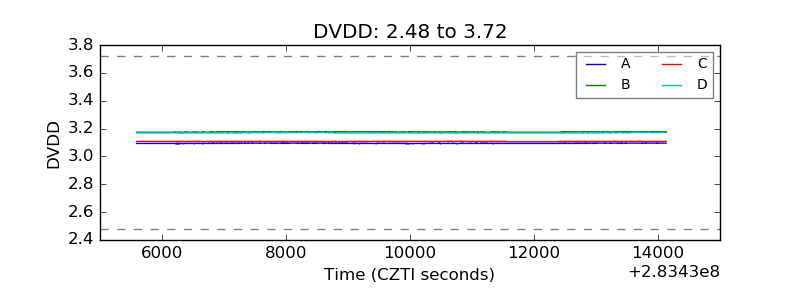 |
| Temperature 1 | 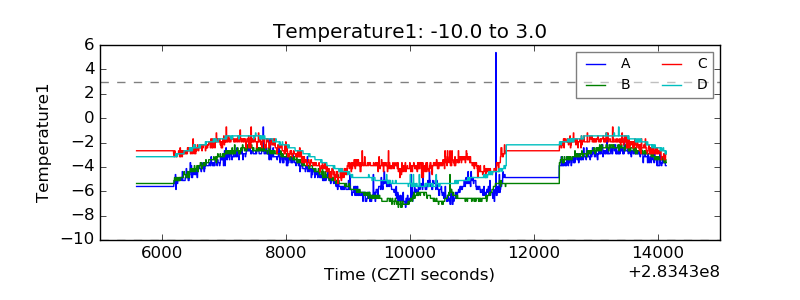 |
| Veto HV Monitor | 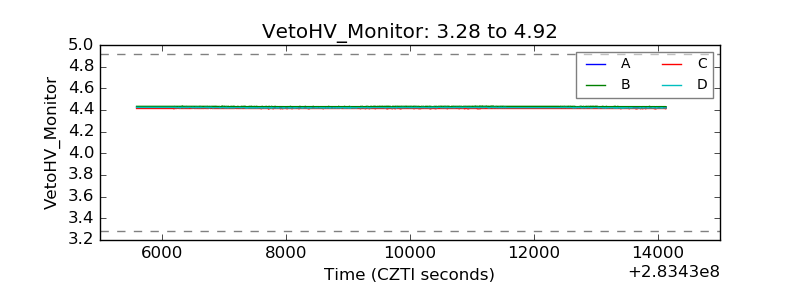 |
| Veto LLD | 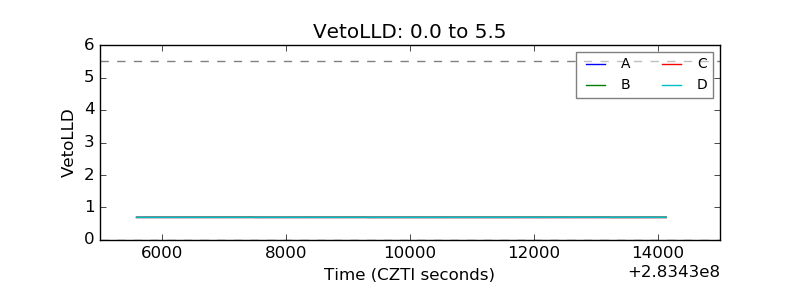 |
| Alpha Counter | 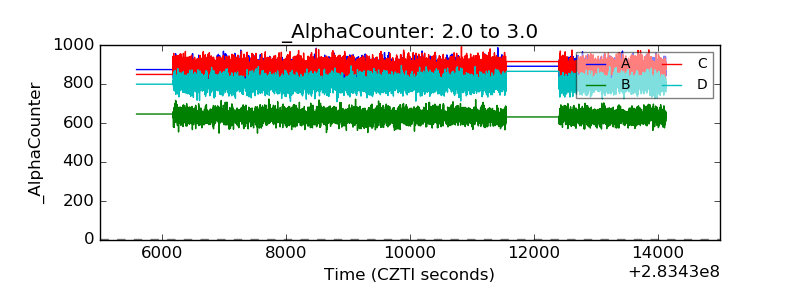 |
| _CPM_Rate | 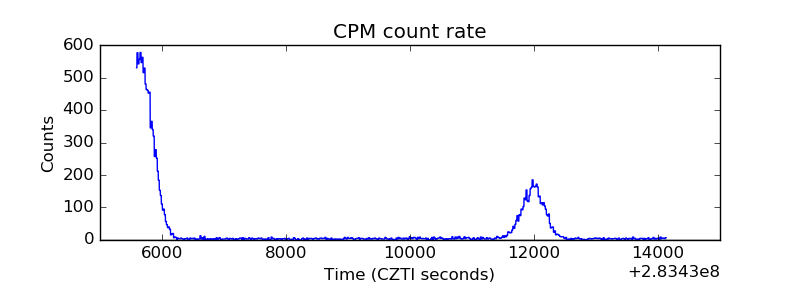 |
| CZT Counter | 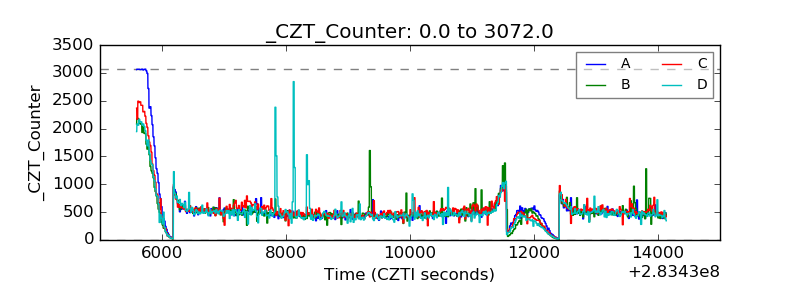 |
| +2.5 Volts monitor |  |
| +5 Volts monitor |  |
| _ROLL_ROT | 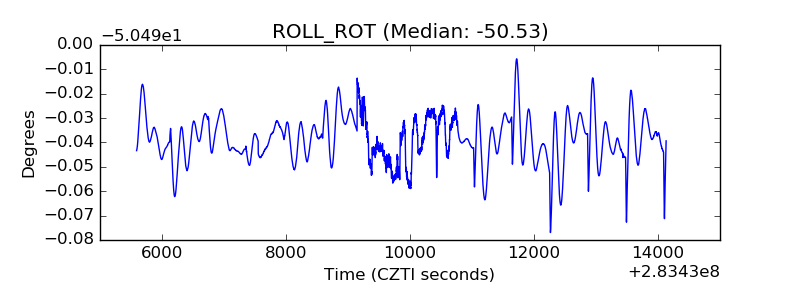 |
| _Roll_DEC | 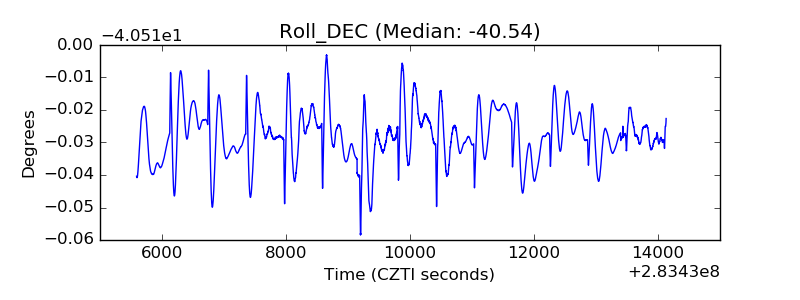 |
| _Roll_RA | 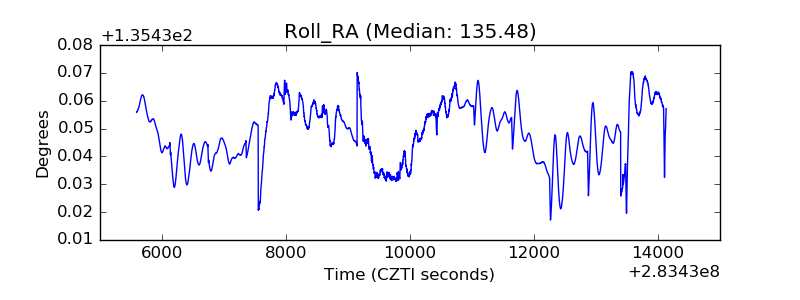 |
| Veto Counter | 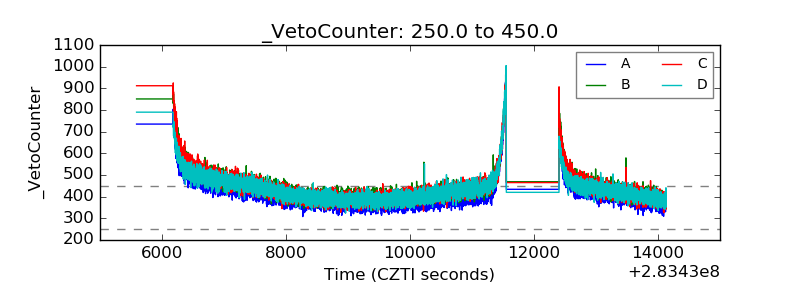 |