| Param | Original file | Final file |
|---|---|---|
| Filename | modeM0/AS1A05_140T01_9000002596_17532cztM0_level2.evt | modeM0/AS1A05_140T01_9000002596_17532cztM0_level2_quad_clean.evt |
| Size (bytes) | 284,094,720 | 53,582,400 |
| Size | 270.9 MB | 51.1 MB |
| Events in quadrant A | 1,953,992 | 337,906 |
| Events in quadrant B | 2,085,656 | 335,586 |
| Events in quadrant C | 2,060,642 | 324,553 |
| Events in quadrant D | 2,209,513 | 321,232 |
| Mode SS | |||
|---|---|---|---|
| Quadrant | BADHDUFLAG | Total packets | Discarded packets |
| A | 0 | 86 | 0 |
| B | 0 | 86 | 0 |
| C | 0 | 86 | 0 |
| D | 0 | 86 | 0 |
| Mode M0 | |||
|---|---|---|---|
| Quadrant | BADHDUFLAG | Total packets | Discarded packets |
| A | 0 | 8763 | 1 |
| B | 0 | 9049 | 1 |
| C | 0 | 8878 | 1 |
| D | 0 | 9574 | 1 |
| Mode M9 | |||
|---|---|---|---|
| Quadrant | BADHDUFLAG | Total packets | Discarded packets |
| A | 0 | 4 | 0 |
| B | 0 | 5 | 0 |
| C | 0 | 5 | 0 |
| D | 0 | 5 | 0 |
| Quadrant | Total seconds | Saturated seconds | Saturation percentage |
|---|---|---|---|
| A | 4304 | 19 | 0.441450% |
| B | 4304 | 45 | 1.045539% |
| C | 4304 | 39 | 0.906134% |
| D | 4304 | 70 | 1.626394% |
Noise dominated data is calculated using 1-second bins in cleaned event files. If a bin has >2000 counts, and if more than 50% of those come from <1% of pixels, then it is considered to be noise-dominated and hence unusable.
| Quadrant | # 1 sec bins | Bins with >0 counts | Bins with >2000 counts | High rate bins dominated by noise | Noise dominated (total time) | Noise dominated (detector-on time) | Marked lightcurve |
|---|---|---|---|---|---|---|---|
| A | 4304 | 4304 | 0 | 0 | 0.00% | 0.00% | 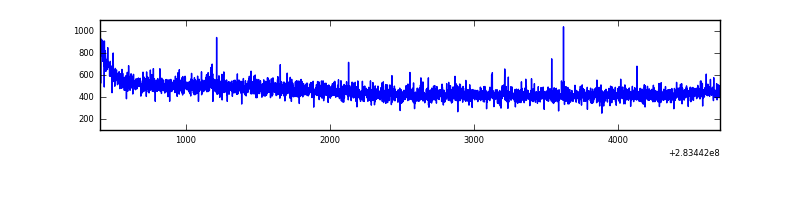 |
| B | 4304 | 4304 | 13 | 13 | 0.30% | 0.30% | 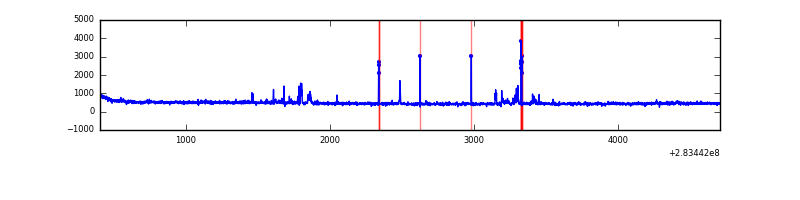 |
| C | 4304 | 4304 | 0 | 0 | 0.00% | 0.00% | 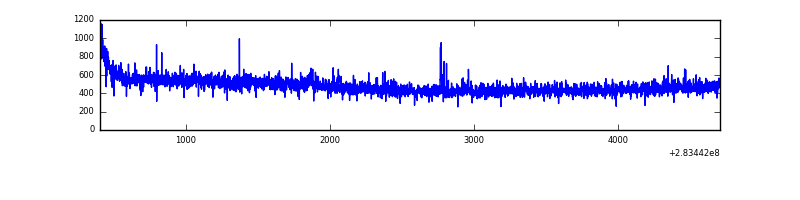 |
| D | 4304 | 4304 | 59 | 59 | 1.37% | 1.37% | 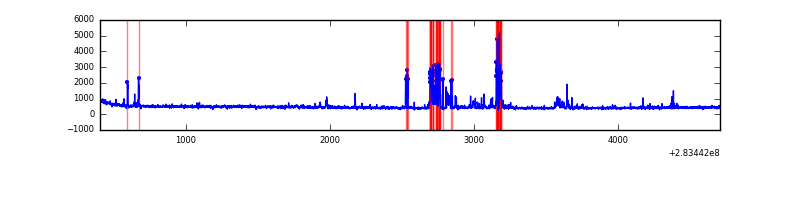 |
Top three noisy pixels from each quadrant. If the there are fewer than three noisy pixels in the level2.evt file, extra rows are filled as -1
| Pixel properties | Quadrant properties | ||||||
|---|---|---|---|---|---|---|---|
| Quadrant | DetID | PixID | Counts | Sigma | Mean | Median | Sigma |
| A | 15 | 174 | 6346 | 56.87 | 506 | 497 | 102.8 |
| A | 0 | 226 | 4564 | 39.54 | 506 | 497 | 102.8 |
| A | 3 | 137 | 3807 | 32.18 | 506 | 497 | 102.8 |
| B | 10 | 245 | 83476 | 857.12 | 503 | 490 | 96.8 |
| B | 5 | 172 | 17876 | 179.57 | 503 | 490 | 96.8 |
| B | 12 | 111 | 11201 | 110.63 | 503 | 490 | 96.8 |
| C | 14 | 238 | 75215 | 657.99 | 482 | 486 | 113.6 |
| C | 3 | 233 | 72461 | 633.75 | 482 | 486 | 113.6 |
| C | 5 | 218 | 28685 | 248.29 | 482 | 486 | 113.6 |
| D | 13 | 189 | 196360 | 1649.43 | 488 | 474 | 118.8 |
| D | 5 | 222 | 127453 | 1069.21 | 488 | 474 | 118.8 |
| D | 13 | 168 | 20704 | 170.34 | 488 | 474 | 118.8 |
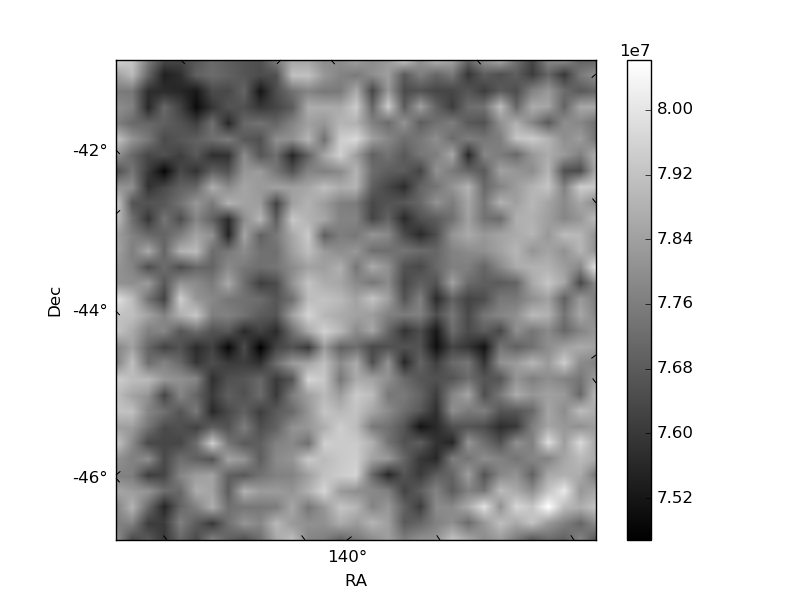
Histogram calculated using DETX and DETY for each event in the final _common_clean file
| Quadrant A | 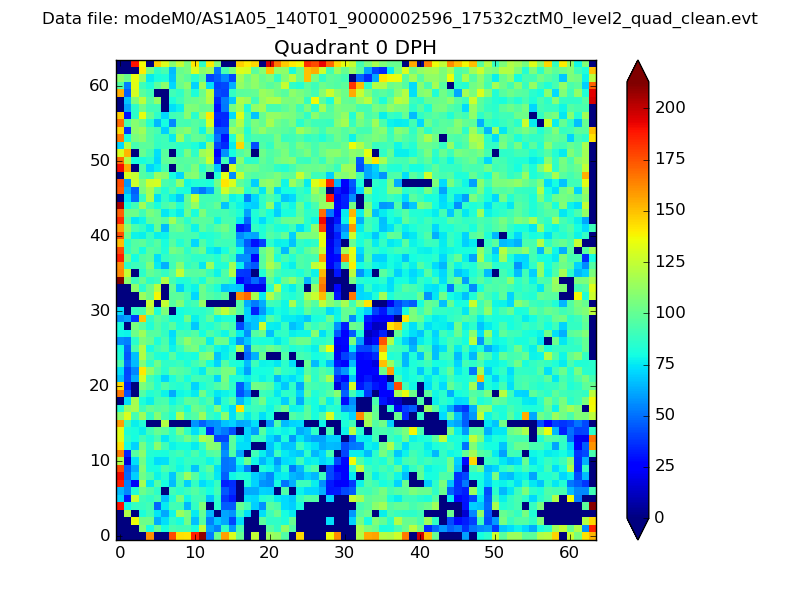 |
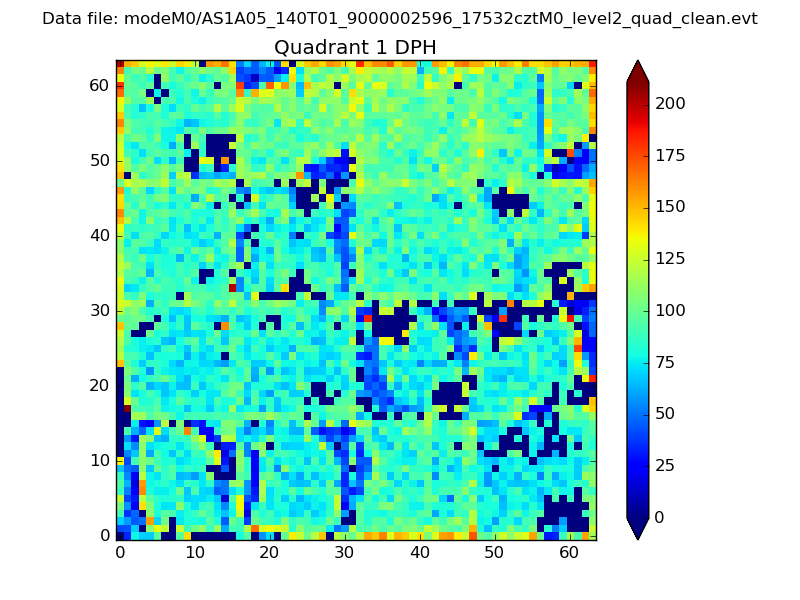 |
Quadrant B |
|---|---|---|---|
| Quadrant D |  |
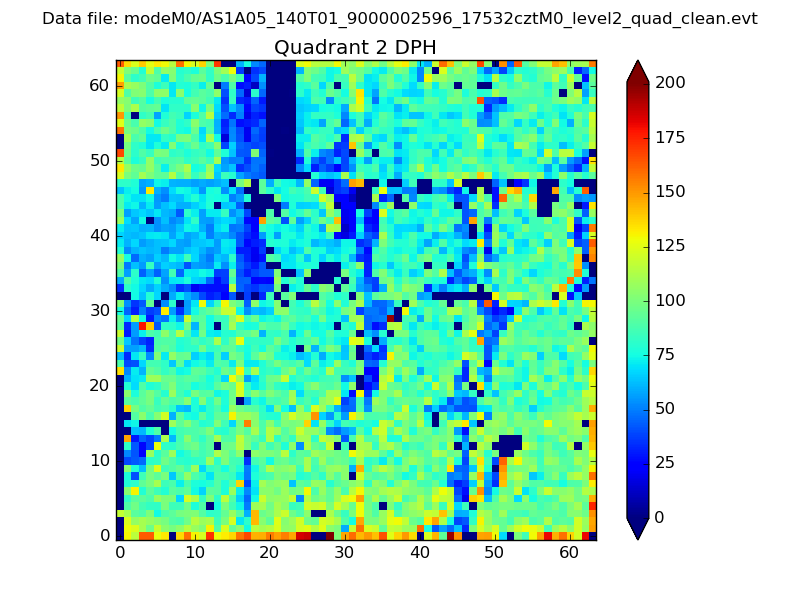 |
Quadrant C |
| Plot type | Count rate plots | Images |
|---|---|---|
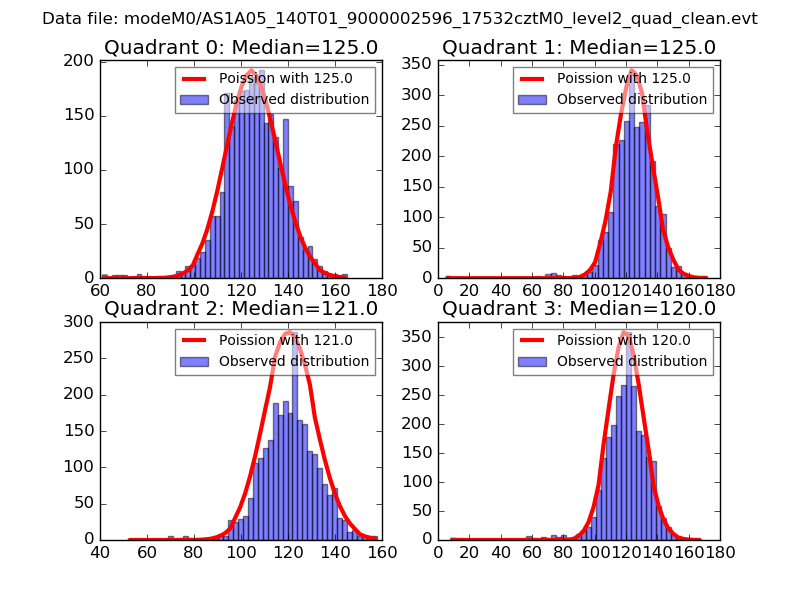
| Comparison with Poisson distribution Blue bars denote a histogram of data divided into 1 sec bins. Red curve is a Poisson curve with rate = median count rate of data. |
 |
 |
| Quadrant-wise count rates Data is divided into 100 sec bins |
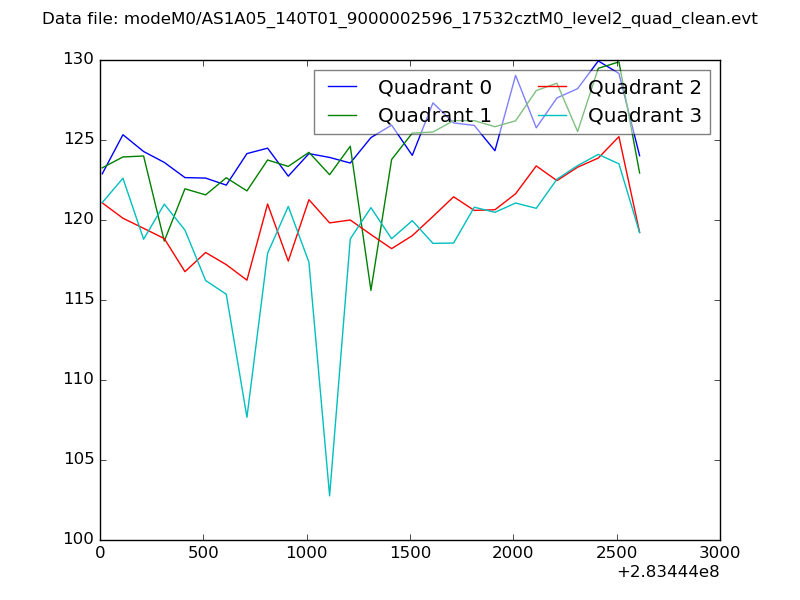 |
|
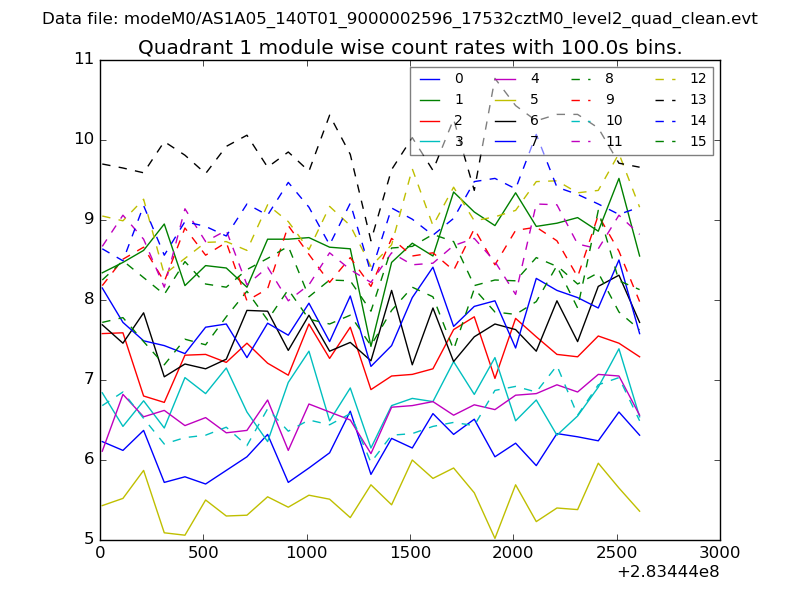
| Module-wise count rates for Quadrant A Data is divided into 100 sec bins |
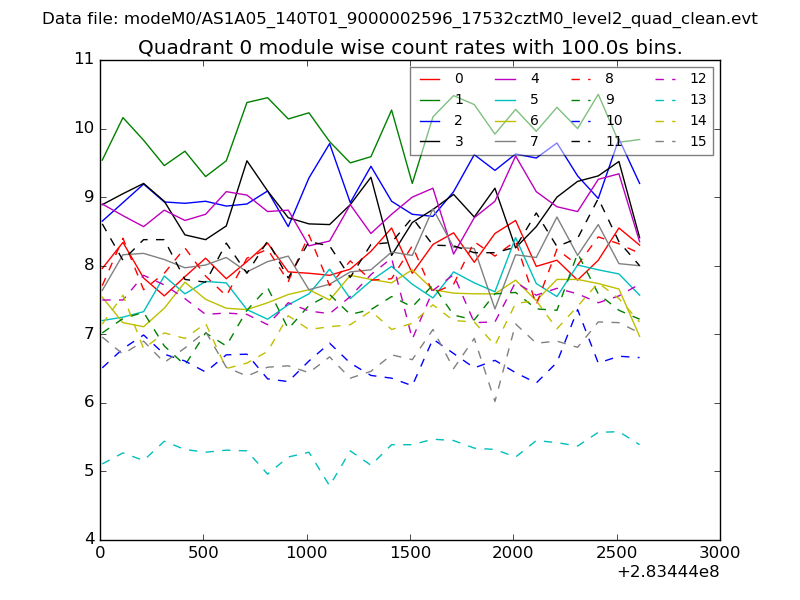 |
 |
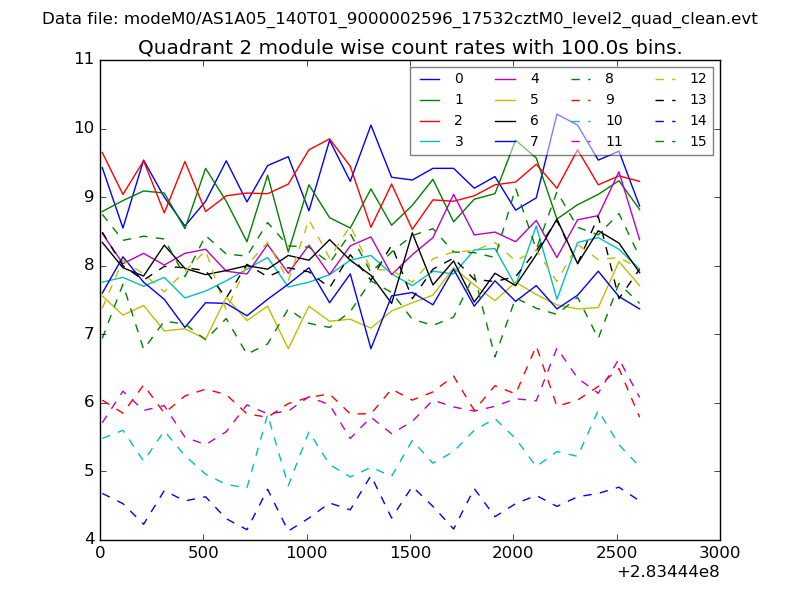
| Module-wise count rates for Quadrant B Data is divided into 100 sec bins |
 |
 |
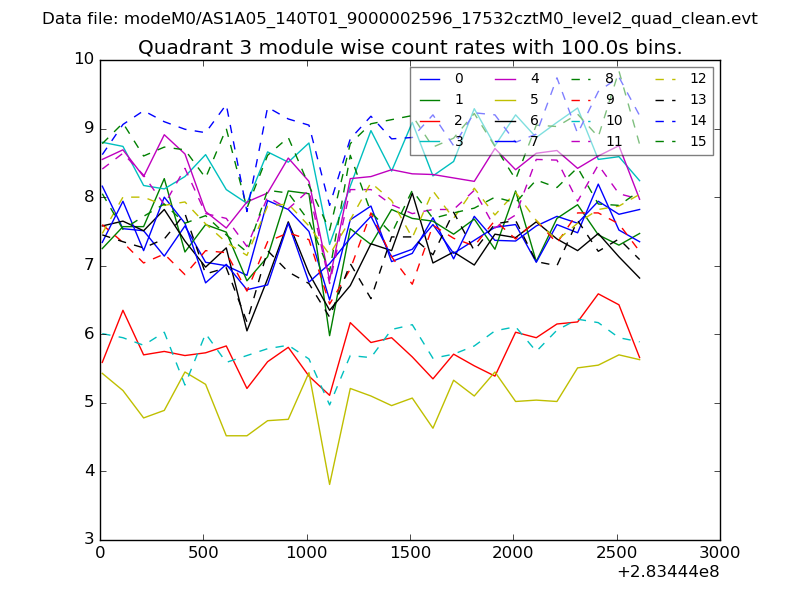
| Module-wise count rates for Quadrant C Data is divided into 100 sec bins |
 |
 |
| Module-wise count rates for Quadrant D Data is divided into 100 sec bins |
 |
 |
| Parameter | Plot |
|---|---|
| CZT HV Monitor | 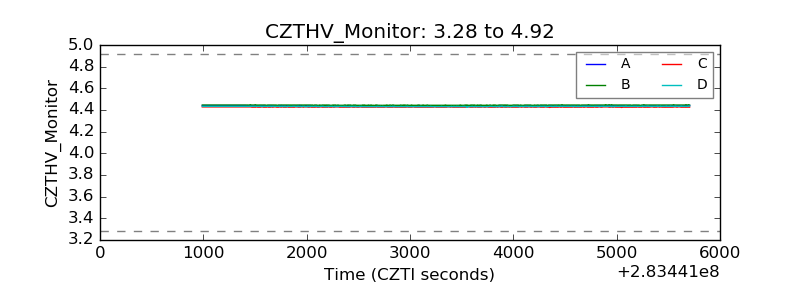 |
| D_VDD | 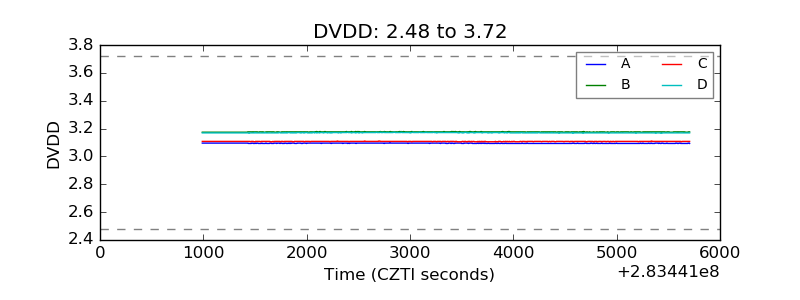 |
| Temperature 1 | 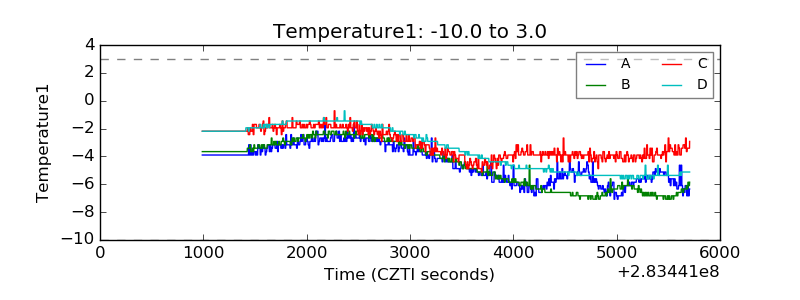 |
| Veto HV Monitor | 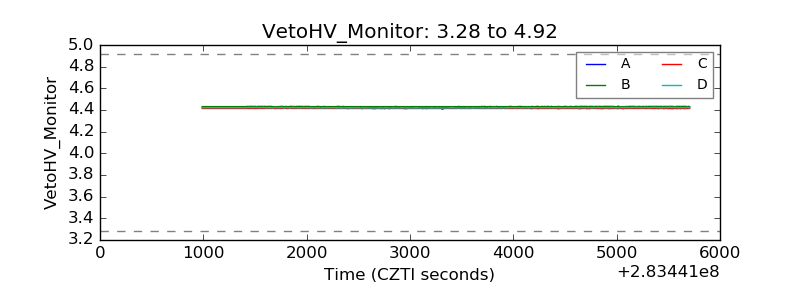 |
| Veto LLD | 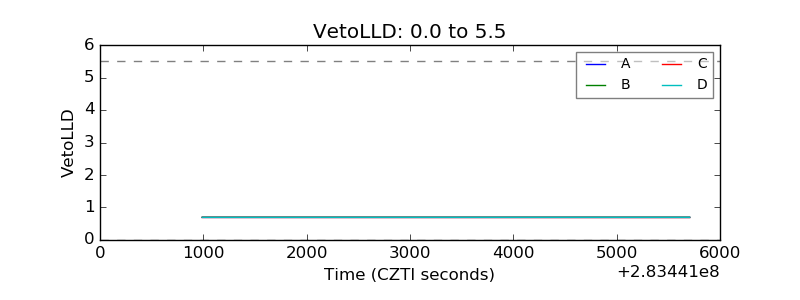 |
| Alpha Counter | 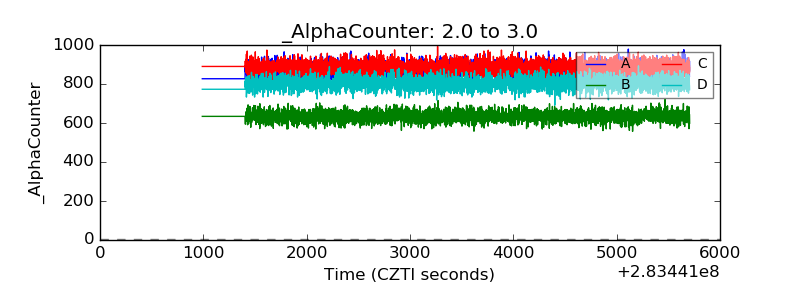 |
| _CPM_Rate | 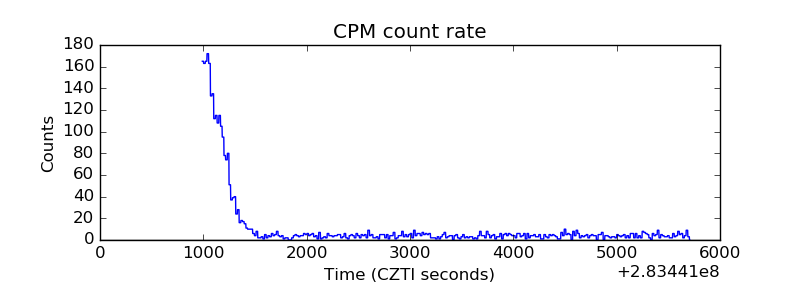 |
| CZT Counter | 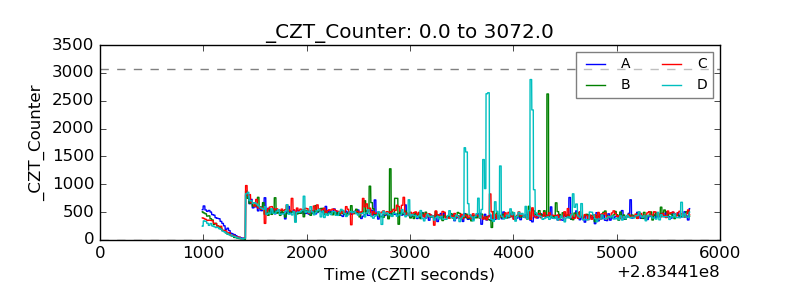 |
| +2.5 Volts monitor |  |
| +5 Volts monitor | 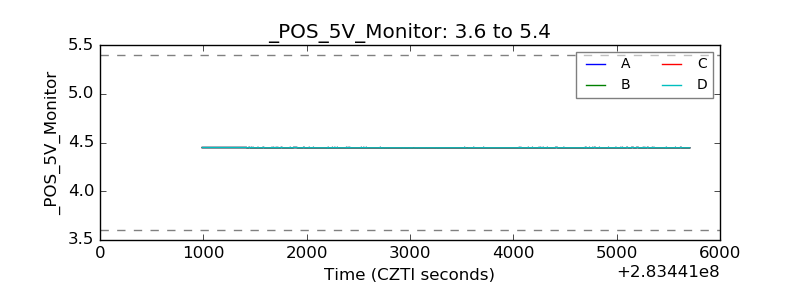 |
| _ROLL_ROT | 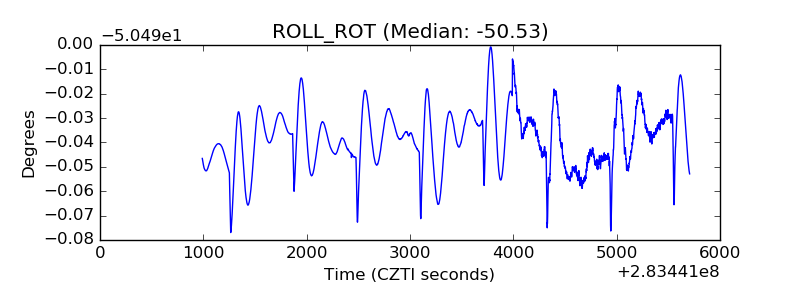 |
| _Roll_DEC | 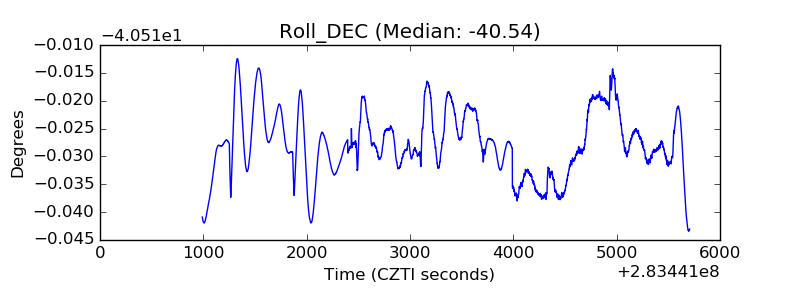 |
| _Roll_RA | 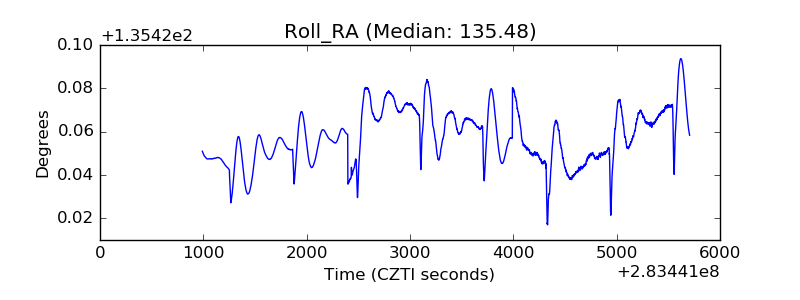 |
| Veto Counter | 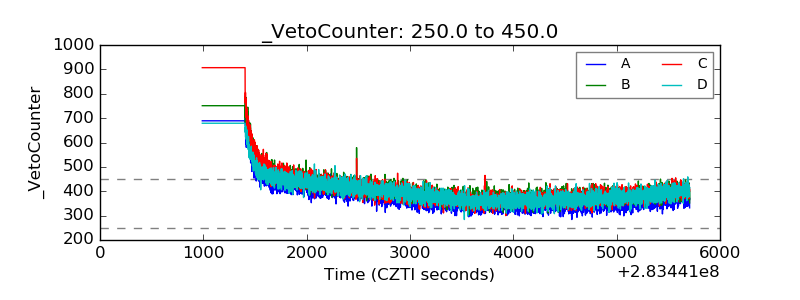 |