| Param | Original file | Final file |
|---|---|---|
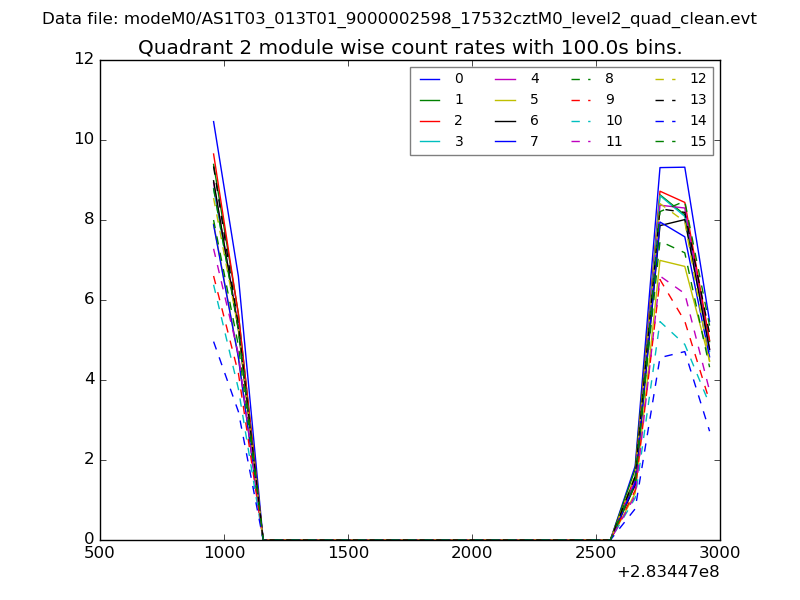
| Filename | modeM0/AS1T03_013T01_9000002598_17532cztM0_level2.evt | modeM0/AS1T03_013T01_9000002598_17532cztM0_level2_quad_clean.evt |
| Size (bytes) | 127,056,960 | 11,609,280 |
| Size | 121.2 MB | 11.1 MB |
| Events in quadrant A | 880,662 | 58,760 |
| Events in quadrant B | 971,243 | 58,345 |
| Events in quadrant C | 881,543 | 54,493 |
| Events in quadrant D | 997,563 | 55,615 |
| Mode M9 | |||
|---|---|---|---|
| Quadrant | BADHDUFLAG | Total packets | Discarded packets |
| A | 0 | 5 | 0 |
| B | 0 | 5 | 0 |
| C | 0 | 5 | 0 |
| D | 0 | 5 | 0 |
| Mode M0 | |||
|---|---|---|---|
| Quadrant | BADHDUFLAG | Total packets | Discarded packets |
| A | 0 | 3635 | 1 |
| B | 0 | 3930 | 1 |
| C | 0 | 3597 | 1 |
| D | 0 | 4007 | 1 |
| Mode SS | |||
|---|---|---|---|
| Quadrant | BADHDUFLAG | Total packets | Discarded packets |
| A | 0 | 36 | 0 |
| B | 0 | 36 | 0 |
| C | 0 | 36 | 0 |
| D | 0 | 36 | 0 |
| Quadrant | Total seconds | Saturated seconds | Saturation percentage |
|---|---|---|---|
| A | 1679 | 63 | 3.752233% |
| B | 1679 | 78 | 4.645622% |
| C | 1678 | 84 | 5.005959% |
| D | 1678 | 80 | 4.767580% |
Noise dominated data is calculated using 1-second bins in cleaned event files. If a bin has >2000 counts, and if more than 50% of those come from <1% of pixels, then it is considered to be noise-dominated and hence unusable.
| Quadrant | # 1 sec bins | Bins with >0 counts | Bins with >2000 counts | High rate bins dominated by noise | Noise dominated (total time) | Noise dominated (detector-on time) | Marked lightcurve |
|---|---|---|---|---|---|---|---|
| A | 2179 | 1680 | 0 | 0 | 0.00% | 0.00% | 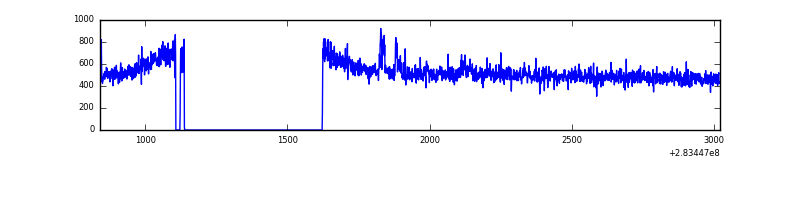 |
| B | 2179 | 1681 | 5 | 5 | 0.23% | 0.30% | 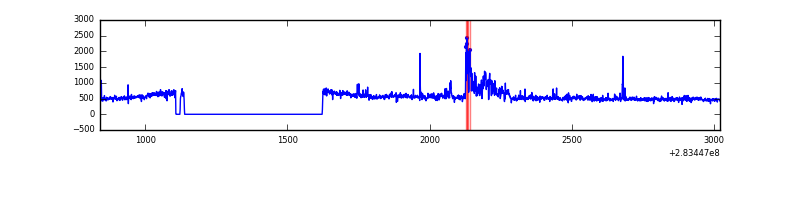 |
| C | 2178 | 1680 | 0 | 0 | 0.00% | 0.00% | 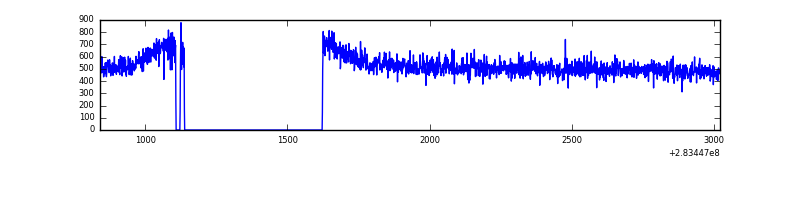 |
| D | 2178 | 1680 | 19 | 19 | 0.87% | 1.13% | 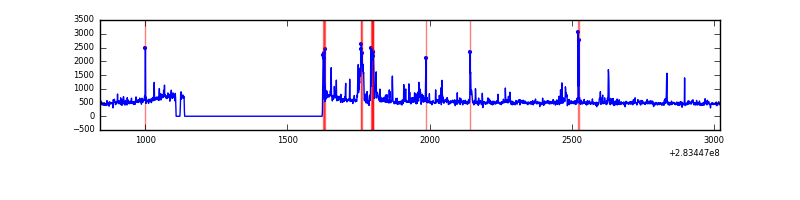 |
Top three noisy pixels from each quadrant. If the there are fewer than three noisy pixels in the level2.evt file, extra rows are filled as -1
| Pixel properties | Quadrant properties | ||||||
|---|---|---|---|---|---|---|---|
| Quadrant | DetID | PixID | Counts | Sigma | Mean | Median | Sigma |
| A | 15 | 174 | 12071 | 249.76 | 225 | 220 | 47.5 |
| A | 0 | 226 | 2045 | 38.46 | 225 | 220 | 47.5 |
| A | 12 | 194 | 1792 | 33.13 | 225 | 220 | 47.5 |
| B | 4 | 216 | 71832 | 1593.62 | 222 | 215 | 44.9 |
| B | 0 | 219 | 9842 | 214.22 | 222 | 215 | 44.9 |
| B | 0 | 198 | 6190 | 132.96 | 222 | 215 | 44.9 |
| C | 14 | 238 | 32418 | 626.13 | 211 | 211 | 51.4 |
| C | 3 | 233 | 13283 | 254.13 | 211 | 211 | 51.4 |
| C | 5 | 218 | 8864 | 168.22 | 211 | 211 | 51.4 |
| D | 13 | 189 | 56835 | 1029.44 | 217 | 210 | 55.0 |
| D | 2 | 14 | 48034 | 869.44 | 217 | 210 | 55.0 |
| D | 13 | 168 | 22561 | 406.34 | 217 | 210 | 55.0 |
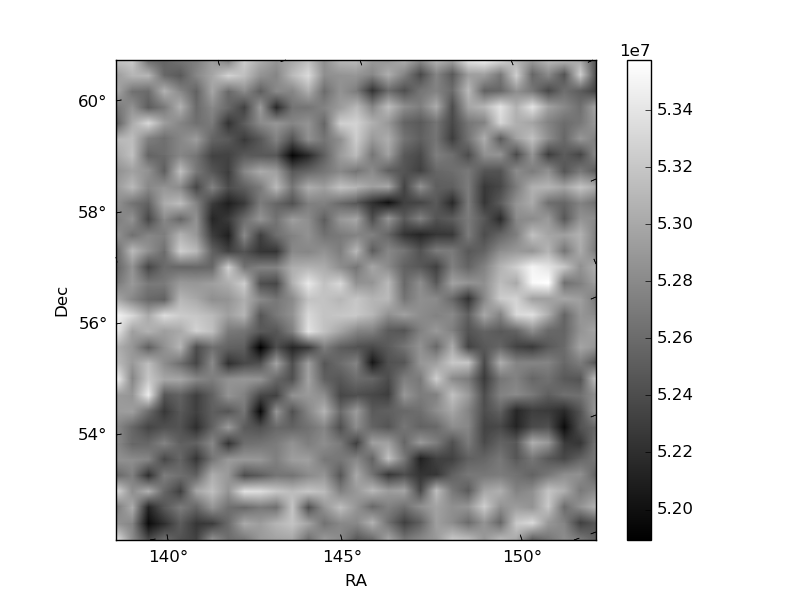
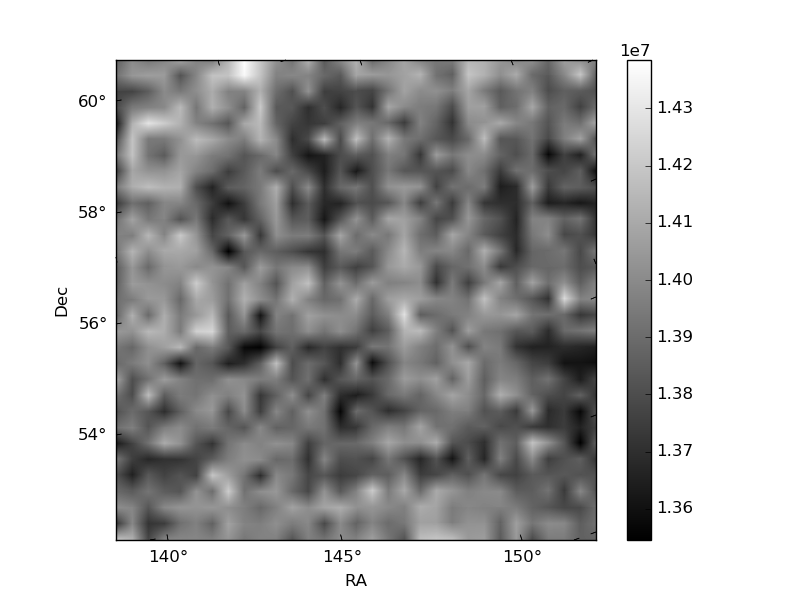
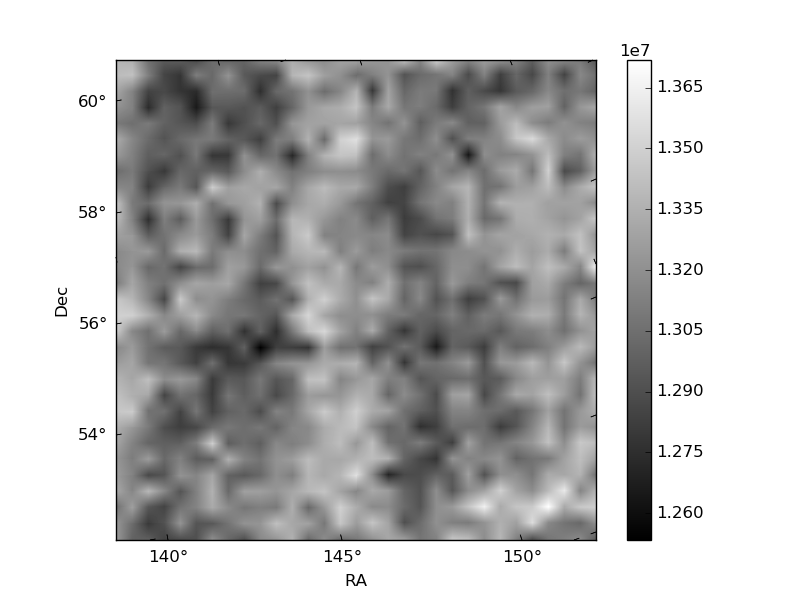
Histogram calculated using DETX and DETY for each event in the final _common_clean file
| Quadrant A | 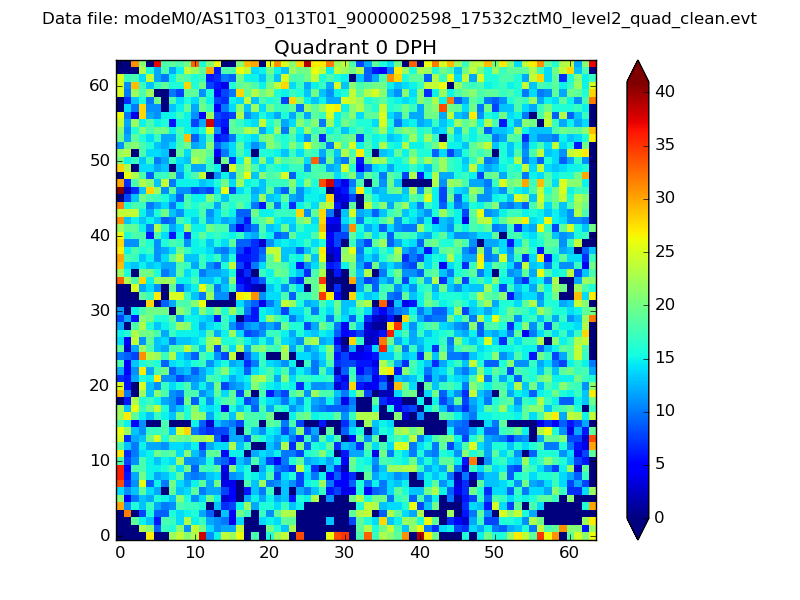 |
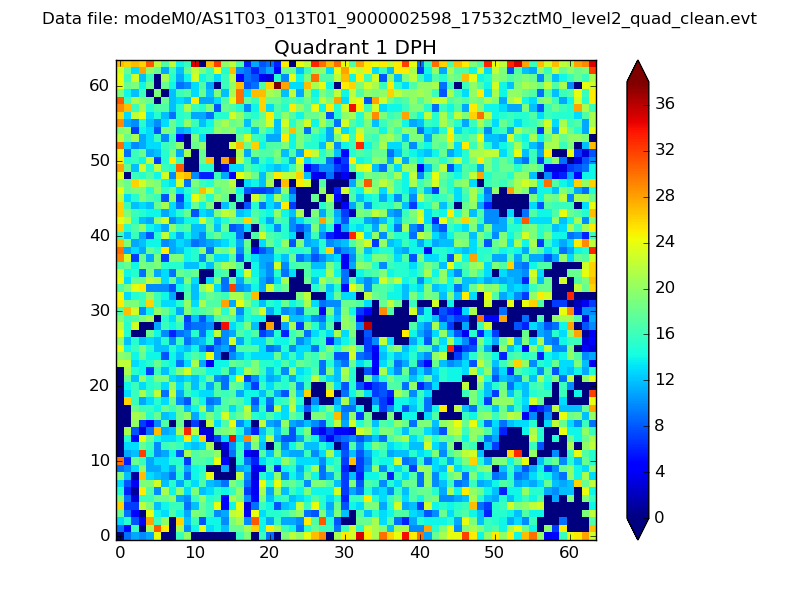 |
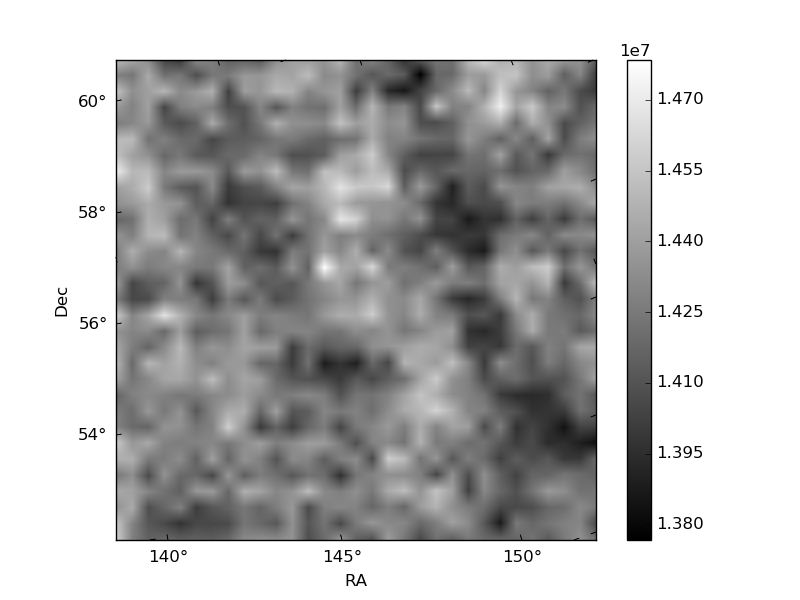
Quadrant B |
|---|---|---|---|
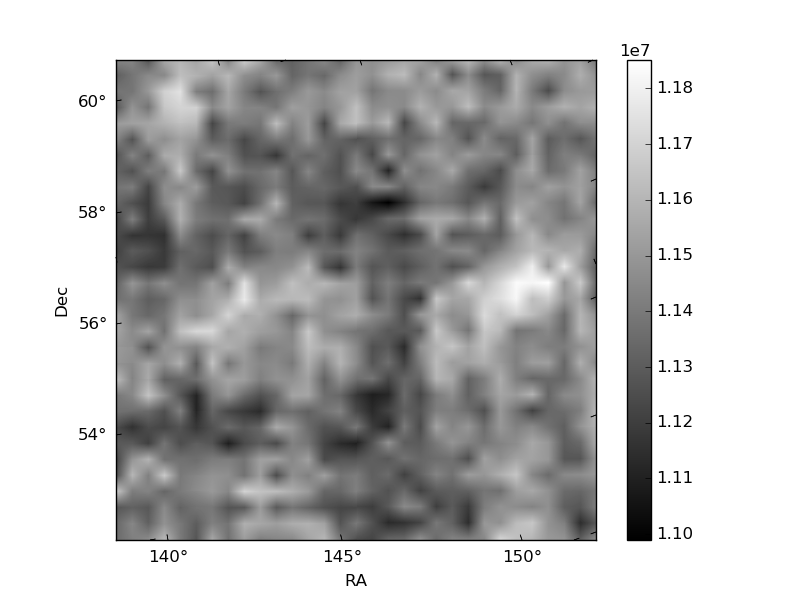
| Quadrant D | 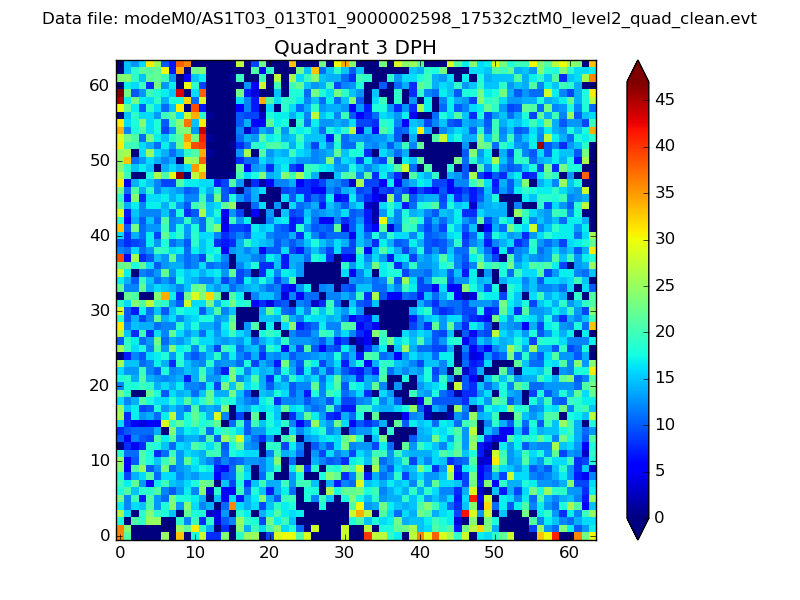 |
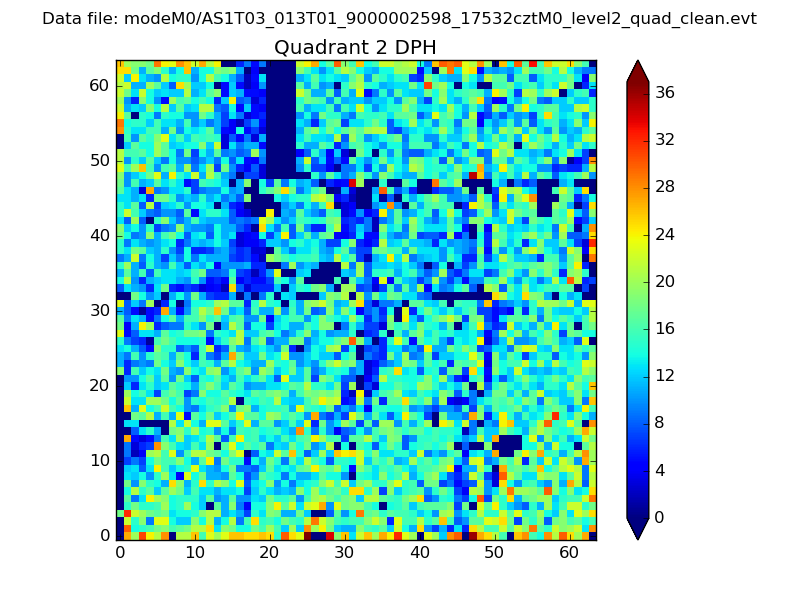 |
Quadrant C |
| Plot type | Count rate plots | Images |
|---|---|---|
| Comparison with Poisson distribution Blue bars denote a histogram of data divided into 1 sec bins. Red curve is a Poisson curve with rate = median count rate of data. |
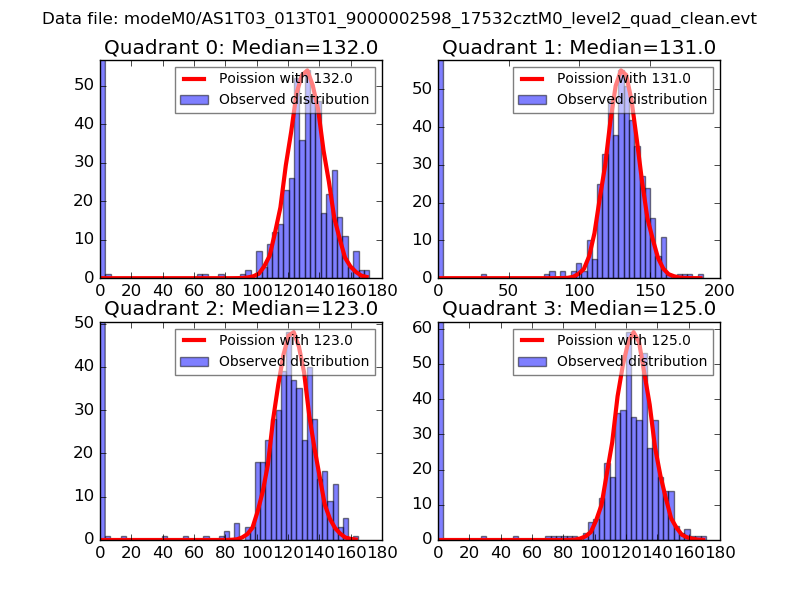 |
 |
| Quadrant-wise count rates Data is divided into 100 sec bins |
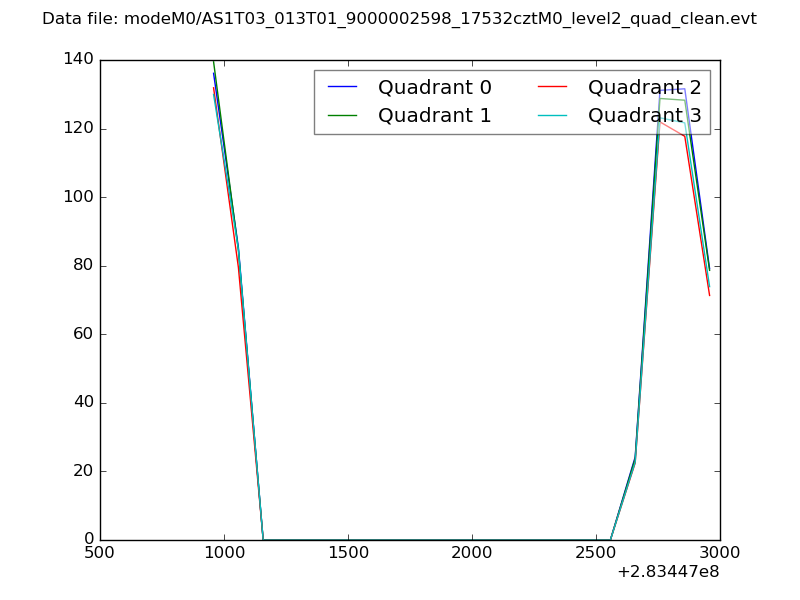 |
|
| Module-wise count rates for Quadrant A Data is divided into 100 sec bins |
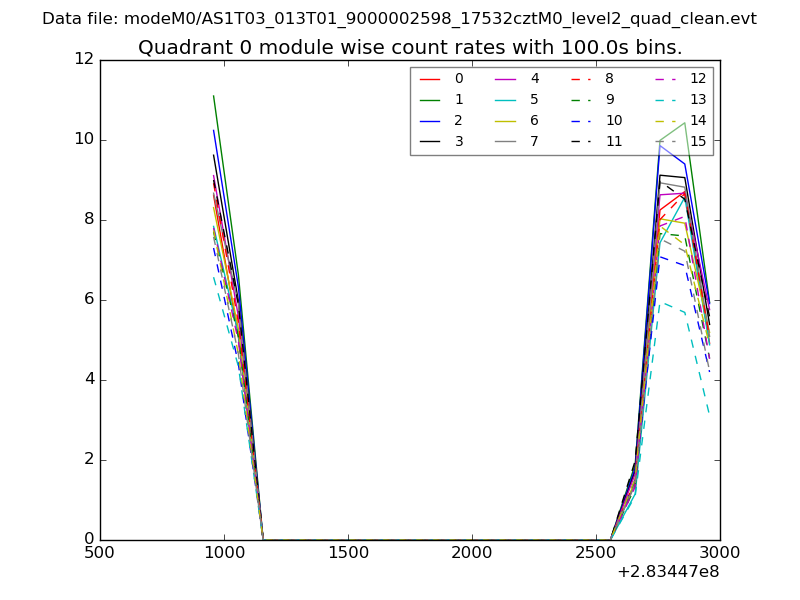 |
 |
| Module-wise count rates for Quadrant B Data is divided into 100 sec bins |
 |
 |
| Module-wise count rates for Quadrant C Data is divided into 100 sec bins |
 |
 |
| Module-wise count rates for Quadrant D Data is divided into 100 sec bins |
 |
 |
| Parameter | Plot |
|---|---|
| CZT HV Monitor | 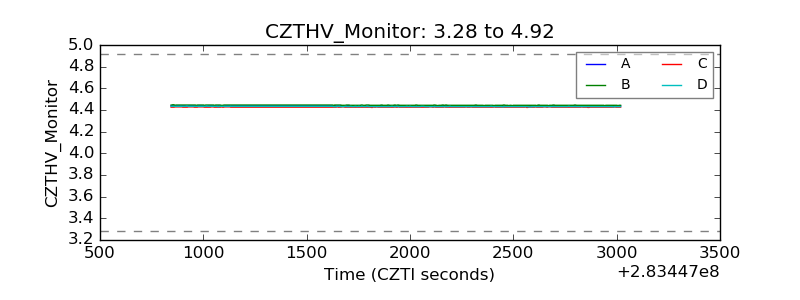 |
| D_VDD | 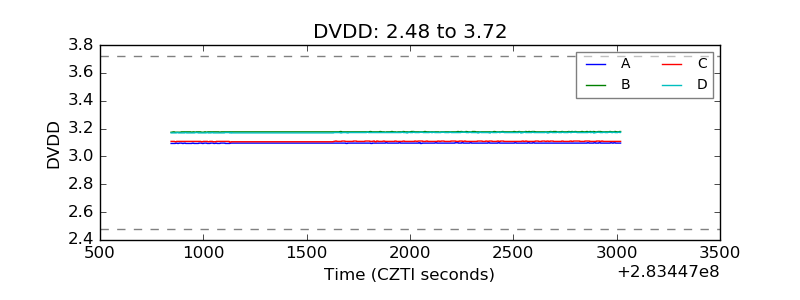 |
| Temperature 1 | 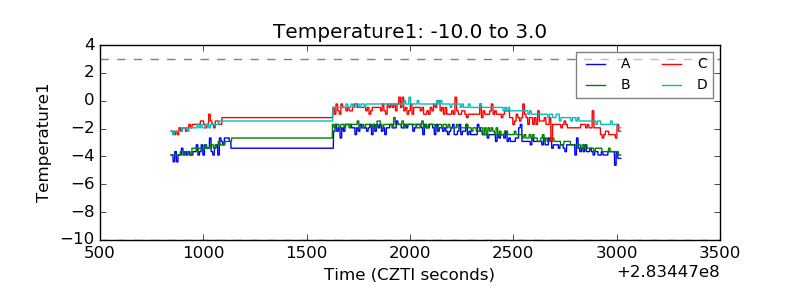 |
| Veto HV Monitor | 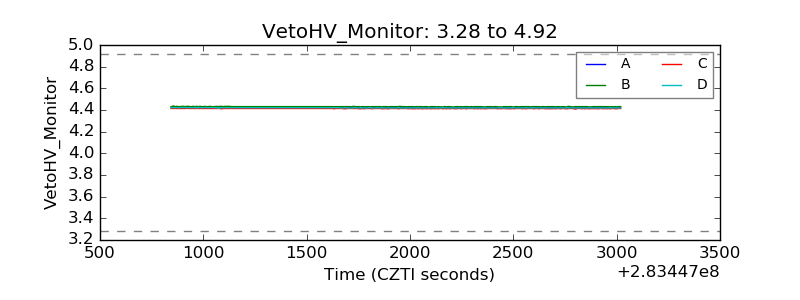 |
| Veto LLD |  |
| Alpha Counter | 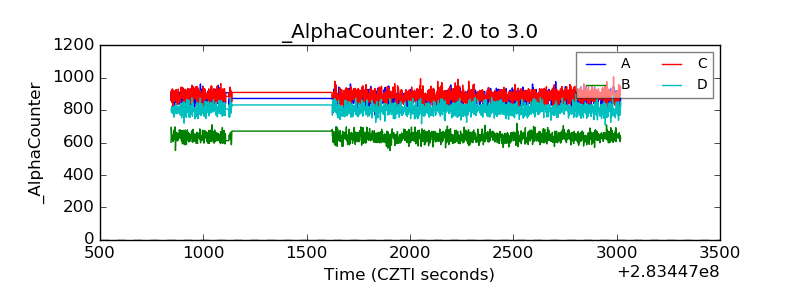 |
| _CPM_Rate | 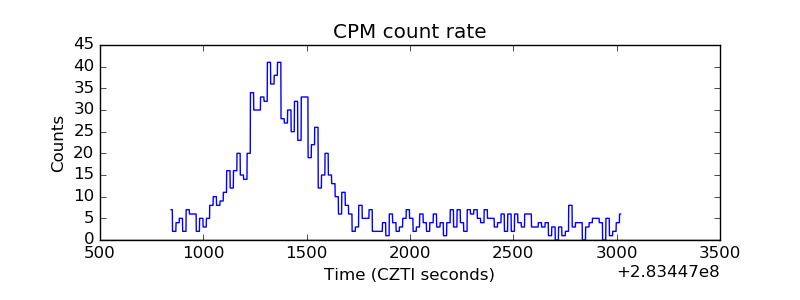 |
| CZT Counter | 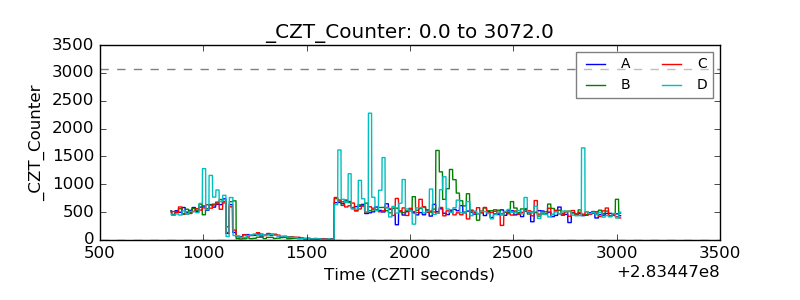 |
| +2.5 Volts monitor |  |
| +5 Volts monitor |  |
| _ROLL_ROT |  |
| _Roll_DEC | 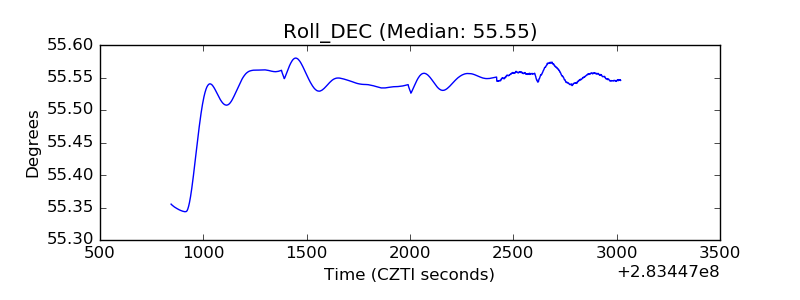 |
| _Roll_RA | 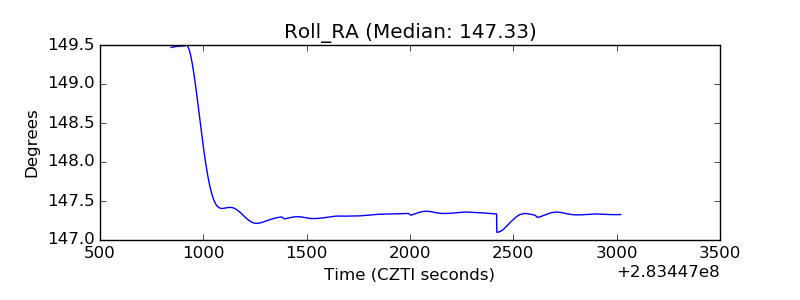 |
| Veto Counter |  |