| Param | Original file | Final file |
|---|---|---|
| Filename | modeM0/AS1T03_013T01_9000002598_17533cztM0_level2.evt | modeM0/AS1T03_013T01_9000002598_17533cztM0_level2_quad_clean.evt |
| Size (bytes) | 560,491,200 | 101,361,600 |
| Size | 534.5 MB | 96.7 MB |
| Events in quadrant A | 4,251,121 | 653,779 |
| Events in quadrant B | 4,067,792 | 647,152 |
| Events in quadrant C | 3,631,551 | 625,166 |
| Events in quadrant D | 4,509,335 | 615,997 |
| Mode M9 | |||
|---|---|---|---|
| Quadrant | BADHDUFLAG | Total packets | Discarded packets |
| A | 0 | 5 | 0 |
| B | 0 | 6 | 0 |
| C | 0 | 6 | 0 |
| D | 0 | 6 | 0 |
| Mode M0 | |||
|---|---|---|---|
| Quadrant | BADHDUFLAG | Total packets | Discarded packets |
| A | 0 | 17707 | 2 |
| B | 0 | 17128 | 2 |
| C | 0 | 15650 | 2 |
| D | 0 | 18717 | 2 |
| Mode SS | |||
|---|---|---|---|
| Quadrant | BADHDUFLAG | Total packets | Discarded packets |
| A | 0 | 154 | 0 |
| B | 0 | 154 | 0 |
| C | 0 | 154 | 0 |
| D | 0 | 154 | 0 |
| Quadrant | Total seconds | Saturated seconds | Saturation percentage |
|---|---|---|---|
| A | 7580 | 362 | 4.775726% |
| B | 7580 | 175 | 2.308707% |
| C | 7580 | 148 | 1.952507% |
| D | 7579 | 322 | 4.248582% |
Noise dominated data is calculated using 1-second bins in cleaned event files. If a bin has >2000 counts, and if more than 50% of those come from <1% of pixels, then it is considered to be noise-dominated and hence unusable.
| Quadrant | # 1 sec bins | Bins with >0 counts | Bins with >2000 counts | High rate bins dominated by noise | Noise dominated (total time) | Noise dominated (detector-on time) | Marked lightcurve |
|---|---|---|---|---|---|---|---|
| A | 7800 | 7580 | 185 | 185 | 2.37% | 2.44% | 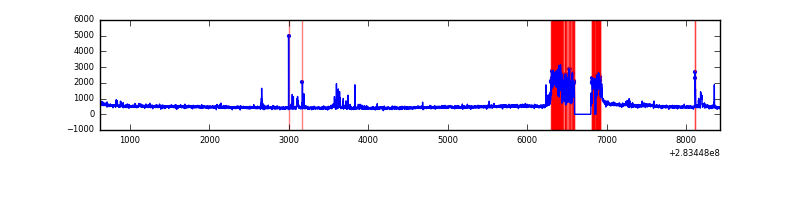 |
| B | 7800 | 7582 | 41 | 41 | 0.53% | 0.54% | 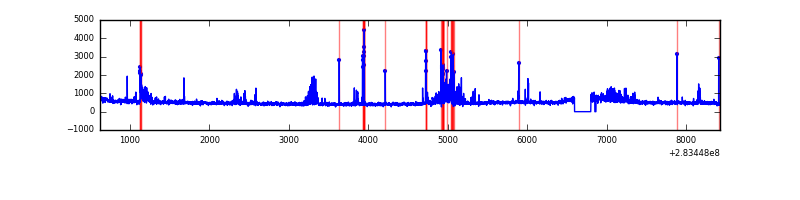 |
| C | 7800 | 7582 | 0 | 0 | 0.00% | 0.00% | 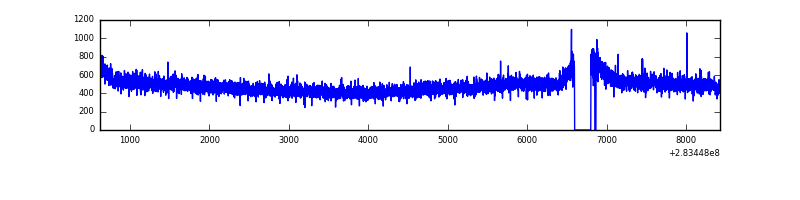 |
| D | 7799 | 7581 | 183 | 183 | 2.35% | 2.41% | 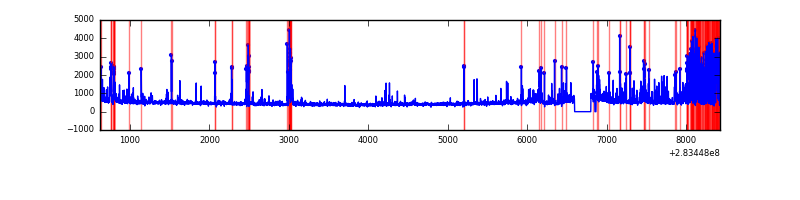 |
Top three noisy pixels from each quadrant. If the there are fewer than three noisy pixels in the level2.evt file, extra rows are filled as -1
| Pixel properties | Quadrant properties | ||||||
|---|---|---|---|---|---|---|---|
| Quadrant | DetID | PixID | Counts | Sigma | Mean | Median | Sigma |
| A | 14 | 237 | 737067 | 4075.01 | 898 | 880 | 180.7 |
| A | 15 | 174 | 53362 | 290.5 | 898 | 880 | 180.7 |
| A | 0 | 226 | 7992 | 39.37 | 898 | 880 | 180.7 |
| B | 4 | 48 | 225379 | 1300.12 | 908 | 886 | 172.7 |
| B | 4 | 216 | 77416 | 443.21 | 908 | 886 | 172.7 |
| B | 7 | 220 | 68595 | 392.12 | 908 | 886 | 172.7 |
| C | 14 | 238 | 133733 | 647.46 | 873 | 878 | 205.2 |
| C | 3 | 233 | 70078 | 337.24 | 873 | 878 | 205.2 |
| C | 5 | 218 | 18134 | 84.1 | 873 | 878 | 205.2 |
| D | 13 | 168 | 633127 | 2950.0 | 880 | 852 | 214.3 |
| D | 13 | 189 | 258909 | 1204.01 | 880 | 852 | 214.3 |
| D | 5 | 222 | 75847 | 349.9 | 880 | 852 | 214.3 |
Histogram calculated using DETX and DETY for each event in the final _common_clean file
| Quadrant A |  |
 |
Quadrant B |
|---|---|---|---|
| Quadrant D |  |
 |
Quadrant C |
| Plot type | Count rate plots | Images |
|---|---|---|
| Comparison with Poisson distribution Blue bars denote a histogram of data divided into 1 sec bins. Red curve is a Poisson curve with rate = median count rate of data. |
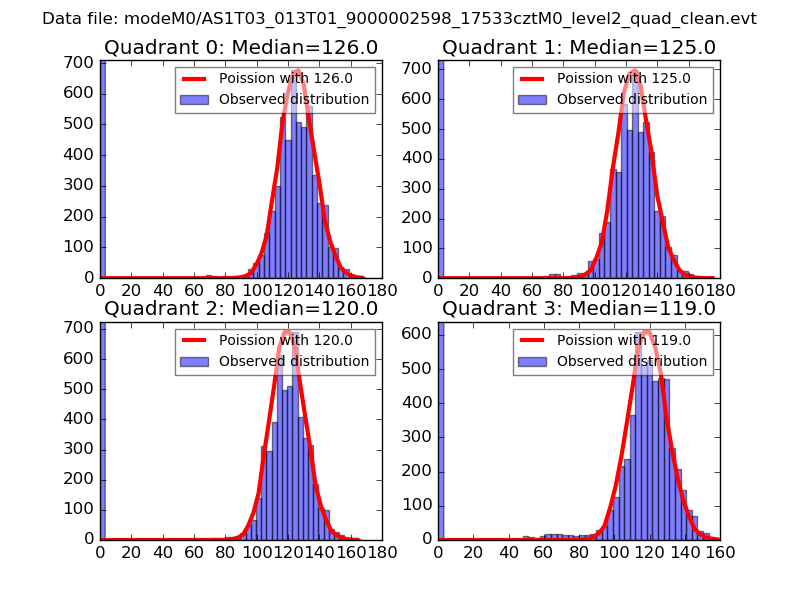 |
 |
| Quadrant-wise count rates Data is divided into 100 sec bins |
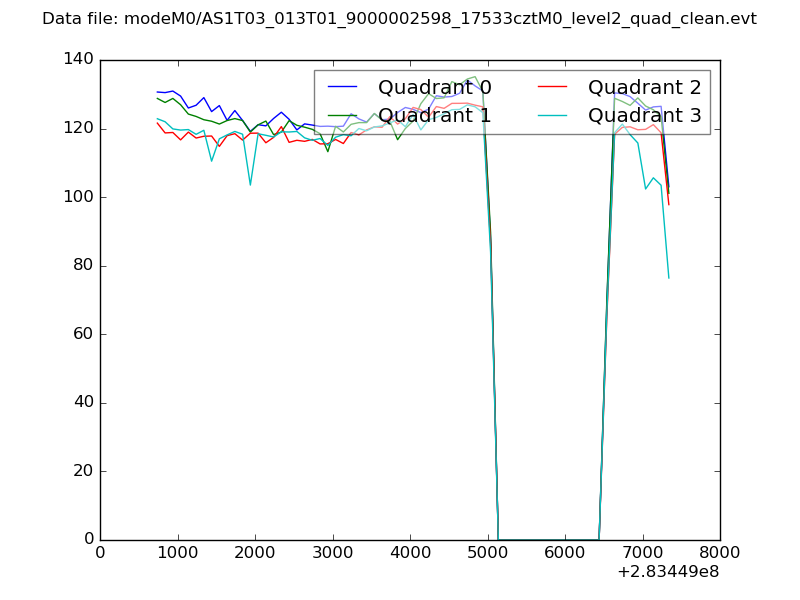 |
|
| Module-wise count rates for Quadrant A Data is divided into 100 sec bins |
 |
 |
| Module-wise count rates for Quadrant B Data is divided into 100 sec bins |
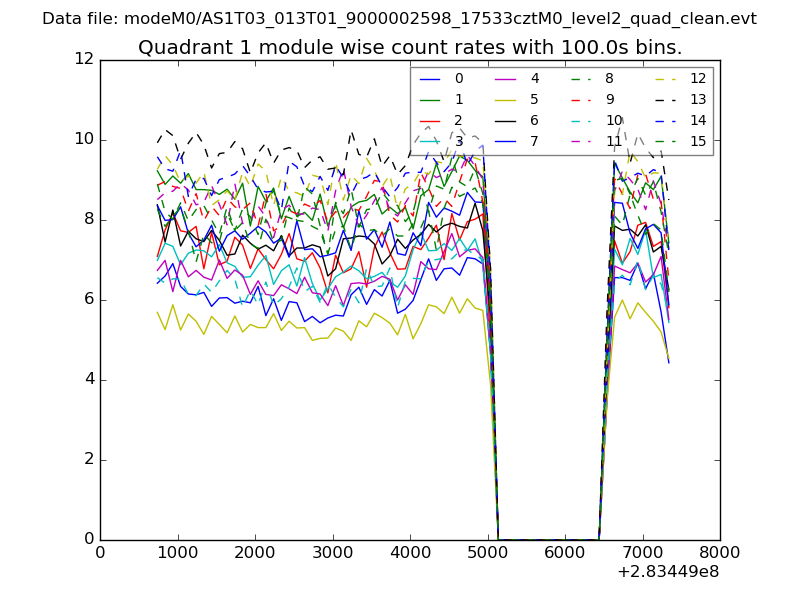 |
 |
| Module-wise count rates for Quadrant C Data is divided into 100 sec bins |
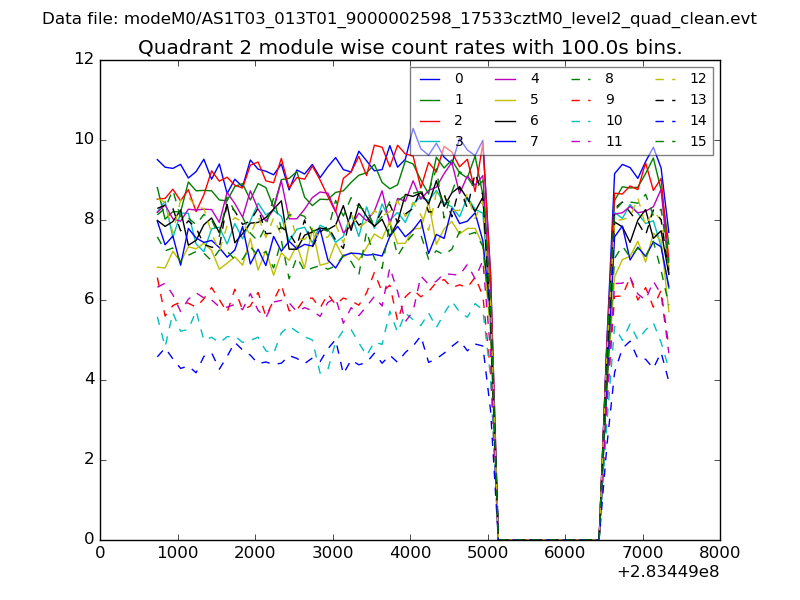 |
 |
| Module-wise count rates for Quadrant D Data is divided into 100 sec bins |
 |
 |
| Parameter | Plot |
|---|---|
| CZT HV Monitor | 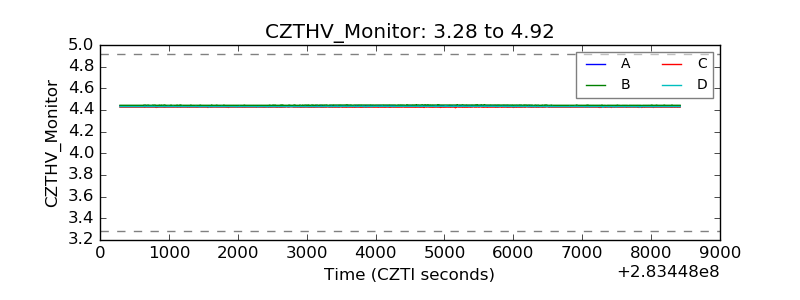 |
| D_VDD |  |
| Temperature 1 |  |
| Veto HV Monitor |  |
| Veto LLD |  |
| Alpha Counter | 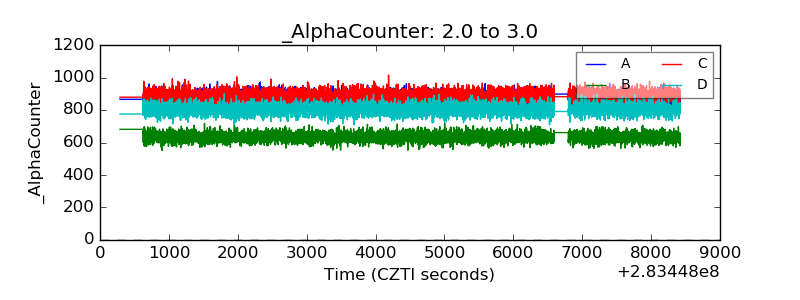 |
| _CPM_Rate | 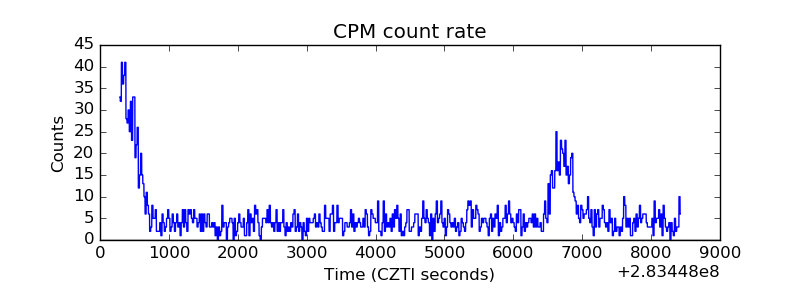 |
| CZT Counter |  |
| +2.5 Volts monitor |  |
| +5 Volts monitor |  |
| _ROLL_ROT |  |
| _Roll_DEC |  |
| _Roll_RA |  |
| Veto Counter |  |