| Param | Original file | Final file |
|---|---|---|
| Filename | modeM0/AS1T03_013T01_9000002598_17534cztM0_level2.evt | modeM0/AS1T03_013T01_9000002598_17534cztM0_level2_quad_clean.evt |
| Size (bytes) | 640,581,120 | 106,891,200 |
| Size | 610.9 MB | 101.9 MB |
| Events in quadrant A | 5,838,073 | 680,944 |
| Events in quadrant B | 3,943,801 | 691,060 |
| Events in quadrant C | 3,833,564 | 665,970 |
| Events in quadrant D | 5,249,435 | 650,329 |
| Mode M9 | |||
|---|---|---|---|
| Quadrant | BADHDUFLAG | Total packets | Discarded packets |
| A | 0 | 6 | 0 |
| B | 0 | 6 | 0 |
| C | 0 | 6 | 0 |
| D | 0 | 6 | 0 |
| Mode M0 | |||
|---|---|---|---|
| Quadrant | BADHDUFLAG | Total packets | Discarded packets |
| A | 0 | 22625 | 3 |
| B | 0 | 17015 | 2 |
| C | 0 | 16430 | 2 |
| D | 0 | 21213 | 2 |
| Mode SS | |||
|---|---|---|---|
| Quadrant | BADHDUFLAG | Total packets | Discarded packets |
| A | 0 | 160 | 0 |
| B | 0 | 160 | 0 |
| C | 0 | 160 | 0 |
| D | 0 | 160 | 0 |
| Quadrant | Total seconds | Saturated seconds | Saturation percentage |
|---|---|---|---|
| A | 7900 | 859 | 10.873418% |
| B | 7901 | 171 | 2.164283% |
| C | 7901 | 191 | 2.417416% |
| D | 7901 | 378 | 4.784205% |
Noise dominated data is calculated using 1-second bins in cleaned event files. If a bin has >2000 counts, and if more than 50% of those come from <1% of pixels, then it is considered to be noise-dominated and hence unusable.
| Quadrant | # 1 sec bins | Bins with >0 counts | Bins with >2000 counts | High rate bins dominated by noise | Noise dominated (total time) | Noise dominated (detector-on time) | Marked lightcurve |
|---|---|---|---|---|---|---|---|
| A | 8475 | 7901 | 471 | 471 | 5.56% | 5.96% | 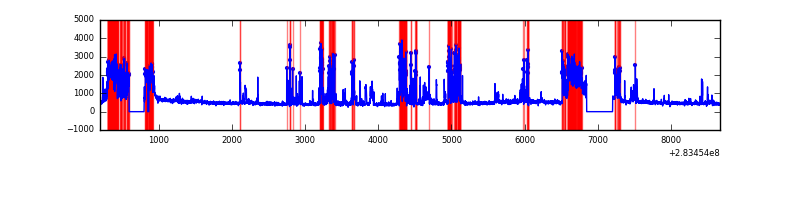 |
| B | 8476 | 7904 | 3 | 3 | 0.04% | 0.04% | 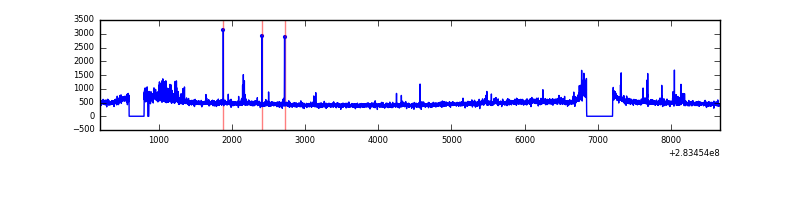 |
| C | 8476 | 7903 | 0 | 0 | 0.00% | 0.00% | 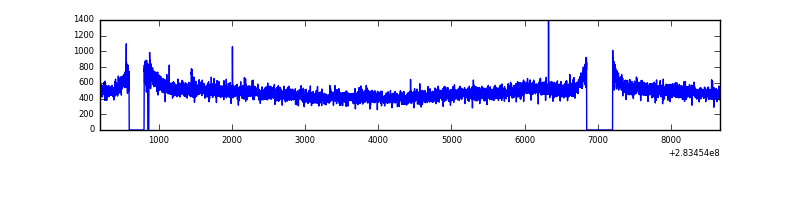 |
| D | 8476 | 7904 | 225 | 225 | 2.65% | 2.85% | 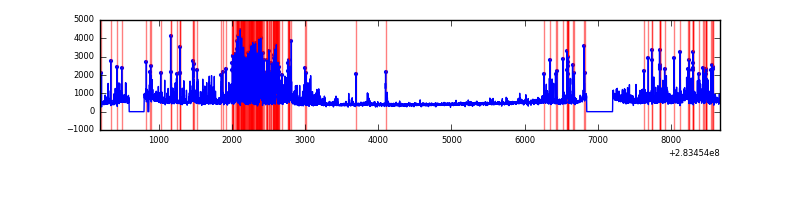 |
Top three noisy pixels from each quadrant. If the there are fewer than three noisy pixels in the level2.evt file, extra rows are filled as -1
| Pixel properties | Quadrant properties | ||||||
|---|---|---|---|---|---|---|---|
| Quadrant | DetID | PixID | Counts | Sigma | Mean | Median | Sigma |
| A | 14 | 237 | 2171926 | 11735.56 | 916 | 895 | 185.0 |
| A | 15 | 174 | 128293 | 688.65 | 916 | 895 | 185.0 |
| A | 13 | 210 | 14690 | 74.57 | 916 | 895 | 185.0 |
| B | 7 | 220 | 87303 | 474.91 | 954 | 930 | 181.9 |
| B | 0 | 197 | 23292 | 122.95 | 954 | 930 | 181.9 |
| B | 10 | 245 | 22524 | 118.73 | 954 | 930 | 181.9 |
| C | 14 | 238 | 139135 | 641.89 | 915 | 915 | 215.3 |
| C | 3 | 233 | 109059 | 502.22 | 915 | 915 | 215.3 |
| C | 13 | 61 | 6707 | 26.9 | 915 | 915 | 215.3 |
| D | 13 | 168 | 1004798 | 4494.32 | 922 | 893 | 223.4 |
| D | 13 | 189 | 360333 | 1609.15 | 922 | 893 | 223.4 |
| D | 4 | 239 | 167596 | 746.3 | 922 | 893 | 223.4 |
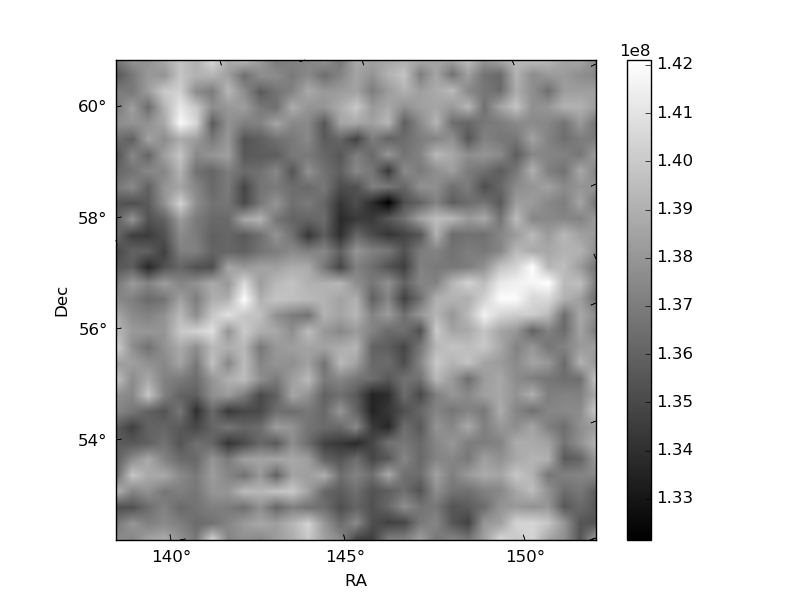
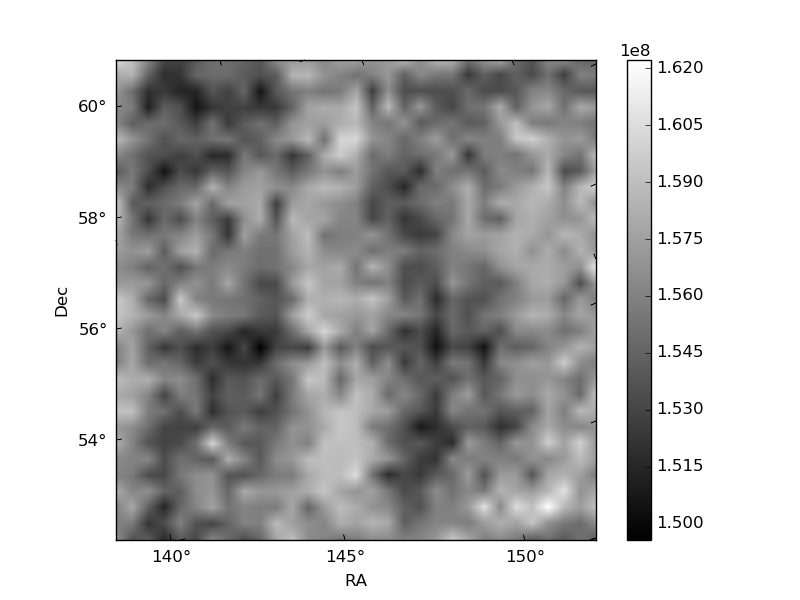
Histogram calculated using DETX and DETY for each event in the final _common_clean file
| Quadrant A | 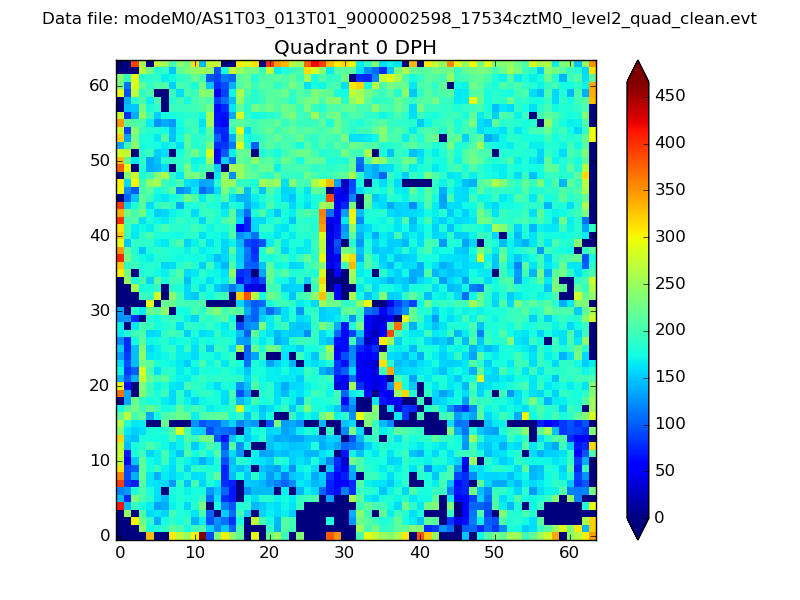 |
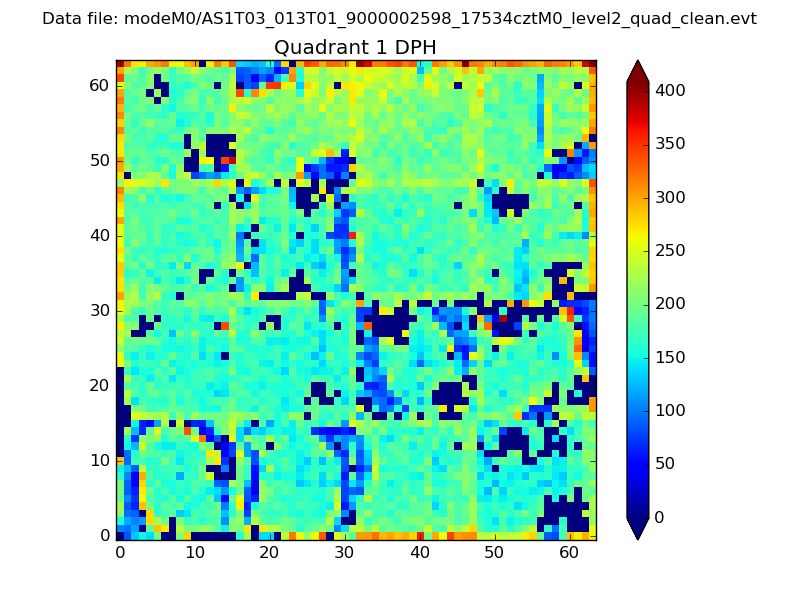 |
Quadrant B |
|---|---|---|---|
| Quadrant D | 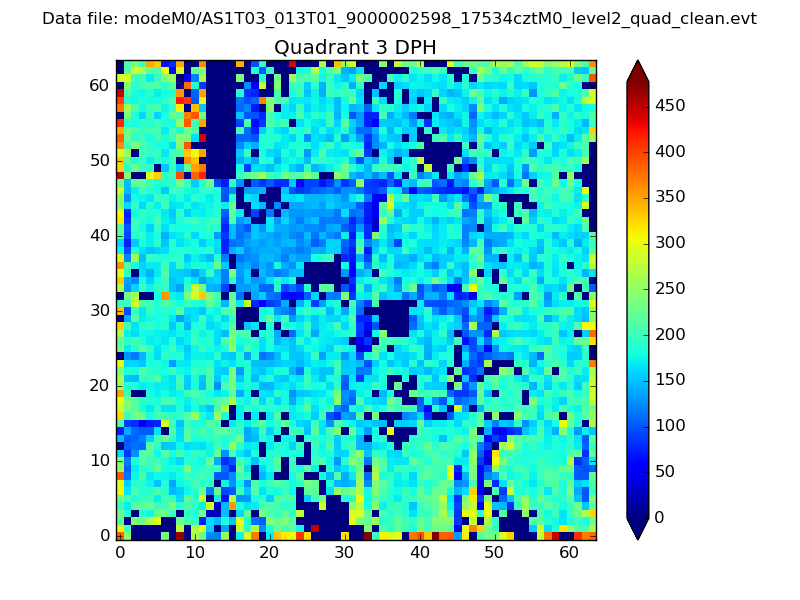 |
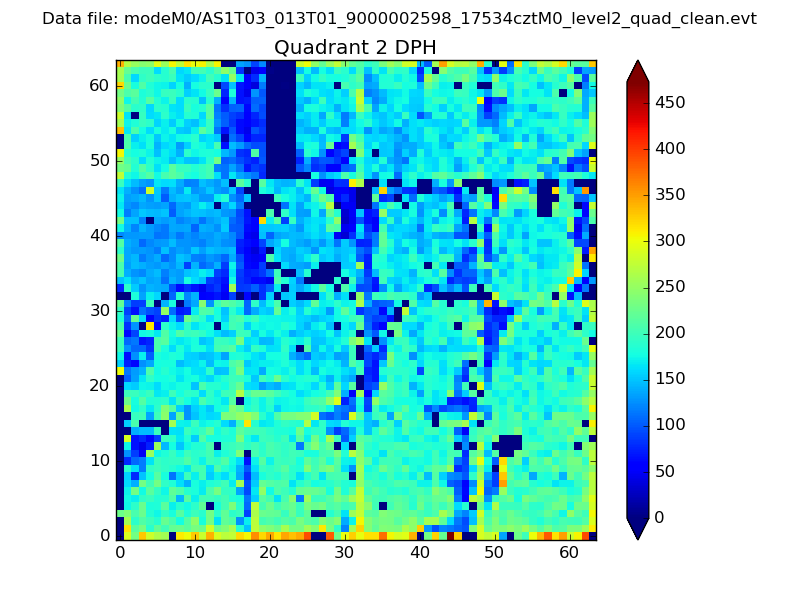 |
Quadrant C |
| Plot type | Count rate plots | Images |
|---|---|---|
| Comparison with Poisson distribution Blue bars denote a histogram of data divided into 1 sec bins. Red curve is a Poisson curve with rate = median count rate of data. |
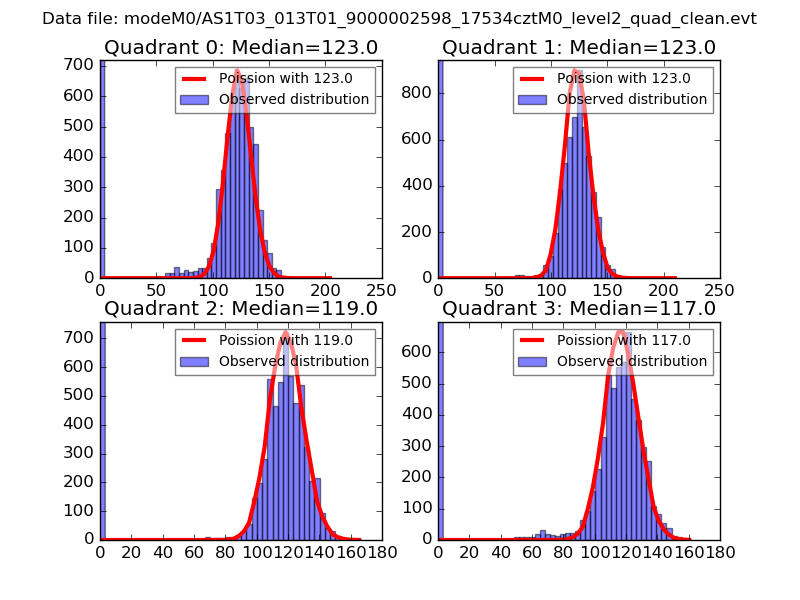 |
 |
| Quadrant-wise count rates Data is divided into 100 sec bins |
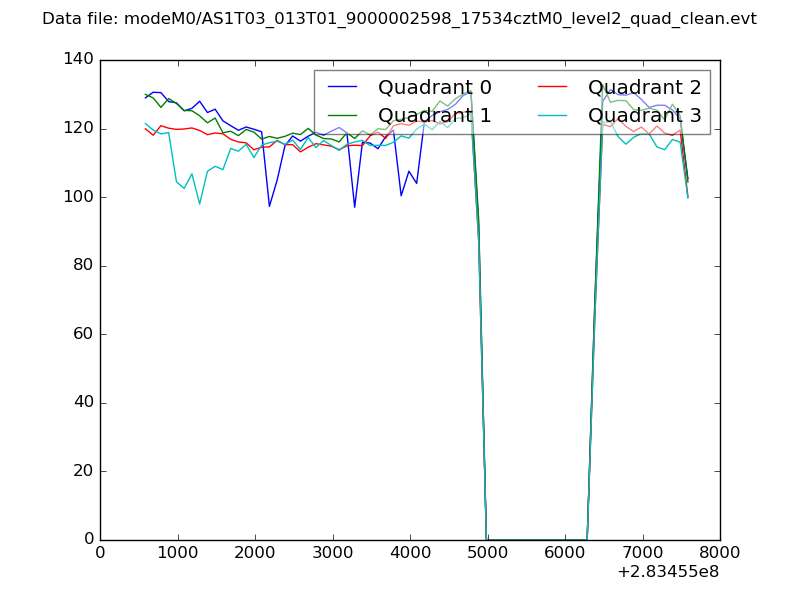 |
|
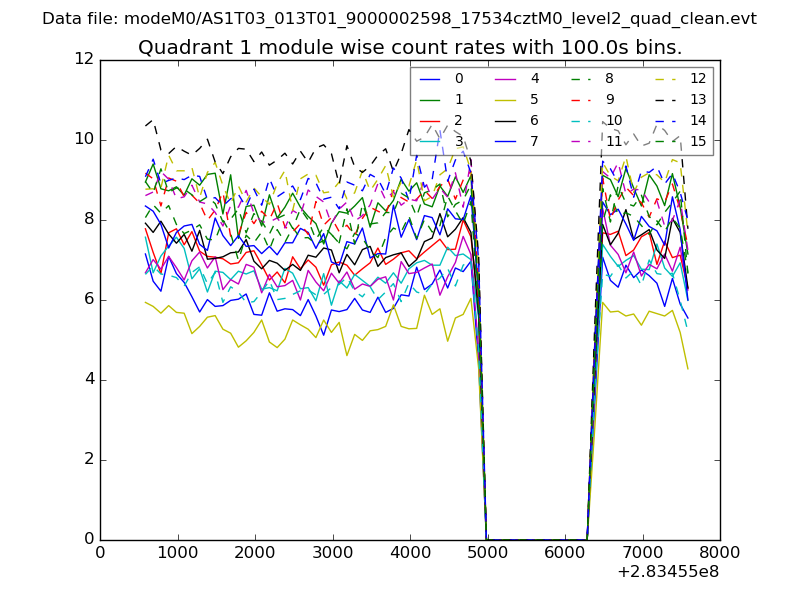
| Module-wise count rates for Quadrant A Data is divided into 100 sec bins |
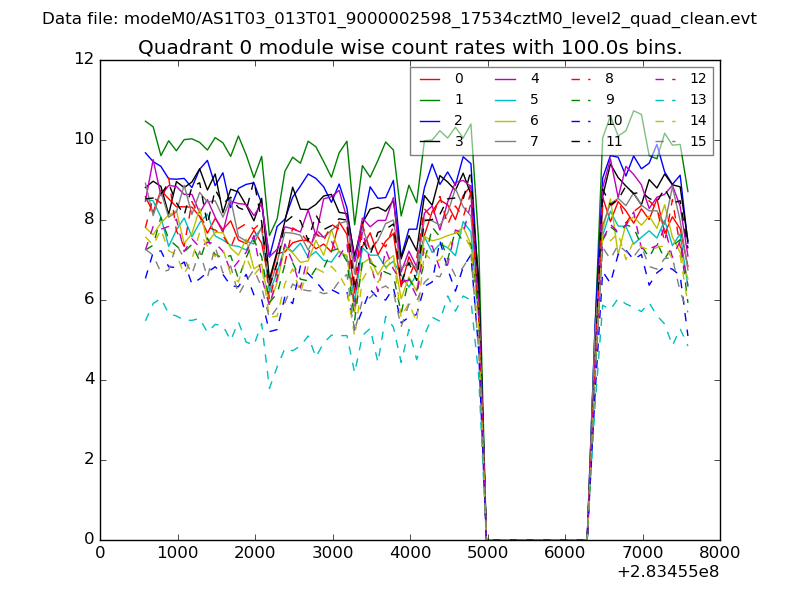 |
 |
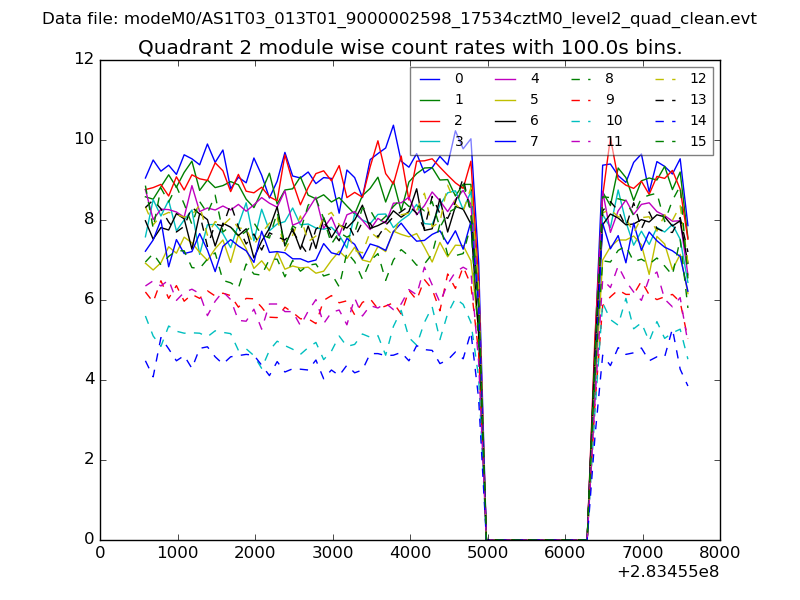
| Module-wise count rates for Quadrant B Data is divided into 100 sec bins |
 |
 |
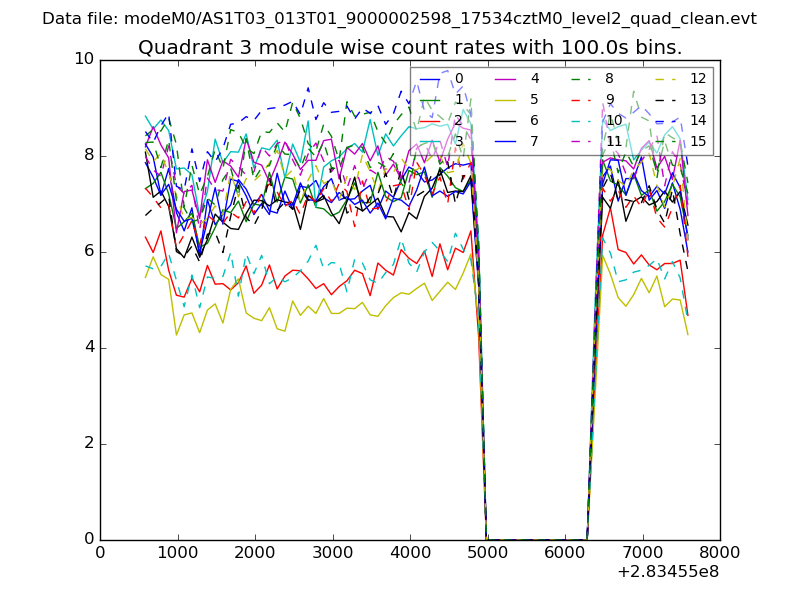
| Module-wise count rates for Quadrant C Data is divided into 100 sec bins |
 |
 |
| Module-wise count rates for Quadrant D Data is divided into 100 sec bins |
 |
 |
| Parameter | Plot |
|---|---|
| CZT HV Monitor | 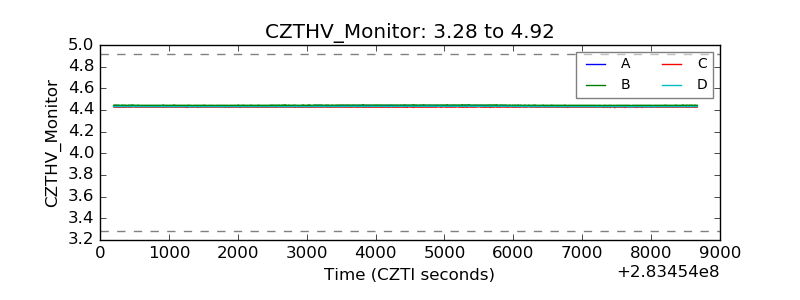 |
| D_VDD | 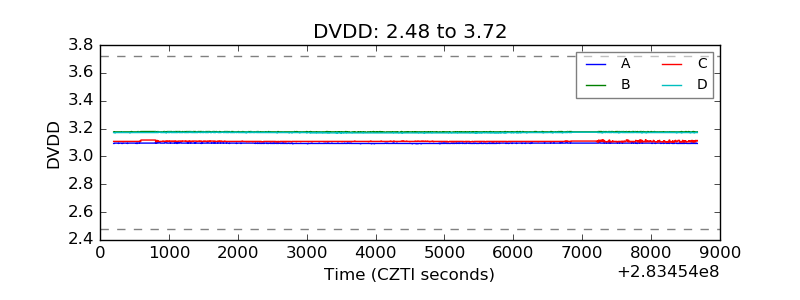 |
| Temperature 1 |  |
| Veto HV Monitor | 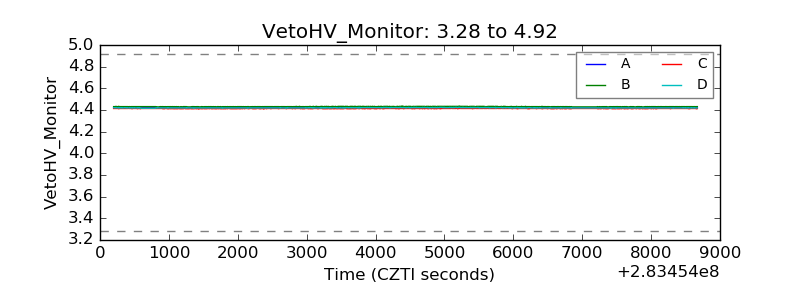 |
| Veto LLD | 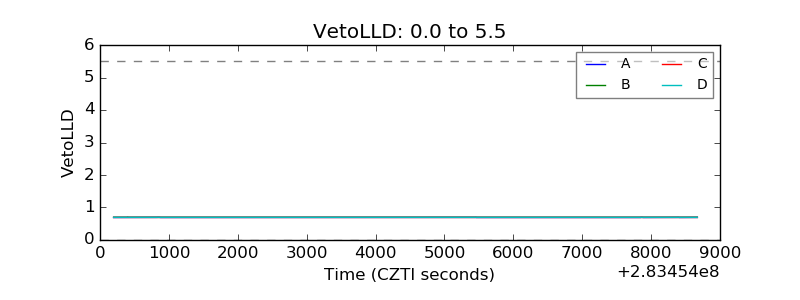 |
| Alpha Counter | 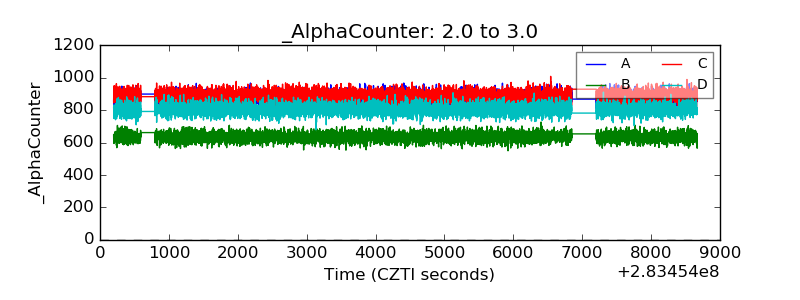 |
| _CPM_Rate | 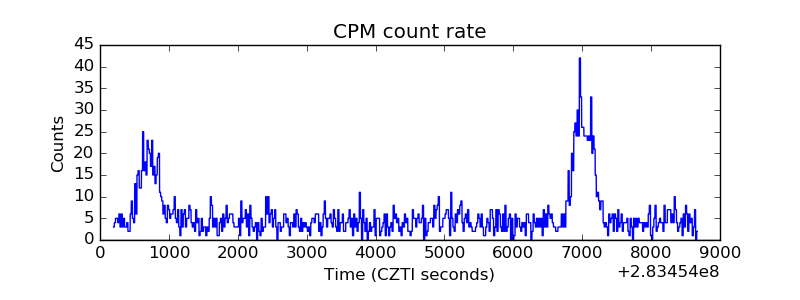 |
| CZT Counter |  |
| +2.5 Volts monitor |  |
| +5 Volts monitor | 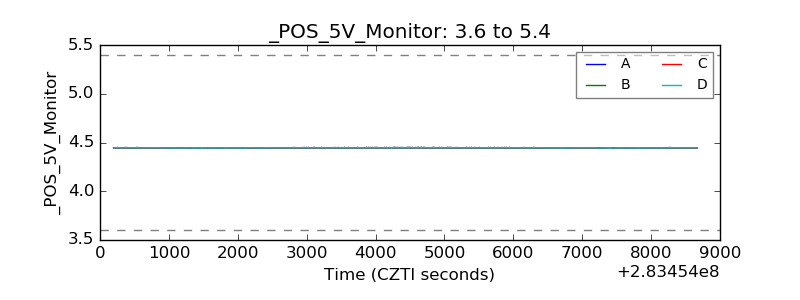 |
| _ROLL_ROT | 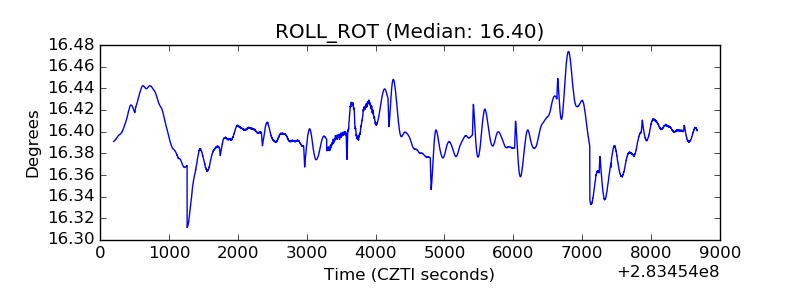 |
| _Roll_DEC | 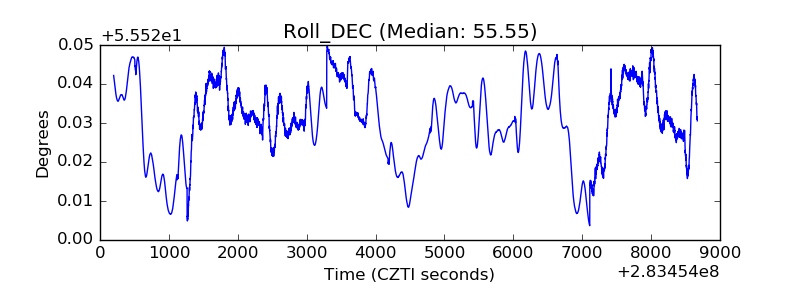 |
| _Roll_RA |  |
| Veto Counter | 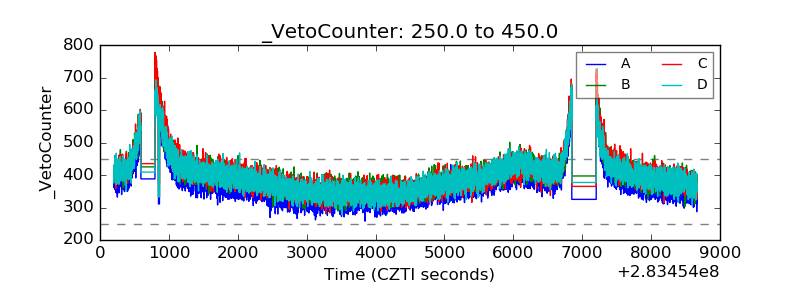 |