| Param | Original file | Final file |
|---|---|---|
| Filename | modeM0/AS1T03_066T01_9000002600cztM0_level2.fits | modeM0/AS1T03_066T01_9000002600cztM0_level2_quad_clean.evt |
| Size (bytes) | 1,100,730,240 | 905,071,680 |
| Size | 1.0 GB | 863.1 MB |
| Events in quadrant A | 6,663,110 | 5,109,891 |
| Events in quadrant B | 6,481,534 | 4,998,055 |
| Events in quadrant C | 6,618,724 | 4,900,765 |
| Events in quadrant D | 5,711,978 | 4,545,027 |
| Mode M9 | |||
|---|---|---|---|
| Quadrant | BADHDUFLAG | Total packets | Discarded packets |
| A | 0 | 199 | 0 |
| B | 0 | 199 | 0 |
| C | 0 | 199 | 0 |
| D | 0 | 199 | 0 |
| Mode SS | |||
|---|---|---|---|
| Quadrant | BADHDUFLAG | Total packets | Discarded packets |
| A | 0 | 2332 | 0 |
| B | 0 | 2332 | 0 |
| C | 0 | 2332 | 0 |
| D | 0 | 2332 | 0 |
| Mode M0 | |||
|---|---|---|---|
| Quadrant | BADHDUFLAG | Total packets | Discarded packets |
| A | 0 | 295746 | 0 |
| B | 0 | 259618 | 0 |
| C | 0 | 256318 | 0 |
| D | 0 | 270954 | 0 |
| Quadrant | Total seconds | Saturated seconds | Saturation percentage |
|---|---|---|---|
| A | 114627 | 6898 | 6.017779% |
| B | 114627 | 3817 | 3.329931% |
| C | 114627 | 2939 | 2.563968% |
| D | 114627 | 4343 | 3.788811% |
Noise dominated data is calculated using 1-second bins in cleaned event files. If a bin has >2000 counts, and if more than 50% of those come from <1% of pixels, then it is considered to be noise-dominated and hence unusable.
| Quadrant | # 1 sec bins | Bins with >0 counts | Bins with >2000 counts | High rate bins dominated by noise | Noise dominated (total time) | Noise dominated (detector-on time) | Marked lightcurve |
|---|---|---|---|---|---|---|---|
| A | 134393 | 114491 | 0 | 0 | 0.00% | 0.00% | 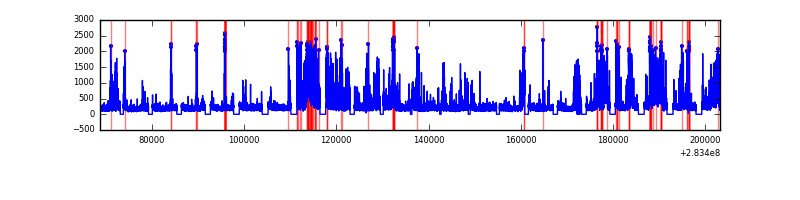 |
| B | 134393 | 114296 | 0 | 0 | 0.00% | 0.00% |  |
| C | 134393 | 114620 | 0 | 0 | 0.00% | 0.00% |  |
| D | 134393 | 113741 | 0 | 0 | 0.00% | 0.00% |  |
Top three noisy pixels from each quadrant. If the there are fewer than three noisy pixels in the level2.evt file, extra rows are filled as -1
| Pixel properties | Quadrant properties | ||||||
|---|---|---|---|---|---|---|---|
| Quadrant | DetID | PixID | Counts | Sigma | Mean | Median | Sigma |
| A | 0 | 29 | 5642 | 9.4 | 1734 | 1626 | 427.2 |
| A | 7 | 110 | 5391 | 8.81 | 1734 | 1626 | 427.2 |
| A | 9 | 19 | 5003 | 7.91 | 1734 | 1626 | 427.2 |
| B | 2 | 9 | 5361 | 11.08 | 1712 | 1632 | 336.5 |
| B | 2 | 8 | 4479 | 8.46 | 1712 | 1632 | 336.5 |
| B | 5 | 128 | 4273 | 7.85 | 1712 | 1632 | 336.5 |
| C | 12 | 241 | 4600 | 6.69 | 1749 | 1632 | 443.7 |
| C | 3 | 126 | 4470 | 6.4 | 1749 | 1632 | 443.7 |
| C | 2 | 191 | 4444 | 6.34 | 1749 | 1632 | 443.7 |
| D | 6 | 231 | 4111 | 6.02 | 1634 | 1487 | 436.1 |
| D | 3 | 14 | 4074 | 5.93 | 1634 | 1487 | 436.1 |
| D | 7 | 3 | 4044 | 5.86 | 1634 | 1487 | 436.1 |
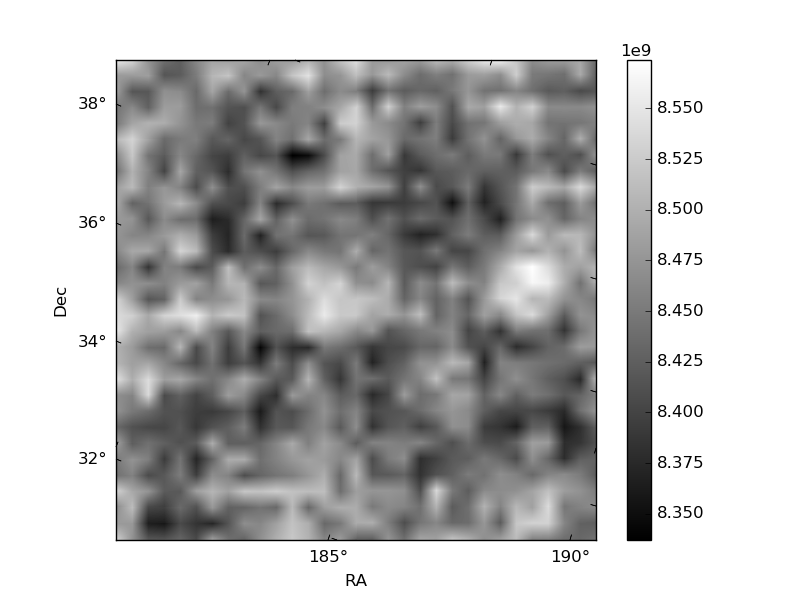
Histogram calculated using DETX and DETY for each event in the final _common_clean file
| Quadrant A | 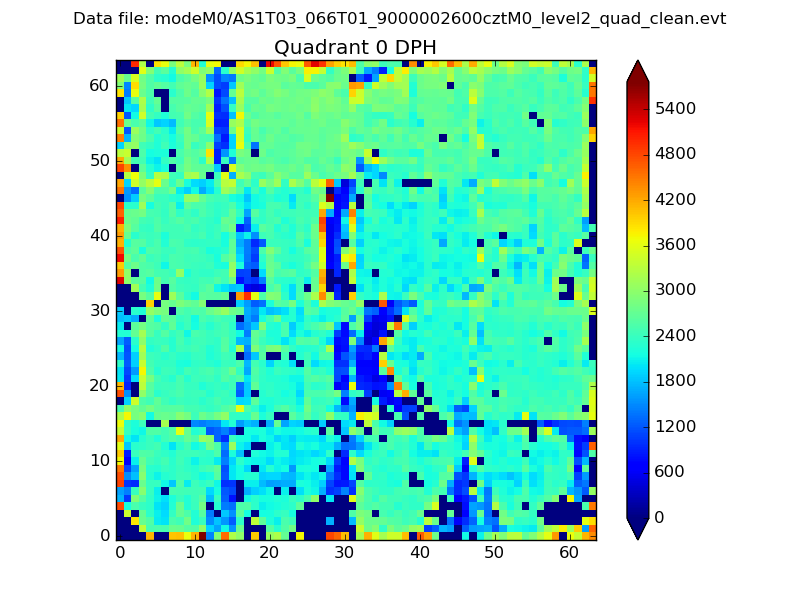 |
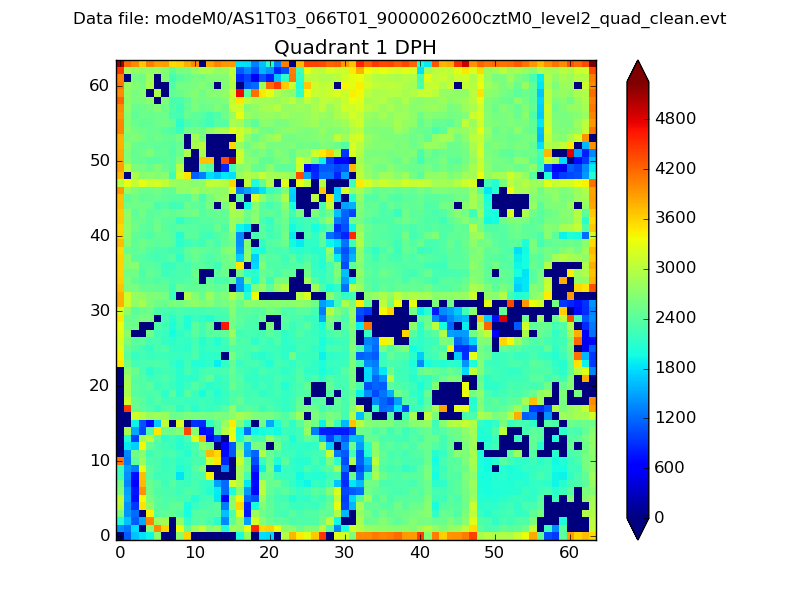 |
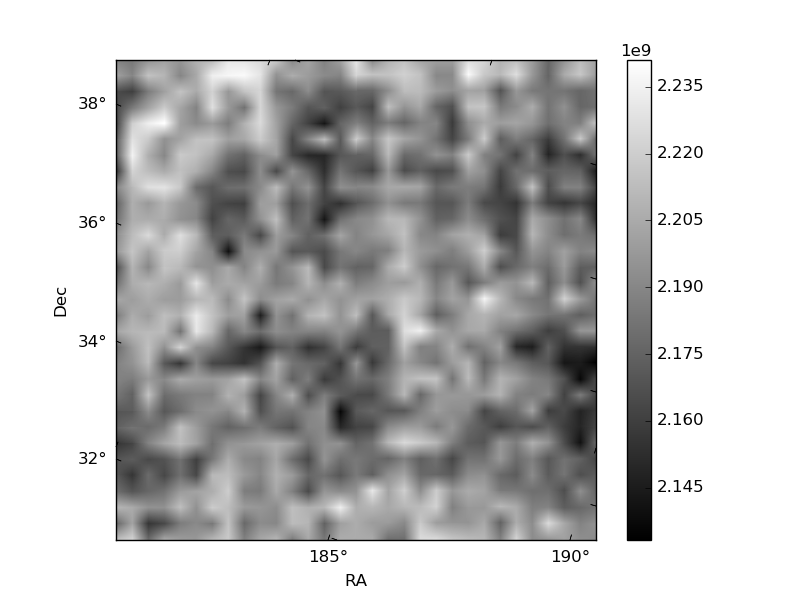
Quadrant B |
|---|---|---|---|
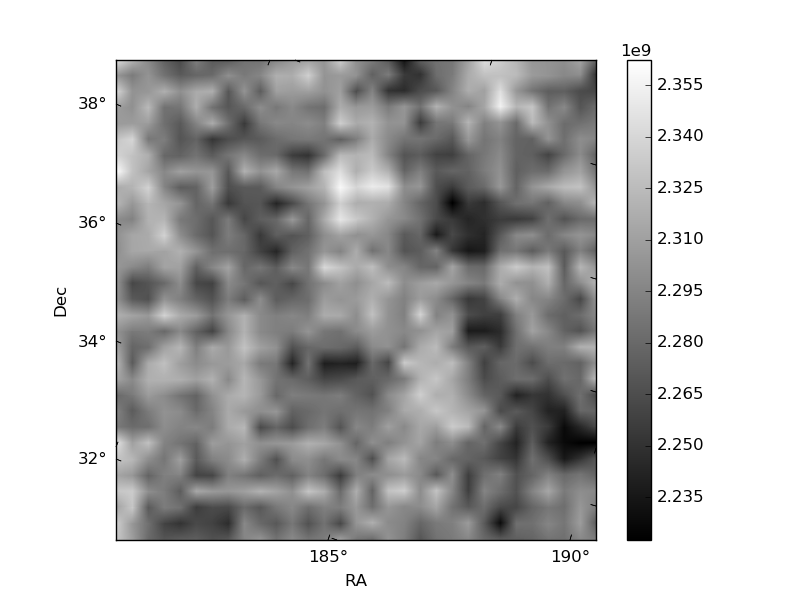
| Quadrant D |  |
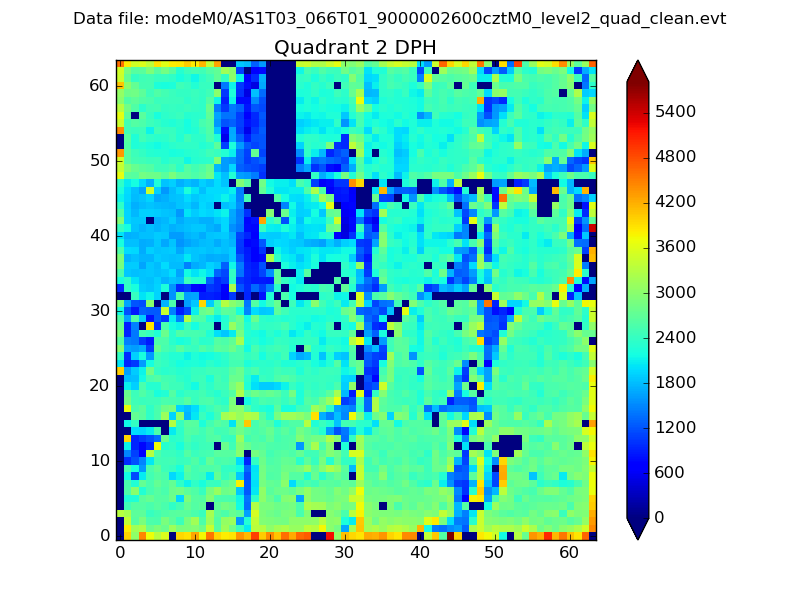 |
Quadrant C |
| Plot type | Count rate plots | Images |
|---|---|---|
| Comparison with Poisson distribution Blue bars denote a histogram of data divided into 1 sec bins. Red curve is a Poisson curve with rate = median count rate of data. |
 |
 |
| Quadrant-wise count rates Data is divided into 100 sec bins |
 |
|
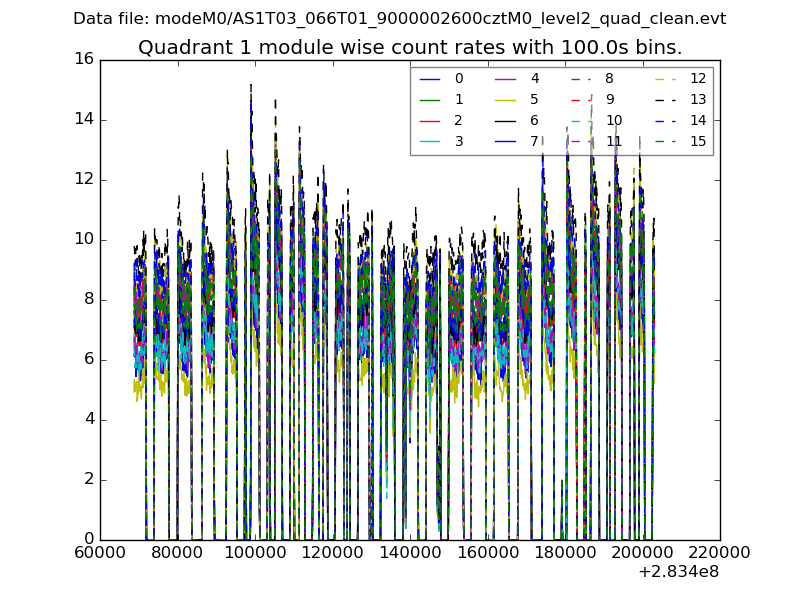
| Module-wise count rates for Quadrant A Data is divided into 100 sec bins |
 |
 |
| Module-wise count rates for Quadrant B Data is divided into 100 sec bins |
 |
 |
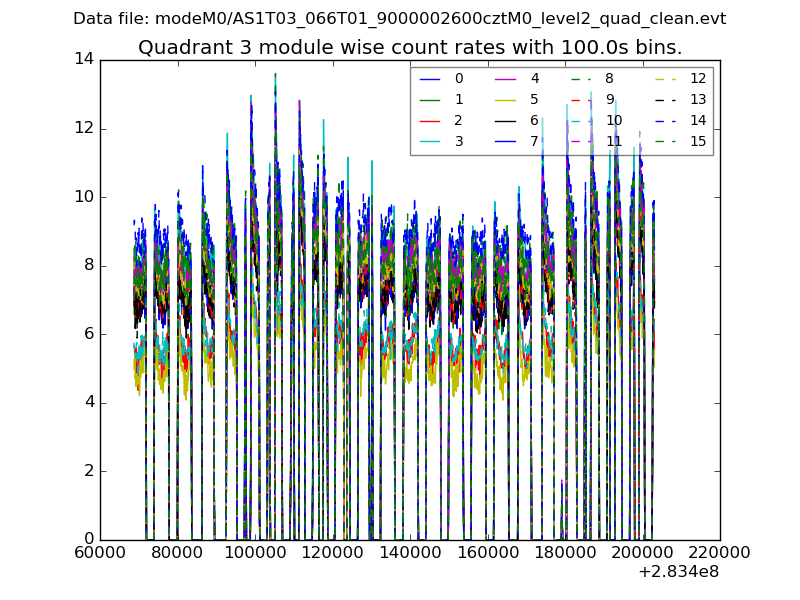
| Module-wise count rates for Quadrant C Data is divided into 100 sec bins |
 |
 |
| Module-wise count rates for Quadrant D Data is divided into 100 sec bins |
 |
 |
| Parameter | Plot |
|---|---|
| CZT HV Monitor |  |
| D_VDD | 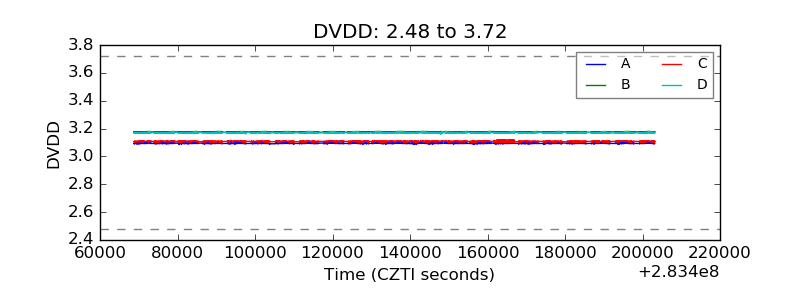 |
| Temperature 1 |  |
| Veto HV Monitor |  |
| Veto LLD | 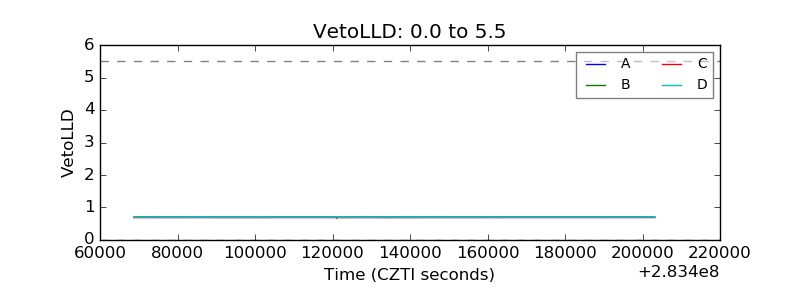 |
| Alpha Counter |  |
| _CPM_Rate | 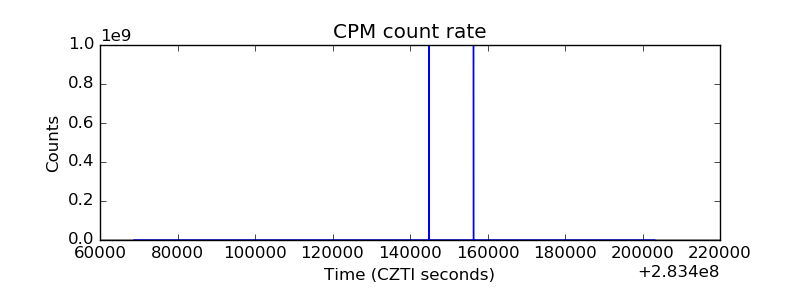 |
| CZT Counter | 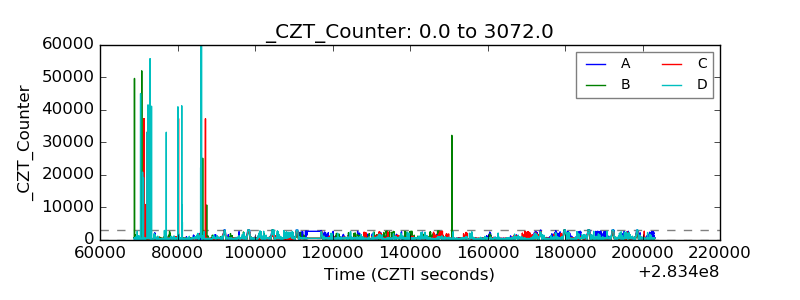 |
| +2.5 Volts monitor |  |
| +5 Volts monitor |  |
| _ROLL_ROT | 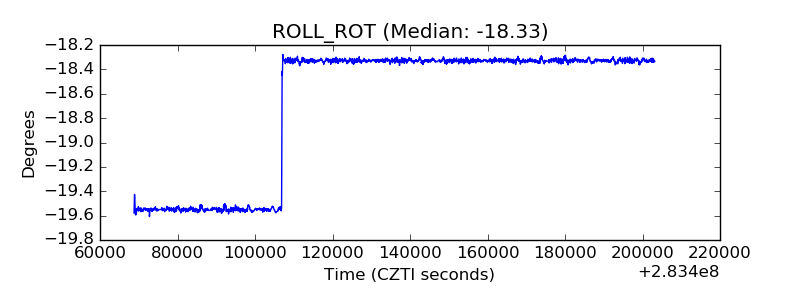 |
| _Roll_DEC | 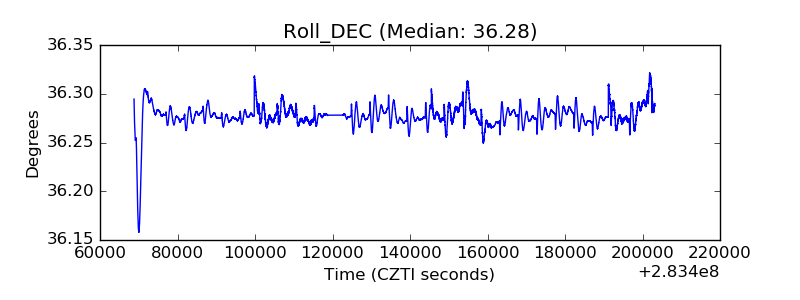 |
| _Roll_RA | 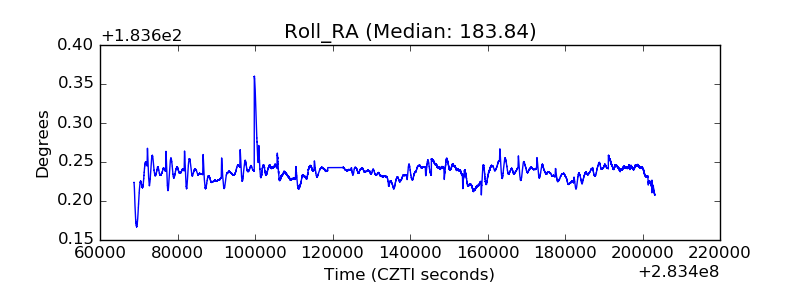 |
| Veto Counter |  |