| Param | Original file | Final file |
|---|---|---|
| Filename | modeM0/AS1T03_066T01_9000002600_17540cztM0_level2.evt | modeM0/AS1T03_066T01_9000002600_17540cztM0_level2_quad_clean.evt |
| Size (bytes) | 1,445,460,480 | 294,606,720 |
| Size | 1.3 GB | 281.0 MB |
| Events in quadrant A | 10,519,886 | 1,876,033 |
| Events in quadrant B | 10,960,452 | 1,906,258 |
| Events in quadrant C | 10,320,845 | 1,835,226 |
| Events in quadrant D | 10,496,109 | 1,800,655 |
| Mode M9 | |||
|---|---|---|---|
| Quadrant | BADHDUFLAG | Total packets | Discarded packets |
| A | 0 | 38 | 0 |
| B | 0 | 38 | 0 |
| C | 0 | 38 | 0 |
| D | 0 | 38 | 0 |
| Mode SS | |||
|---|---|---|---|
| Quadrant | BADHDUFLAG | Total packets | Discarded packets |
| A | 0 | 444 | 0 |
| B | 0 | 444 | 0 |
| C | 0 | 444 | 0 |
| D | 0 | 444 | 0 |
| Mode M0 | |||
|---|---|---|---|
| Quadrant | BADHDUFLAG | Total packets | Discarded packets |
| A | 0 | 46462 | 4 |
| B | 0 | 47221 | 4 |
| C | 0 | 45051 | 4 |
| D | 0 | 47320 | 5 |
| Quadrant | Total seconds | Saturated seconds | Saturation percentage |
|---|---|---|---|
| A | 21871 | 188 | 0.859586% |
| B | 21871 | 242 | 1.106488% |
| C | 21871 | 178 | 0.813863% |
| D | 21870 | 143 | 0.653864% |
Noise dominated data is calculated using 1-second bins in cleaned event files. If a bin has >2000 counts, and if more than 50% of those come from <1% of pixels, then it is considered to be noise-dominated and hence unusable.
| Quadrant | # 1 sec bins | Bins with >0 counts | Bins with >2000 counts | High rate bins dominated by noise | Noise dominated (total time) | Noise dominated (detector-on time) | Marked lightcurve |
|---|---|---|---|---|---|---|---|
| A | 25527 | 21875 | 76 | 76 | 0.30% | 0.35% | 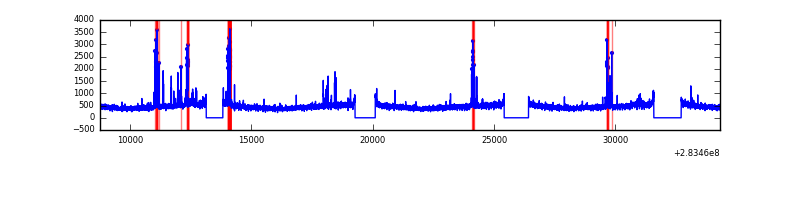 |
| B | 25527 | 21875 | 92 | 92 | 0.36% | 0.42% | 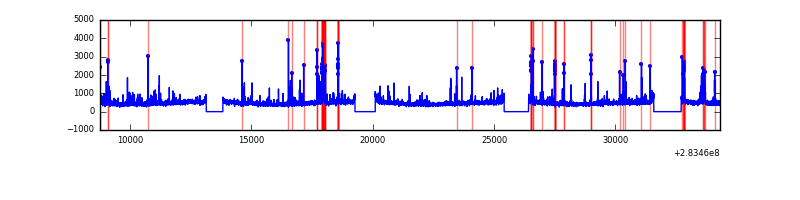 |
| C | 25527 | 21875 | 0 | 0 | 0.00% | 0.00% | 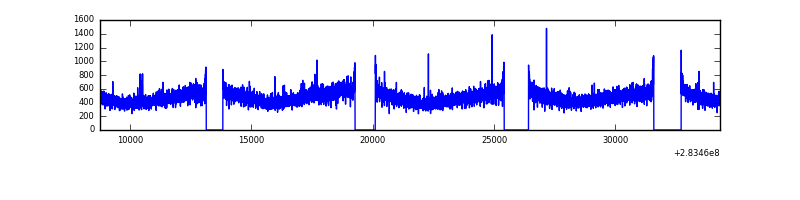 |
| D | 25526 | 21874 | 47 | 47 | 0.18% | 0.21% | 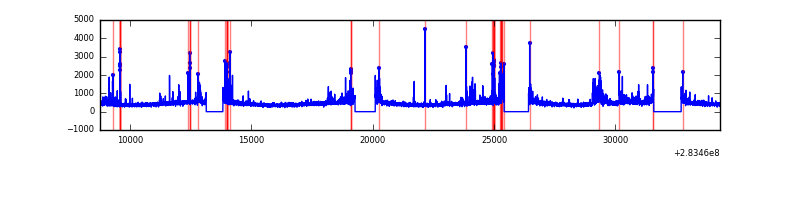 |
Top three noisy pixels from each quadrant. If the there are fewer than three noisy pixels in the level2.evt file, extra rows are filled as -1
| Pixel properties | Quadrant properties | ||||||
|---|---|---|---|---|---|---|---|
| Quadrant | DetID | PixID | Counts | Sigma | Mean | Median | Sigma |
| A | 14 | 237 | 594587 | 1155.01 | 2560 | 2509 | 512.6 |
| A | 15 | 174 | 93005 | 176.54 | 2560 | 2509 | 512.6 |
| A | 0 | 226 | 22371 | 38.75 | 2560 | 2509 | 512.6 |
| B | 10 | 245 | 783512 | 1628.6 | 2555 | 2497 | 479.6 |
| B | 15 | 222 | 121098 | 247.31 | 2555 | 2497 | 479.6 |
| B | 12 | 111 | 58785 | 117.37 | 2555 | 2497 | 479.6 |
| C | 14 | 238 | 383319 | 669.32 | 2455 | 2467 | 569.0 |
| C | 3 | 233 | 348270 | 607.73 | 2455 | 2467 | 569.0 |
| C | 13 | 61 | 17561 | 26.53 | 2455 | 2467 | 569.0 |
| D | 13 | 189 | 476983 | 791.73 | 2478 | 2405 | 599.4 |
| D | 5 | 222 | 430918 | 714.88 | 2478 | 2405 | 599.4 |
| D | 2 | 234 | 85622 | 138.83 | 2478 | 2405 | 599.4 |
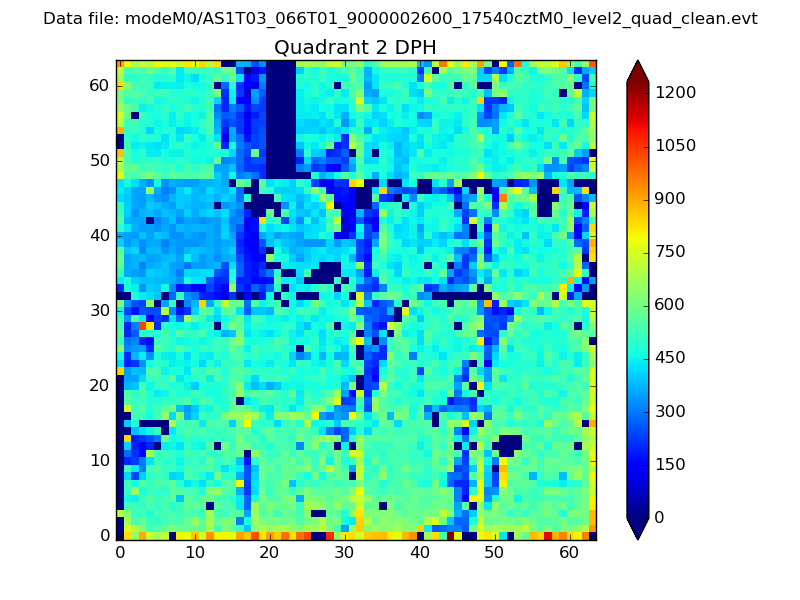
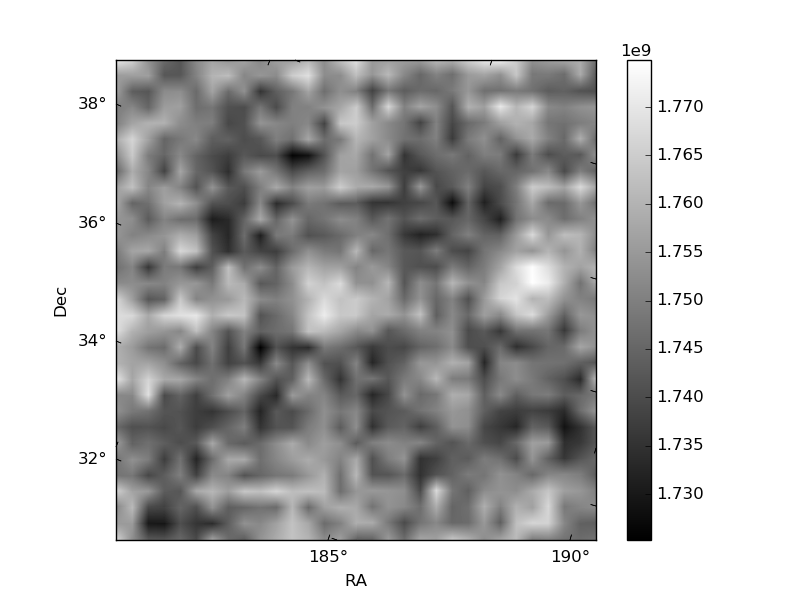
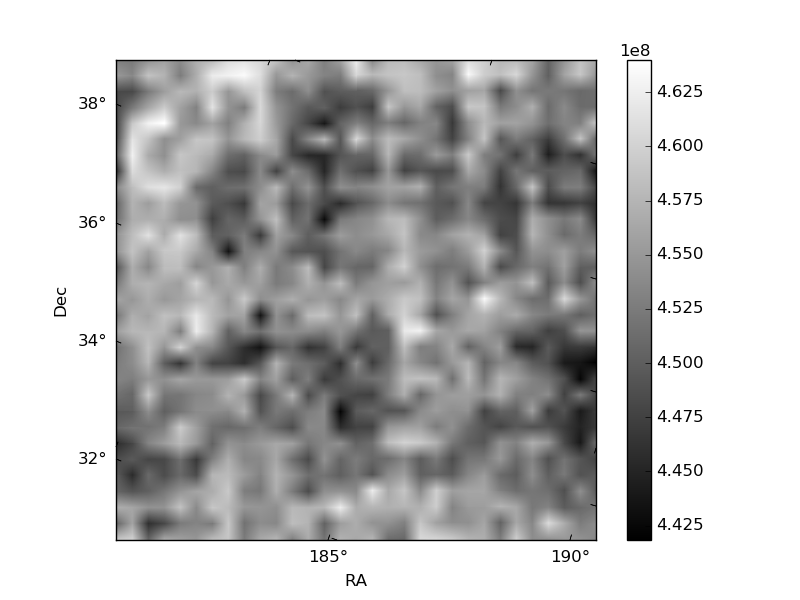
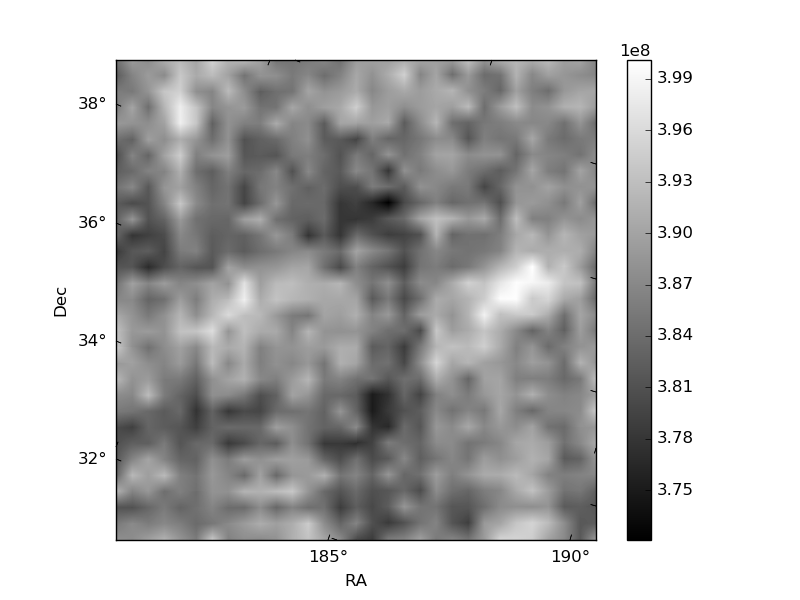
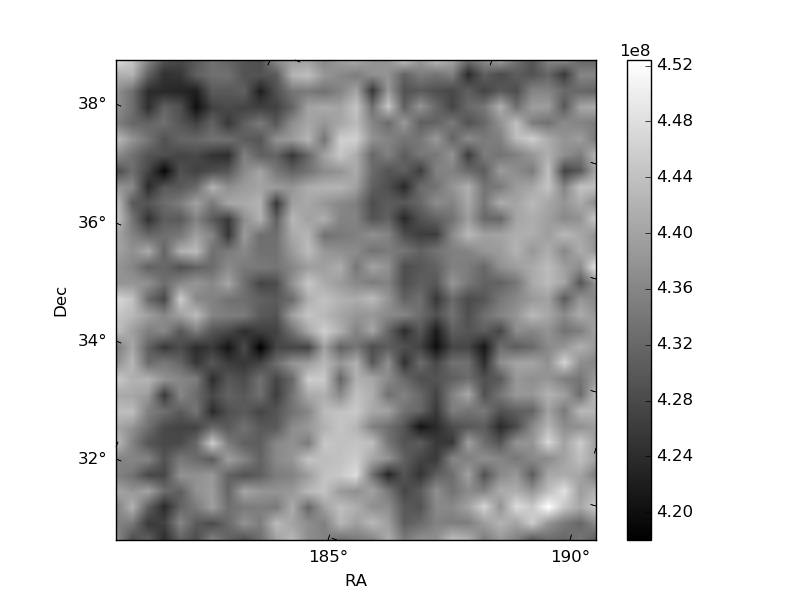
Histogram calculated using DETX and DETY for each event in the final _common_clean file
| Quadrant A | 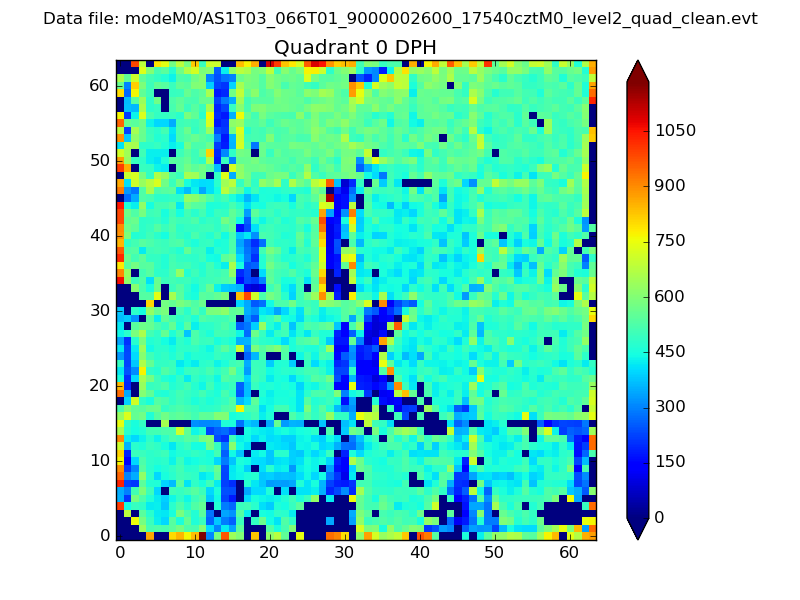 |
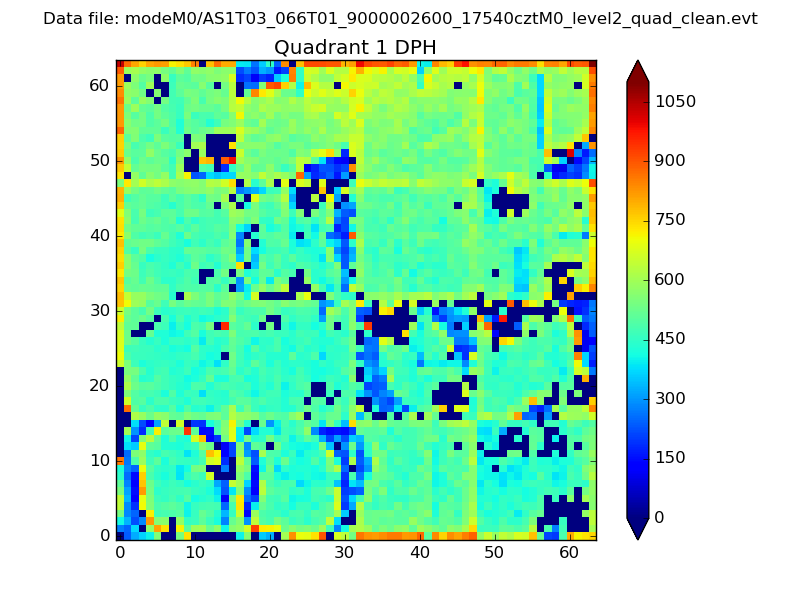 |
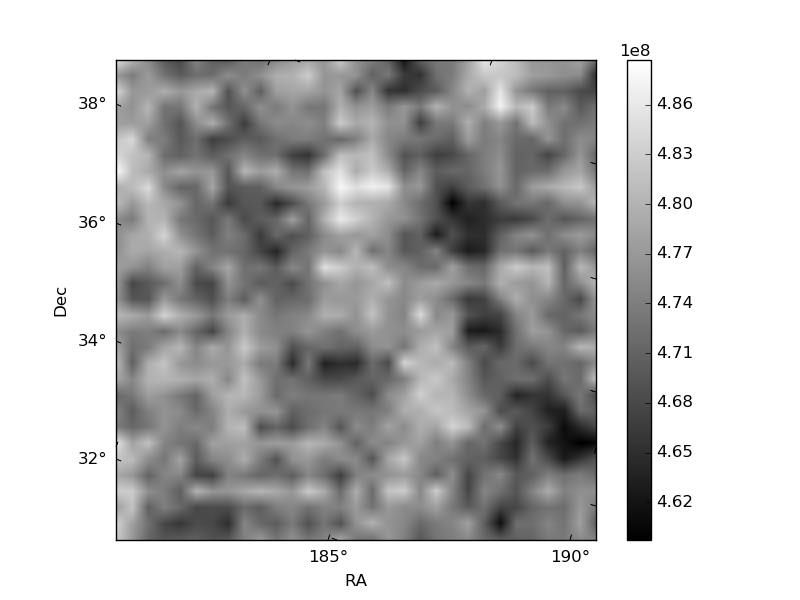
Quadrant B |
|---|---|---|---|
| Quadrant D | 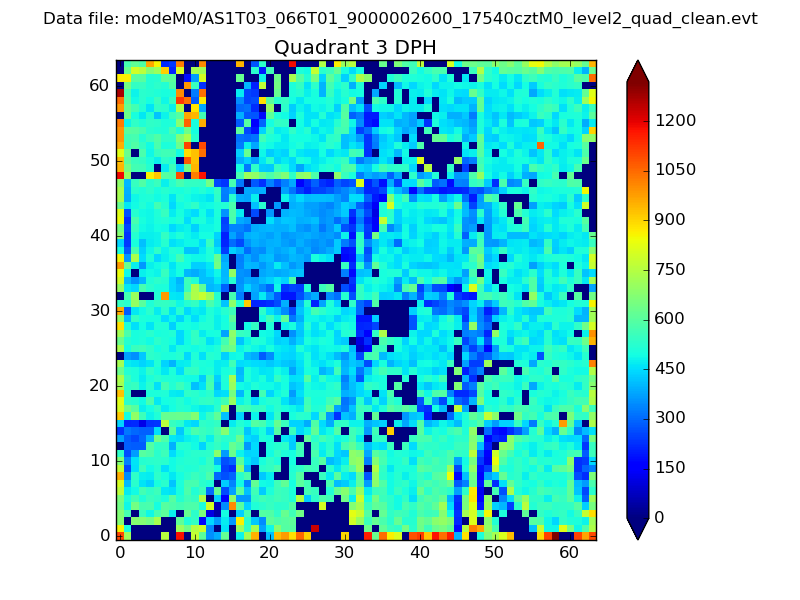 |
 |
Quadrant C |
| Plot type | Count rate plots | Images |
|---|---|---|
| Comparison with Poisson distribution Blue bars denote a histogram of data divided into 1 sec bins. Red curve is a Poisson curve with rate = median count rate of data. |
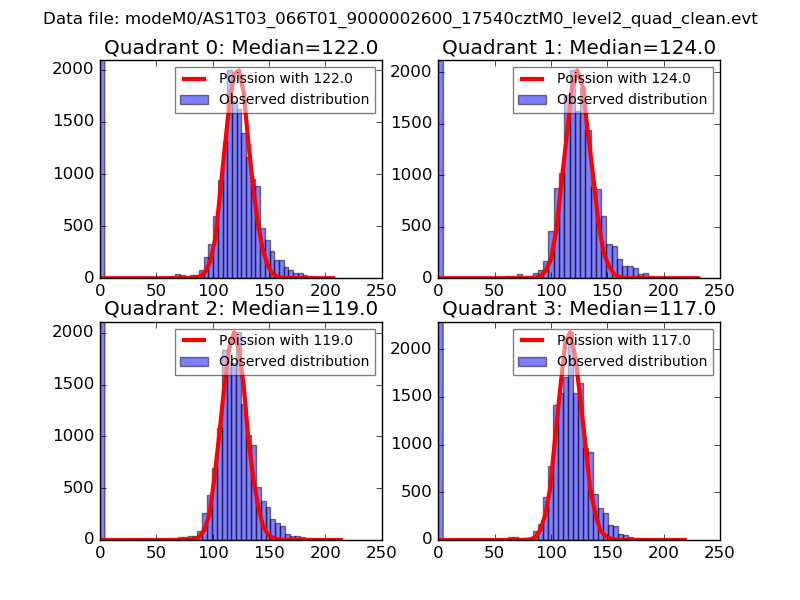 |
 |
| Quadrant-wise count rates Data is divided into 100 sec bins |
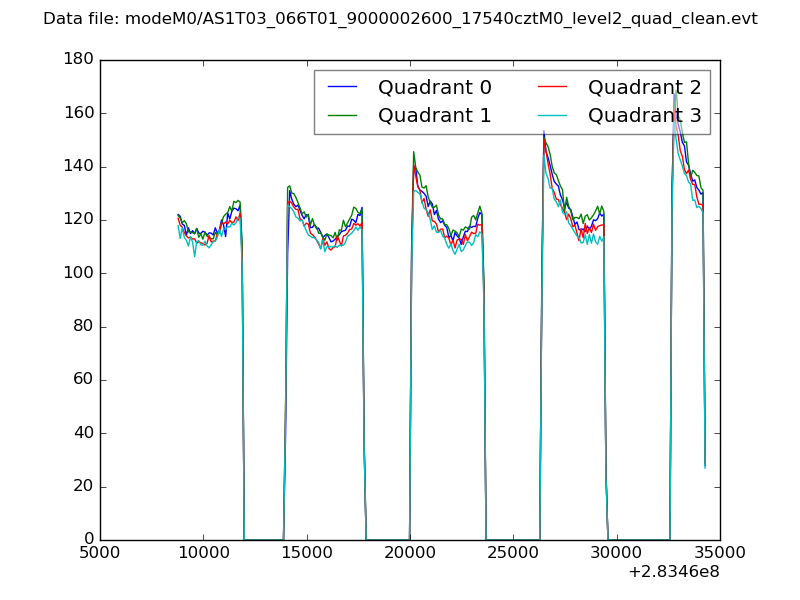 |
|
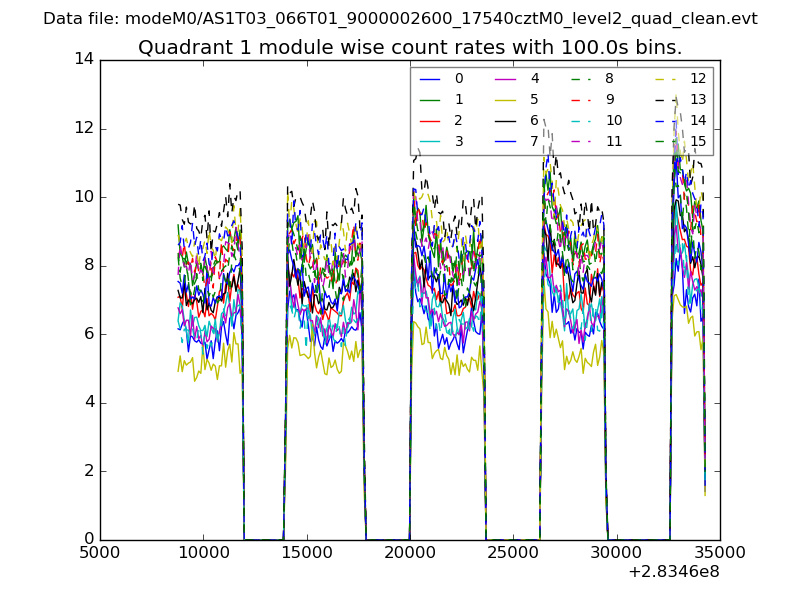
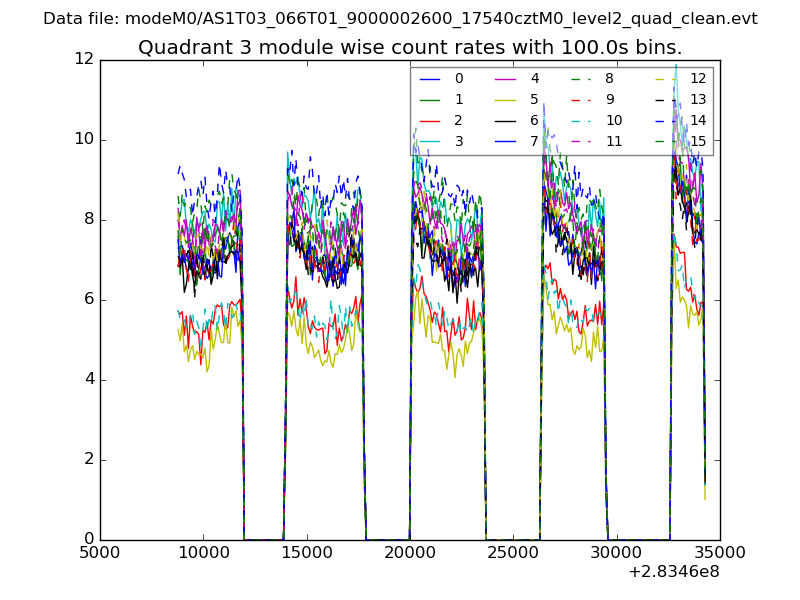
| Module-wise count rates for Quadrant A Data is divided into 100 sec bins |
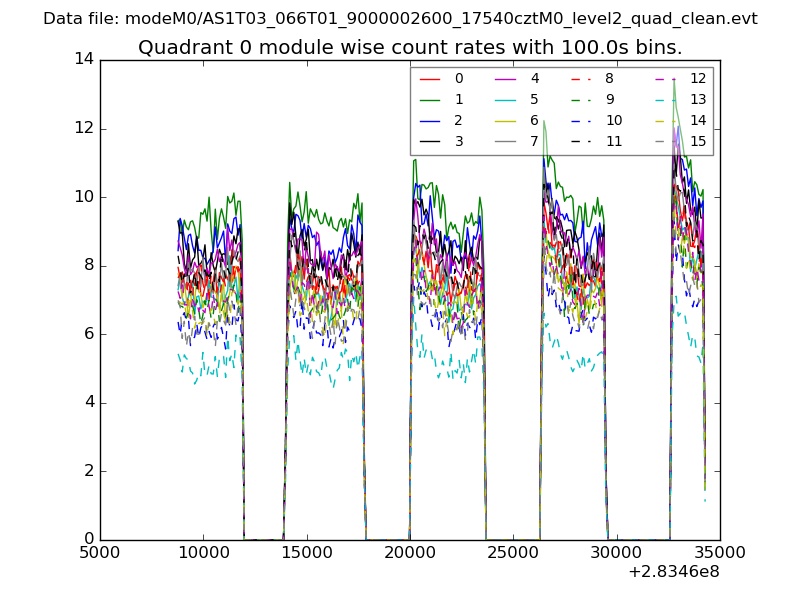 |
 |
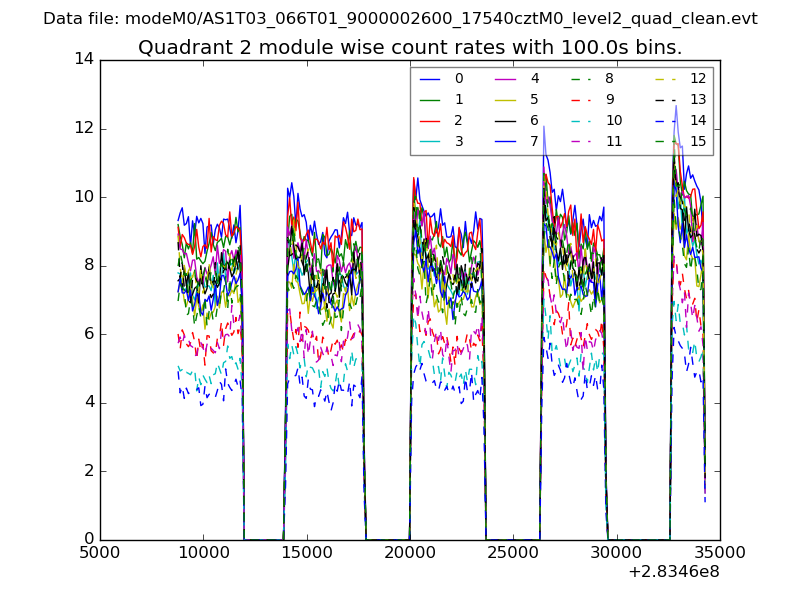
| Module-wise count rates for Quadrant B Data is divided into 100 sec bins |
 |
 |
| Module-wise count rates for Quadrant C Data is divided into 100 sec bins |
 |
 |
| Module-wise count rates for Quadrant D Data is divided into 100 sec bins |
 |
 |
| Parameter | Plot |
|---|---|
| CZT HV Monitor |  |
| D_VDD | 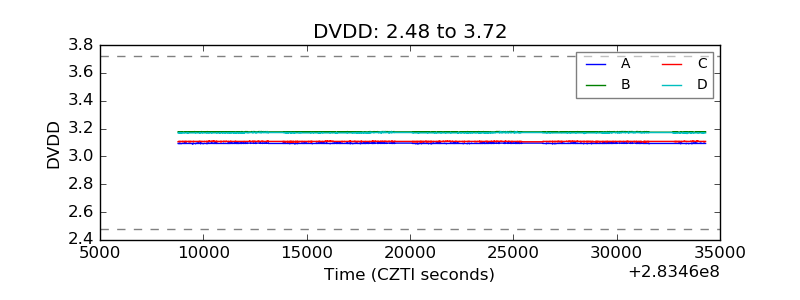 |
| Temperature 1 | 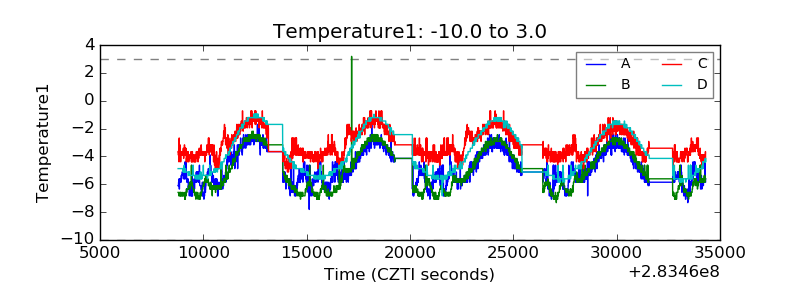 |
| Veto HV Monitor | 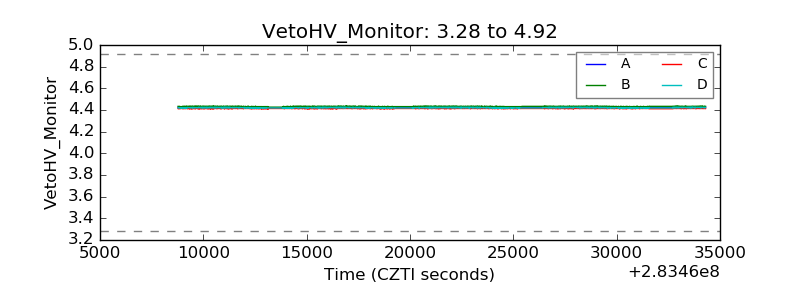 |
| Veto LLD | 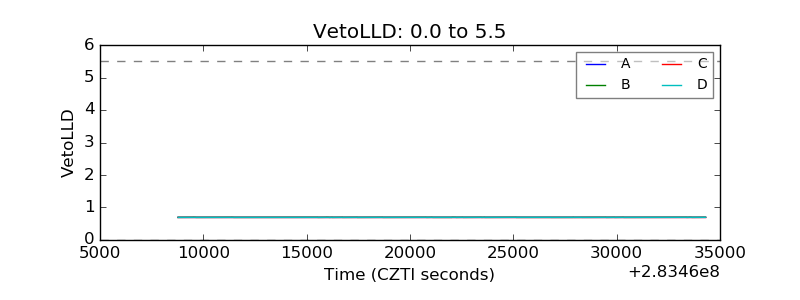 |
| Alpha Counter | 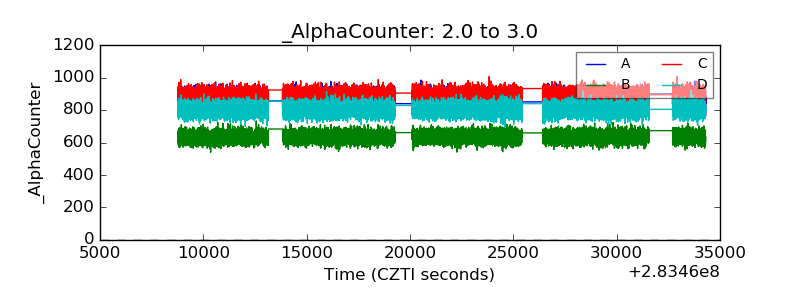 |
| _CPM_Rate | 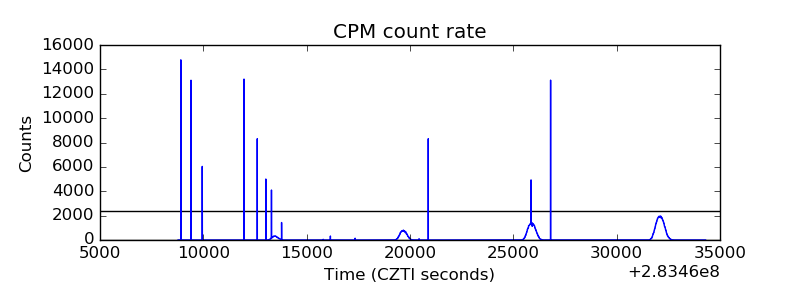 |
| CZT Counter | 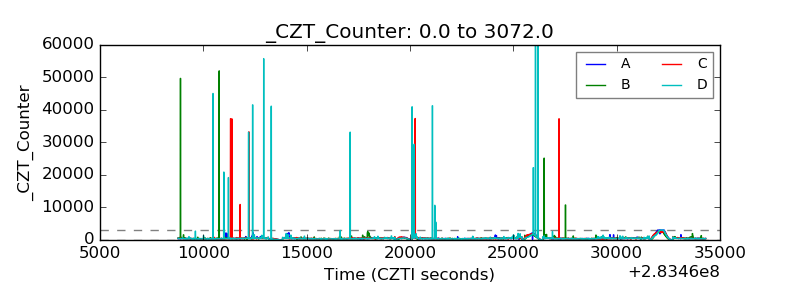 |
| +2.5 Volts monitor |  |
| +5 Volts monitor |  |
| _ROLL_ROT | 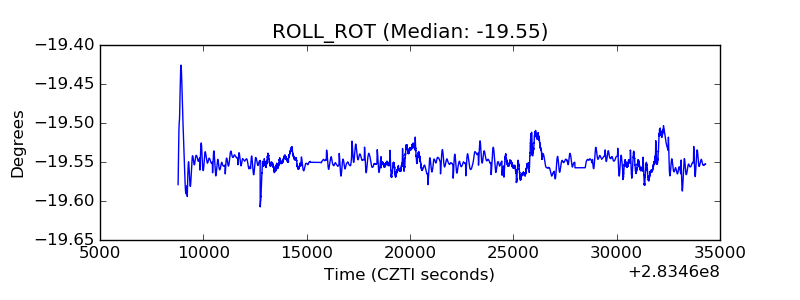 |
| _Roll_DEC |  |
| _Roll_RA | 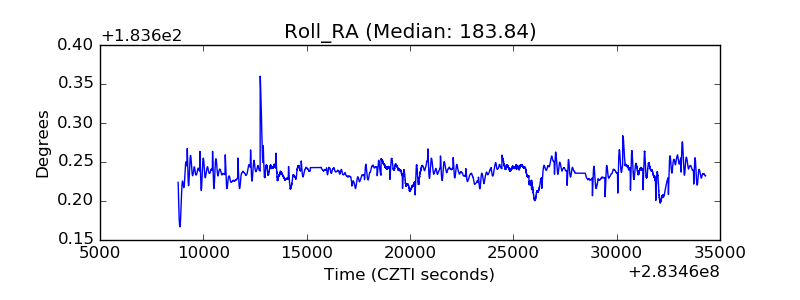 |
| Veto Counter |  |