| Param | Original file | Final file |
|---|---|---|
| Filename | modeM0/AS1T03_066T01_9000002600_17544cztM0_level2.evt | modeM0/AS1T03_066T01_9000002600_17544cztM0_level2_quad_clean.evt |
| Size (bytes) | 580,815,360 | 76,798,080 |
| Size | 553.9 MB | 73.2 MB |
| Events in quadrant A | 7,446,517 | 467,181 |
| Events in quadrant B | 3,605,112 | 501,317 |
| Events in quadrant C | 3,033,791 | 483,791 |
| Events in quadrant D | 3,117,285 | 473,318 |
| Mode M9 | |||
|---|---|---|---|
| Quadrant | BADHDUFLAG | Total packets | Discarded packets |
| A | 0 | 12 | 0 |
| B | 0 | 12 | 0 |
| C | 0 | 12 | 0 |
| D | 0 | 12 | 0 |
| Mode SS | |||
|---|---|---|---|
| Quadrant | BADHDUFLAG | Total packets | Discarded packets |
| A | 0 | 116 | 0 |
| B | 0 | 116 | 0 |
| C | 0 | 116 | 0 |
| D | 0 | 116 | 0 |
| Mode M0 | |||
|---|---|---|---|
| Quadrant | BADHDUFLAG | Total packets | Discarded packets |
| A | 0 | 25982 | 1 |
| B | 0 | 14112 | 1 |
| C | 0 | 12186 | 1 |
| D | 0 | 12822 | 1 |
| Quadrant | Total seconds | Saturated seconds | Saturation percentage |
|---|---|---|---|
| A | 5716 | 1618 | 28.306508% |
| B | 5717 | 330 | 5.772258% |
| C | 5717 | 109 | 1.906594% |
| D | 5717 | 82 | 1.434319% |
Noise dominated data is calculated using 1-second bins in cleaned event files. If a bin has >2000 counts, and if more than 50% of those come from <1% of pixels, then it is considered to be noise-dominated and hence unusable.
| Quadrant | # 1 sec bins | Bins with >0 counts | Bins with >2000 counts | High rate bins dominated by noise | Noise dominated (total time) | Noise dominated (detector-on time) | Marked lightcurve |
|---|---|---|---|---|---|---|---|
| A | 6951 | 5716 | 1281 | 1281 | 18.43% | 22.41% | 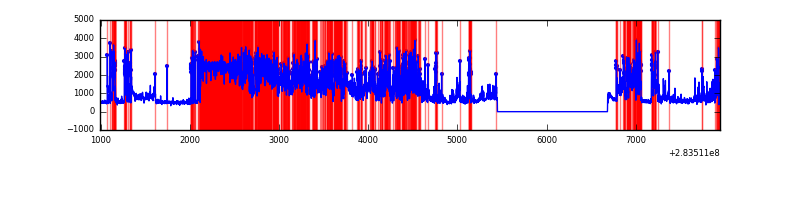 |
| B | 6952 | 5718 | 191 | 191 | 2.75% | 3.34% | 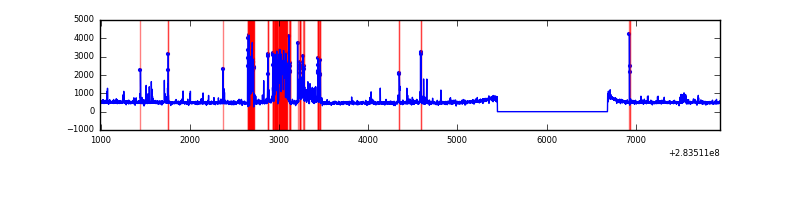 |
| C | 6952 | 5718 | 4 | 4 | 0.06% | 0.07% | 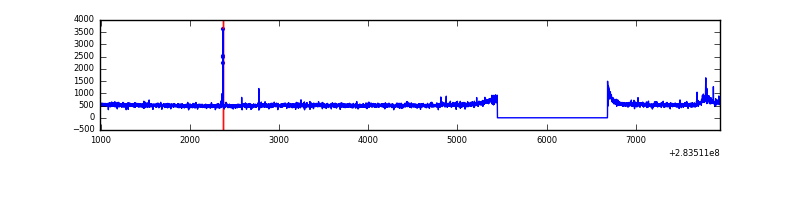 |
| D | 6952 | 5718 | 1 | 1 | 0.01% | 0.02% | 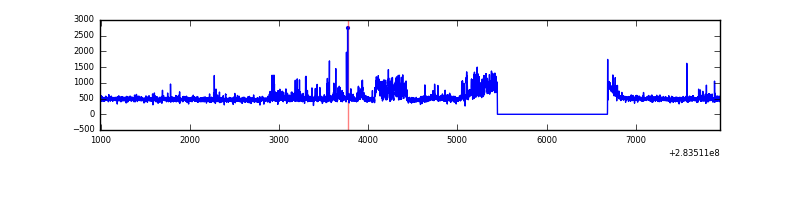 |
Top three noisy pixels from each quadrant. If the there are fewer than three noisy pixels in the level2.evt file, extra rows are filled as -1
| Pixel properties | Quadrant properties | ||||||
|---|---|---|---|---|---|---|---|
| Quadrant | DetID | PixID | Counts | Sigma | Mean | Median | Sigma |
| A | 14 | 237 | 4863681 | 36452.14 | 666 | 653 | 133.4 |
| A | 15 | 174 | 17991 | 129.96 | 666 | 653 | 133.4 |
| A | 0 | 226 | 5797 | 38.55 | 666 | 653 | 133.4 |
| B | 10 | 245 | 636538 | 4676.95 | 715 | 698 | 136.0 |
| B | 6 | 36 | 149883 | 1097.34 | 715 | 698 | 136.0 |
| B | 12 | 111 | 15417 | 108.27 | 715 | 698 | 136.0 |
| C | 3 | 233 | 148697 | 906.93 | 704 | 709 | 163.2 |
| C | 14 | 238 | 110488 | 672.77 | 704 | 709 | 163.2 |
| C | 5 | 218 | 16597 | 97.37 | 704 | 709 | 163.2 |
| D | 13 | 168 | 238125 | 1360.55 | 721 | 700 | 174.5 |
| D | 13 | 189 | 64773 | 367.17 | 721 | 700 | 174.5 |
| D | 1 | 52 | 39615 | 223.0 | 721 | 700 | 174.5 |
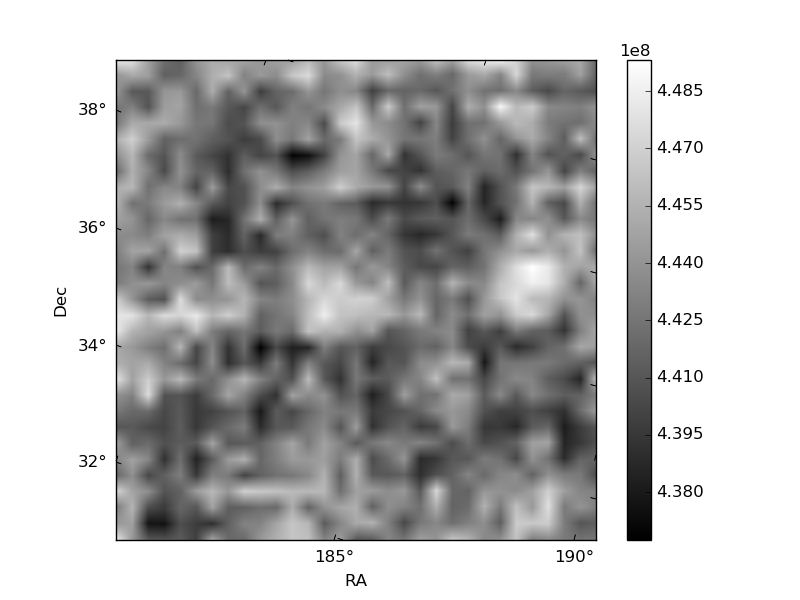
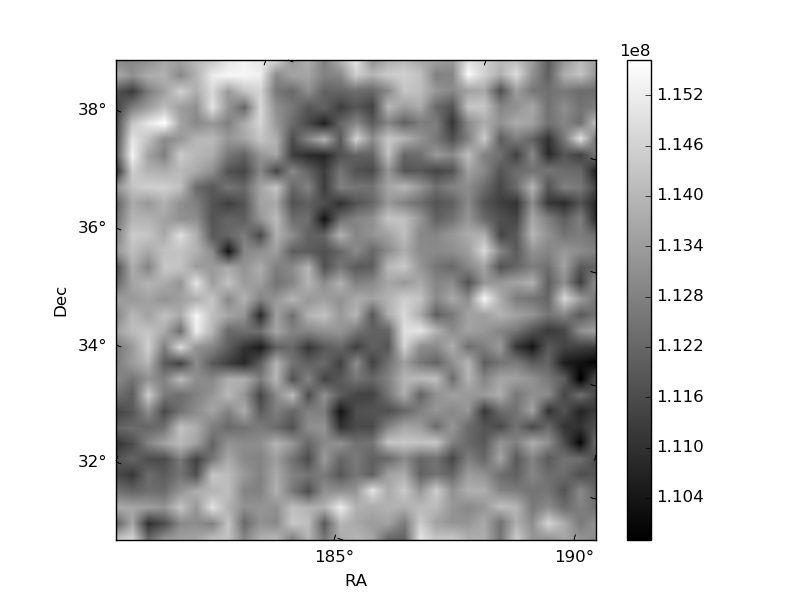
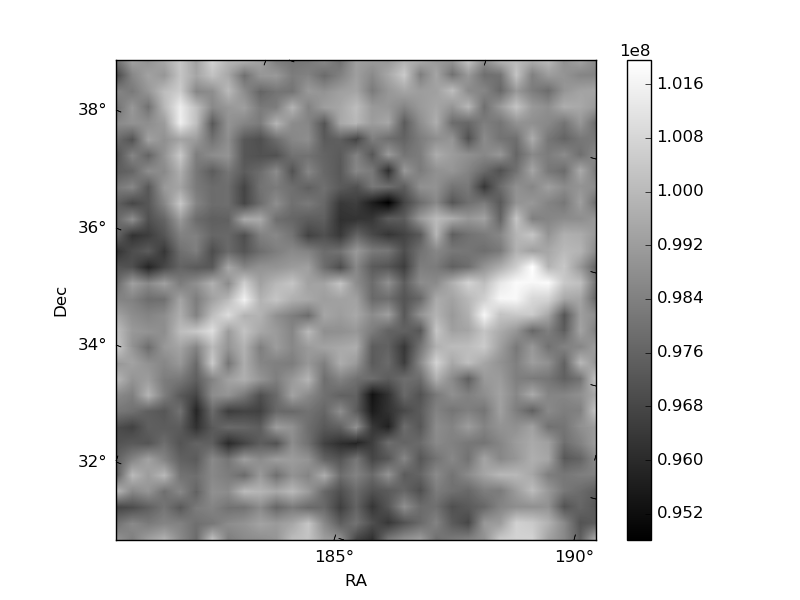
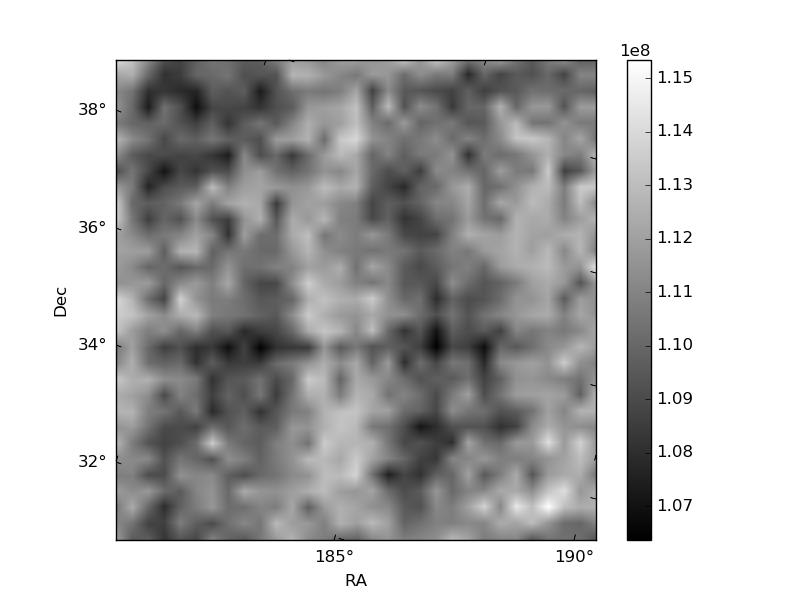
Histogram calculated using DETX and DETY for each event in the final _common_clean file
| Quadrant A | 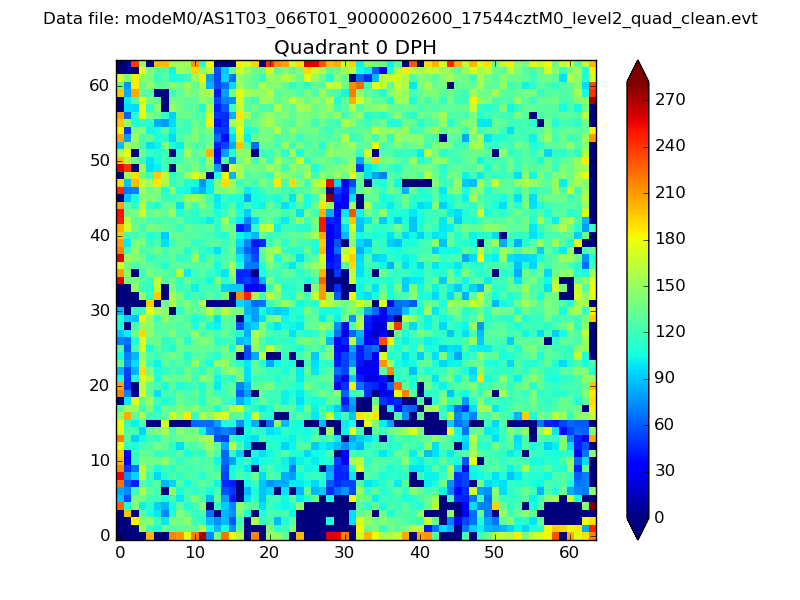 |
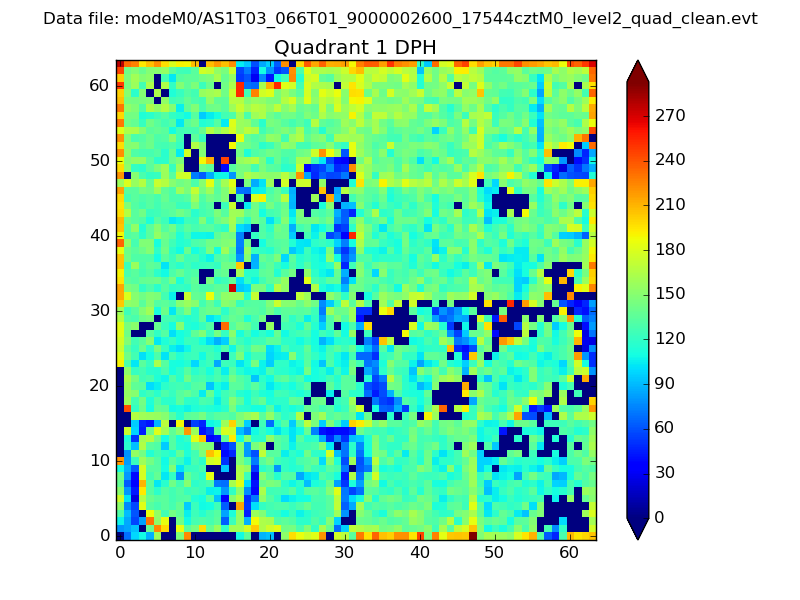 |
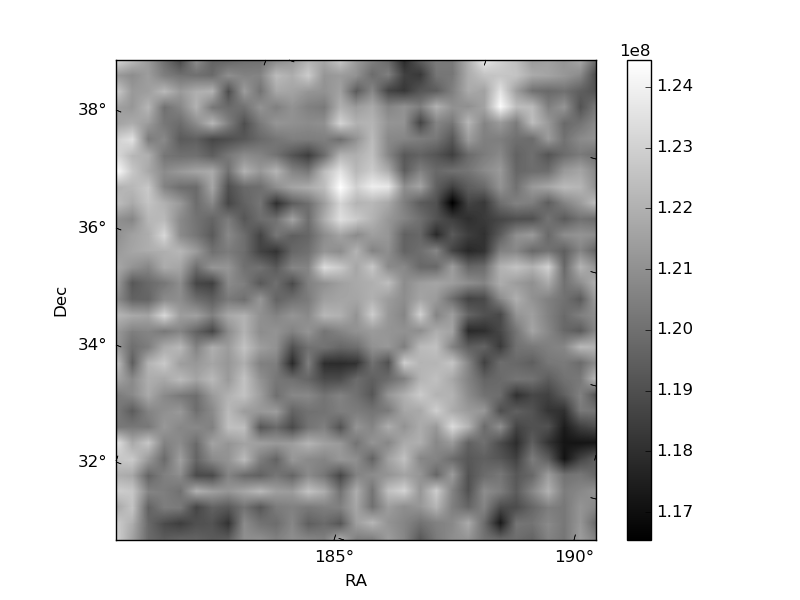
Quadrant B |
|---|---|---|---|
| Quadrant D | 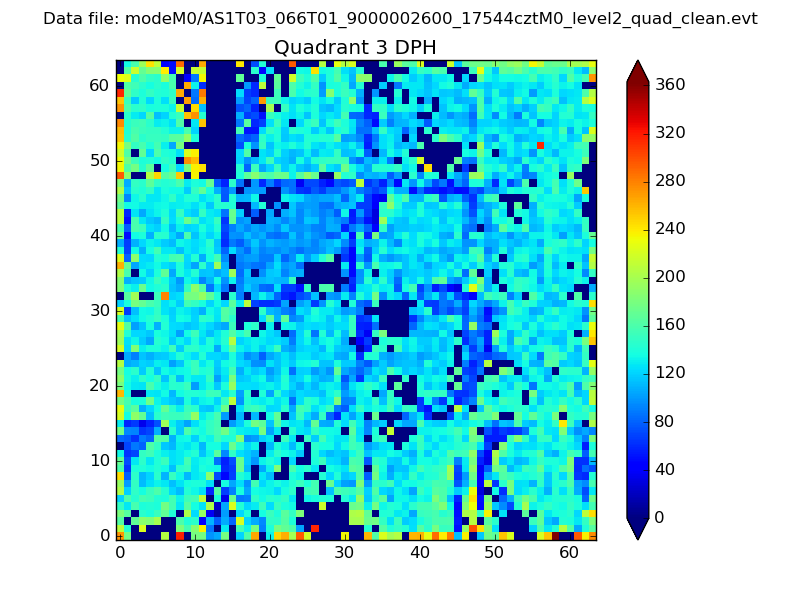 |
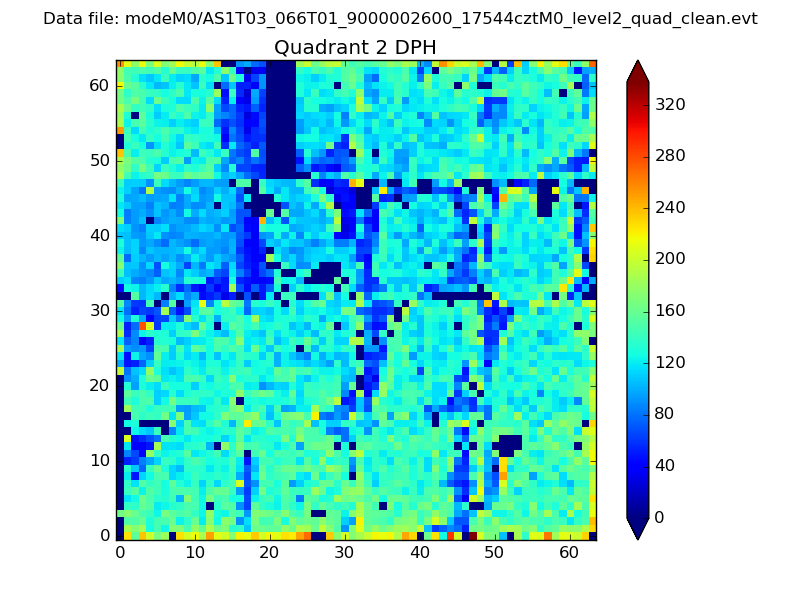 |
Quadrant C |
| Plot type | Count rate plots | Images |
|---|---|---|
| Comparison with Poisson distribution Blue bars denote a histogram of data divided into 1 sec bins. Red curve is a Poisson curve with rate = median count rate of data. |
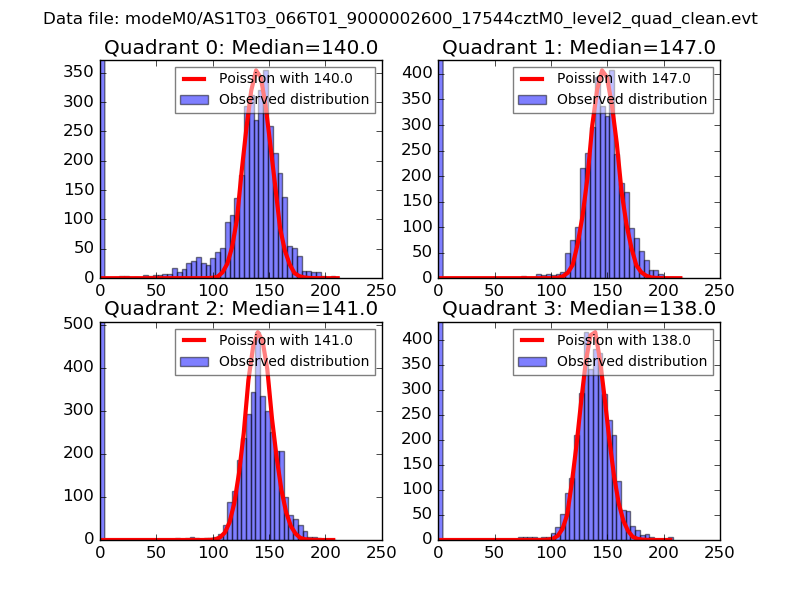 |
 |
| Quadrant-wise count rates Data is divided into 100 sec bins |
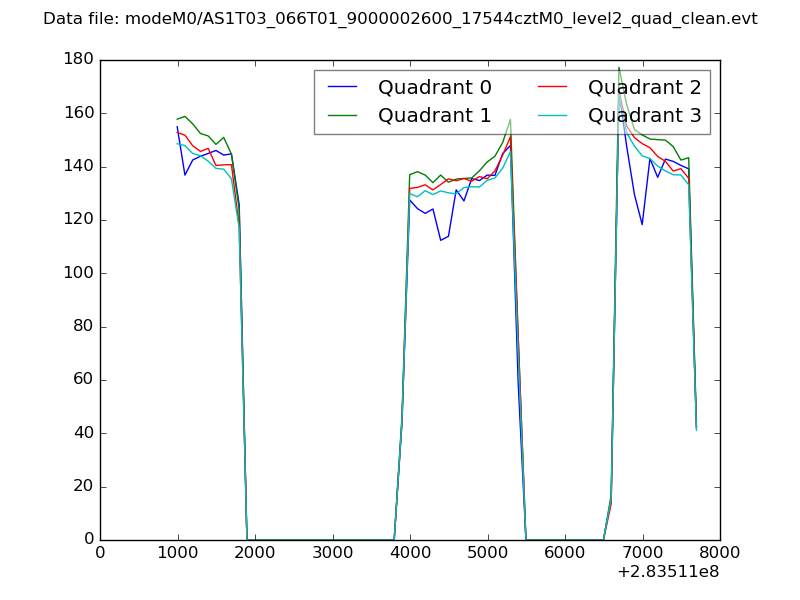 |
|
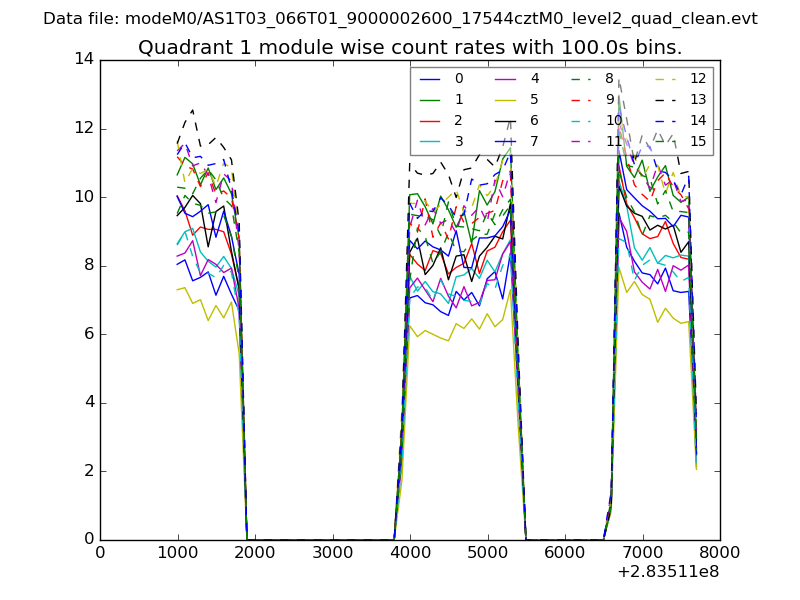
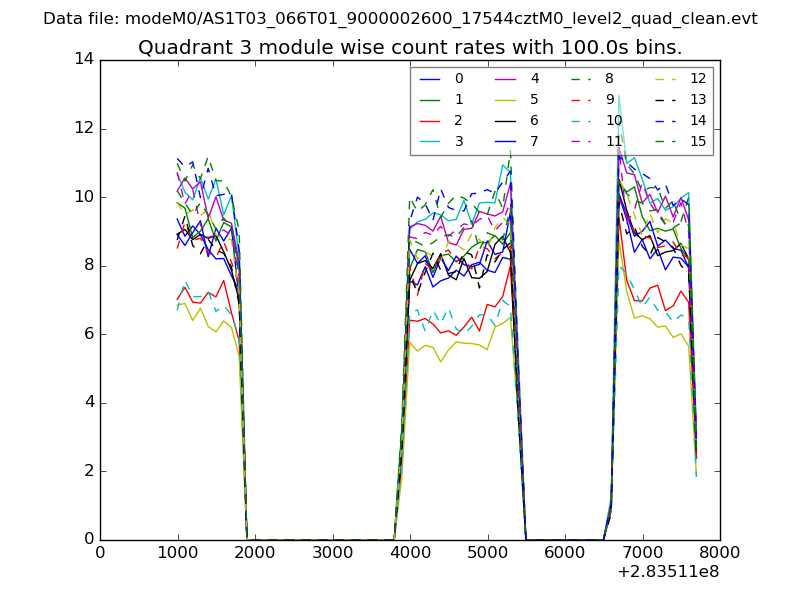
| Module-wise count rates for Quadrant A Data is divided into 100 sec bins |
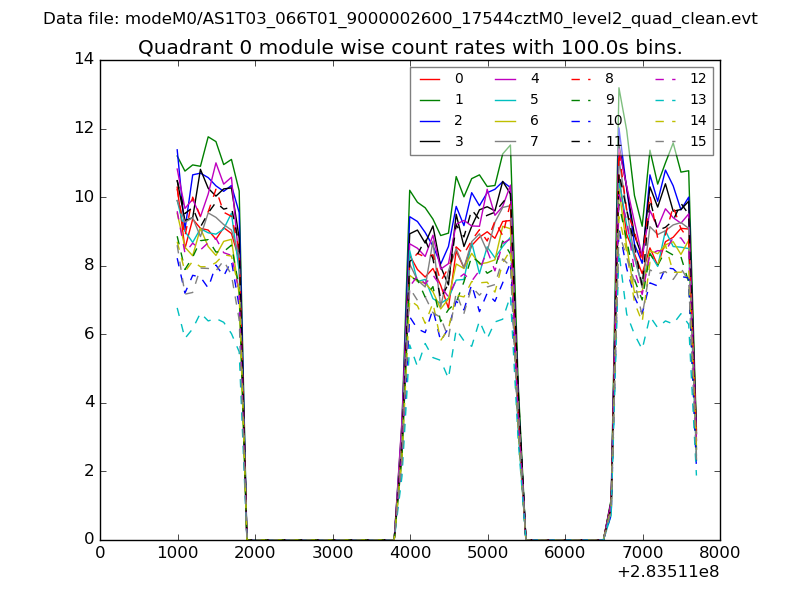 |
 |
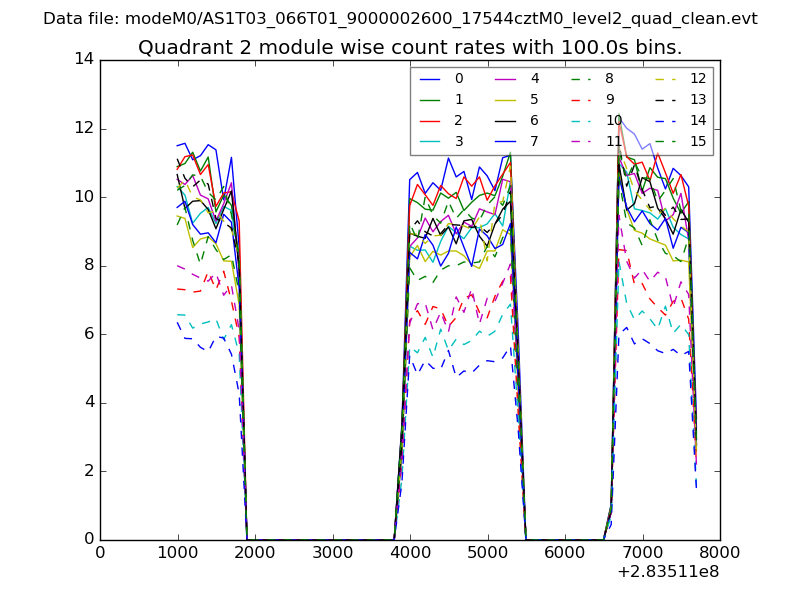
| Module-wise count rates for Quadrant B Data is divided into 100 sec bins |
 |
 |
| Module-wise count rates for Quadrant C Data is divided into 100 sec bins |
 |
 |
| Module-wise count rates for Quadrant D Data is divided into 100 sec bins |
 |
 |
| Parameter | Plot |
|---|---|
| CZT HV Monitor | 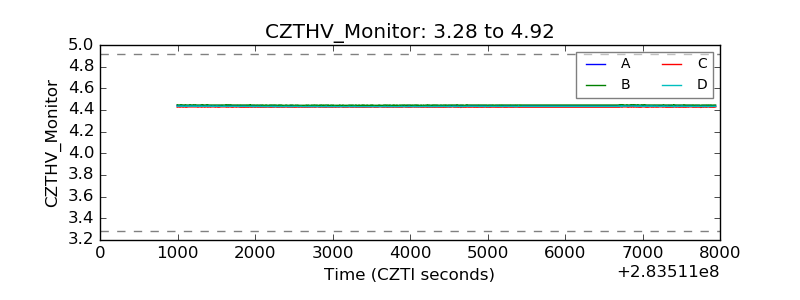 |
| D_VDD | 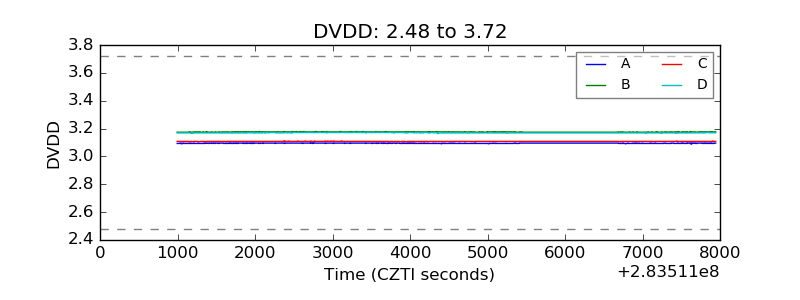 |
| Temperature 1 | 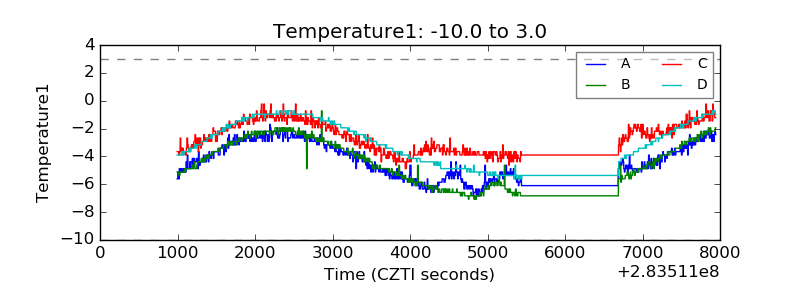 |
| Veto HV Monitor | 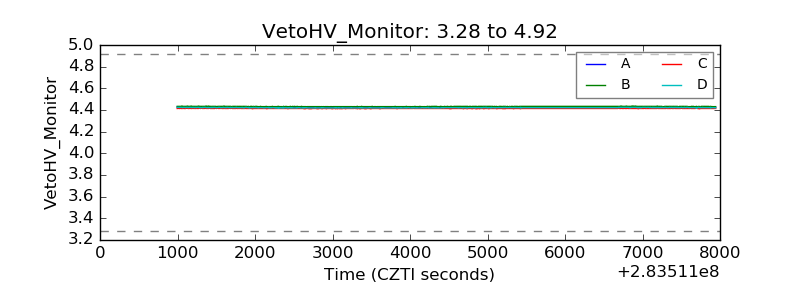 |
| Veto LLD | 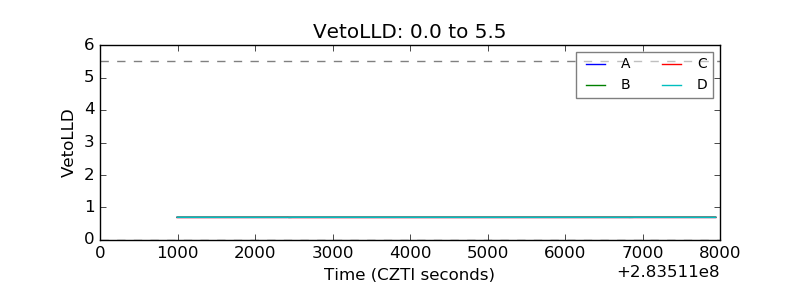 |
| Alpha Counter | 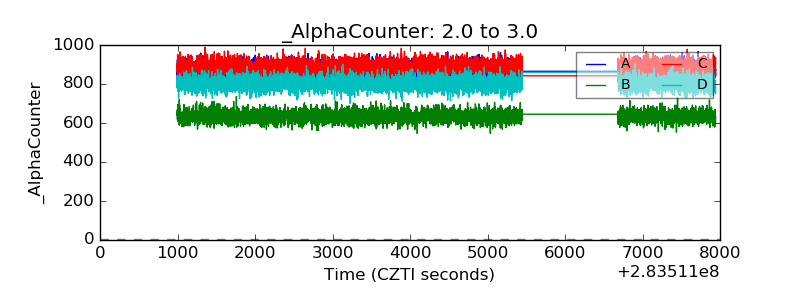 |
| _CPM_Rate | 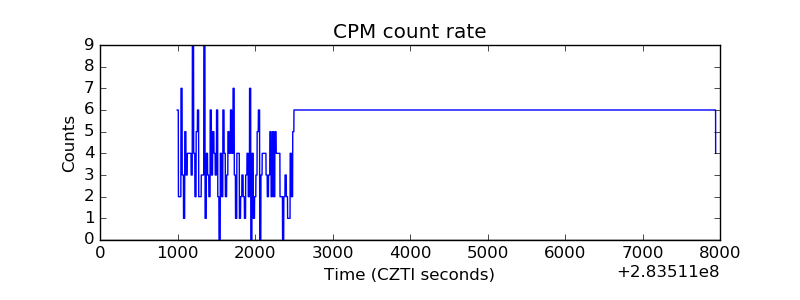 |
| CZT Counter | 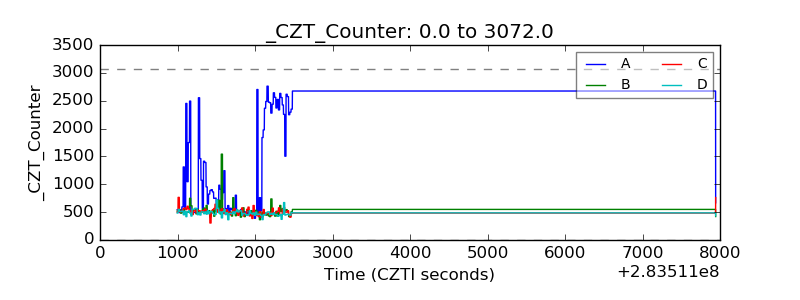 |
| +2.5 Volts monitor |  |
| +5 Volts monitor |  |
| _ROLL_ROT | 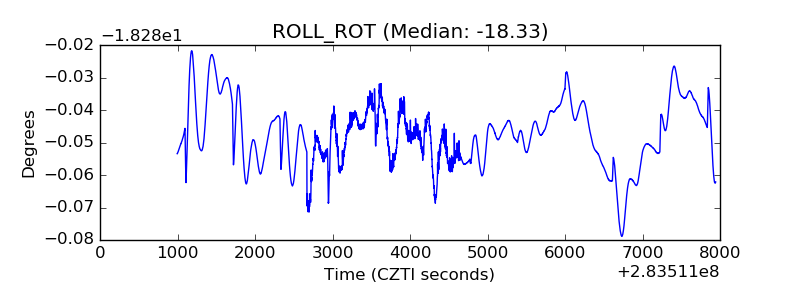 |
| _Roll_DEC | 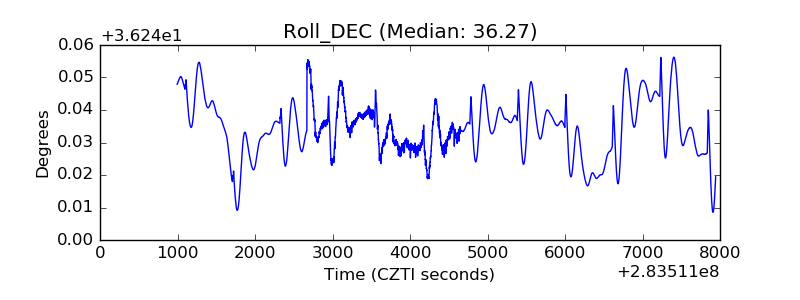 |
| _Roll_RA | 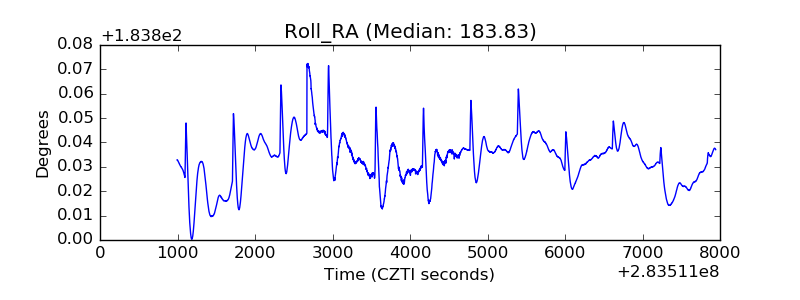 |
| Veto Counter | 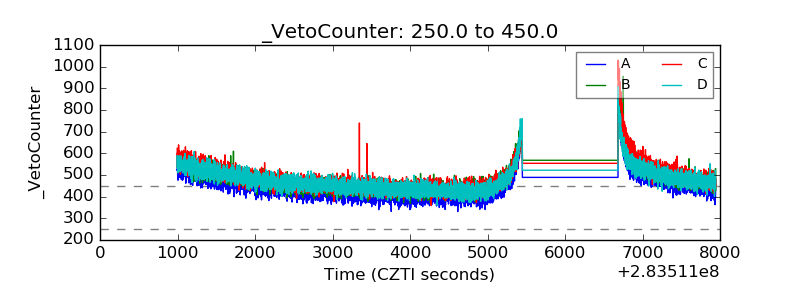 |