| Param | Original file | Final file |
|---|---|---|
| Filename | modeM0/AS1T03_066T01_9000002600_17545cztM0_level2.evt | modeM0/AS1T03_066T01_9000002600_17545cztM0_level2_quad_clean.evt |
| Size (bytes) | 519,278,400 | 84,205,440 |
| Size | 495.2 MB | 80.3 MB |
| Events in quadrant A | 4,570,048 | 518,699 |
| Events in quadrant B | 3,506,080 | 539,139 |
| Events in quadrant C | 3,714,094 | 521,560 |
| Events in quadrant D | 3,490,143 | 511,831 |
| Mode M9 | |||
|---|---|---|---|
| Quadrant | BADHDUFLAG | Total packets | Discarded packets |
| A | 0 | 10 | 0 |
| B | 0 | 11 | 0 |
| C | 0 | 11 | 0 |
| D | 0 | 11 | 0 |
| Mode SS | |||
|---|---|---|---|
| Quadrant | BADHDUFLAG | Total packets | Discarded packets |
| A | 0 | 134 | 0 |
| B | 0 | 134 | 0 |
| C | 0 | 134 | 0 |
| D | 0 | 134 | 0 |
| Mode M0 | |||
|---|---|---|---|
| Quadrant | BADHDUFLAG | Total packets | Discarded packets |
| A | 0 | 17784 | 2 |
| B | 0 | 14392 | 2 |
| C | 0 | 14941 | 4 |
| D | 0 | 14603 | 2 |
| Quadrant | Total seconds | Saturated seconds | Saturation percentage |
|---|---|---|---|
| A | 6569 | 451 | 6.865581% |
| B | 6569 | 221 | 3.364287% |
| C | 6568 | 203 | 3.090743% |
| D | 6568 | 237 | 3.608404% |
Noise dominated data is calculated using 1-second bins in cleaned event files. If a bin has >2000 counts, and if more than 50% of those come from <1% of pixels, then it is considered to be noise-dominated and hence unusable.
| Quadrant | # 1 sec bins | Bins with >0 counts | Bins with >2000 counts | High rate bins dominated by noise | Noise dominated (total time) | Noise dominated (detector-on time) | Marked lightcurve |
|---|---|---|---|---|---|---|---|
| A | 7514 | 6569 | 167 | 167 | 2.22% | 2.54% | 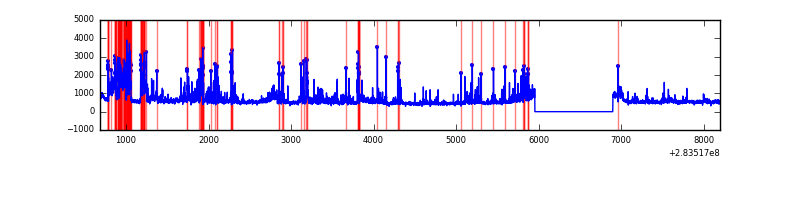 |
| B | 7514 | 6569 | 21 | 21 | 0.28% | 0.32% | 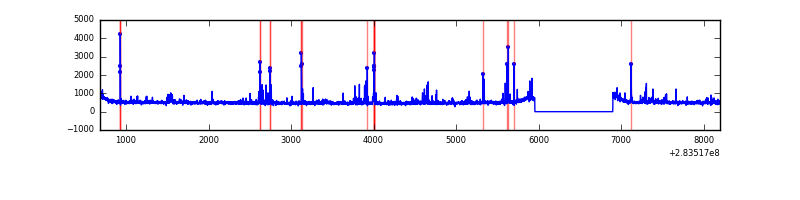 |
| C | 7513 | 6568 | 2 | 2 | 0.03% | 0.03% | 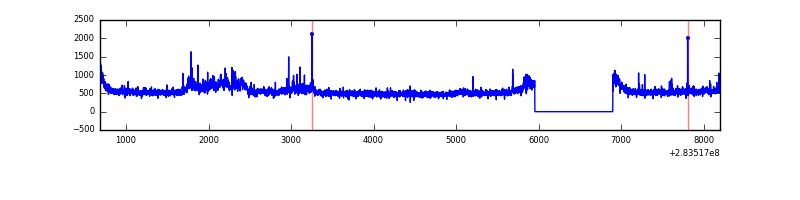 |
| D | 7513 | 6568 | 63 | 63 | 0.84% | 0.96% | 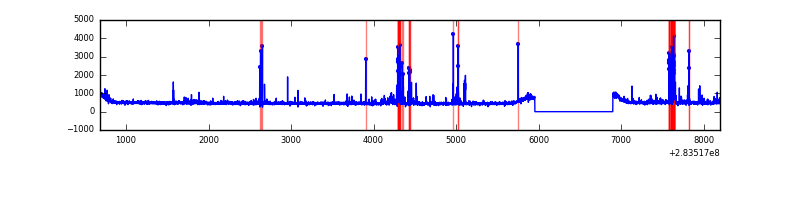 |
Top three noisy pixels from each quadrant. If the there are fewer than three noisy pixels in the level2.evt file, extra rows are filled as -1
| Pixel properties | Quadrant properties | ||||||
|---|---|---|---|---|---|---|---|
| Quadrant | DetID | PixID | Counts | Sigma | Mean | Median | Sigma |
| A | 14 | 237 | 1386844 | 8268.22 | 825 | 805 | 167.6 |
| A | 15 | 174 | 12201 | 67.98 | 825 | 805 | 167.6 |
| A | 0 | 226 | 7244 | 38.41 | 825 | 805 | 167.6 |
| B | 10 | 245 | 161577 | 1013.41 | 828 | 806 | 158.6 |
| B | 0 | 244 | 56450 | 350.75 | 828 | 806 | 158.6 |
| B | 0 | 230 | 27245 | 166.66 | 828 | 806 | 158.6 |
| C | 3 | 233 | 403875 | 2167.45 | 801 | 804 | 186.0 |
| C | 14 | 238 | 123384 | 659.15 | 801 | 804 | 186.0 |
| C | 5 | 218 | 37331 | 196.42 | 801 | 804 | 186.0 |
| D | 5 | 222 | 214911 | 1087.39 | 816 | 792 | 196.9 |
| D | 13 | 189 | 109188 | 550.48 | 816 | 792 | 196.9 |
| D | 2 | 234 | 22728 | 111.4 | 816 | 792 | 196.9 |
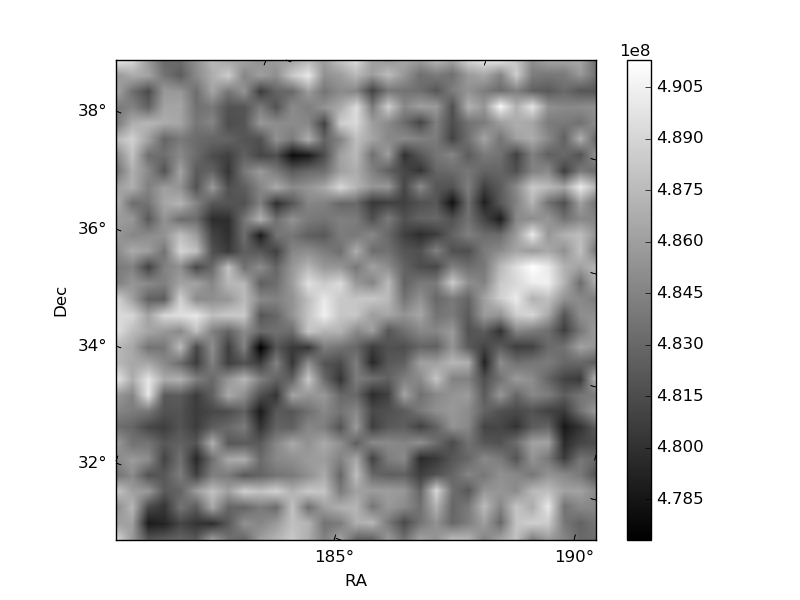
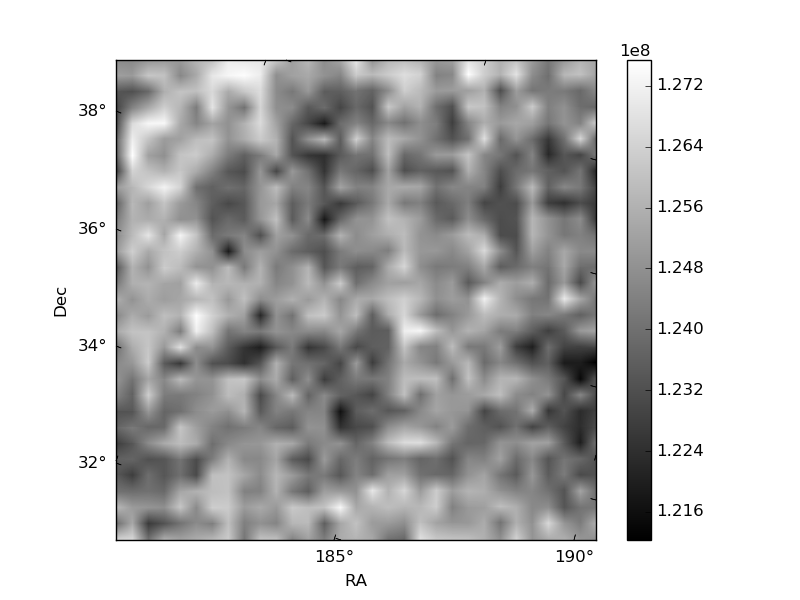
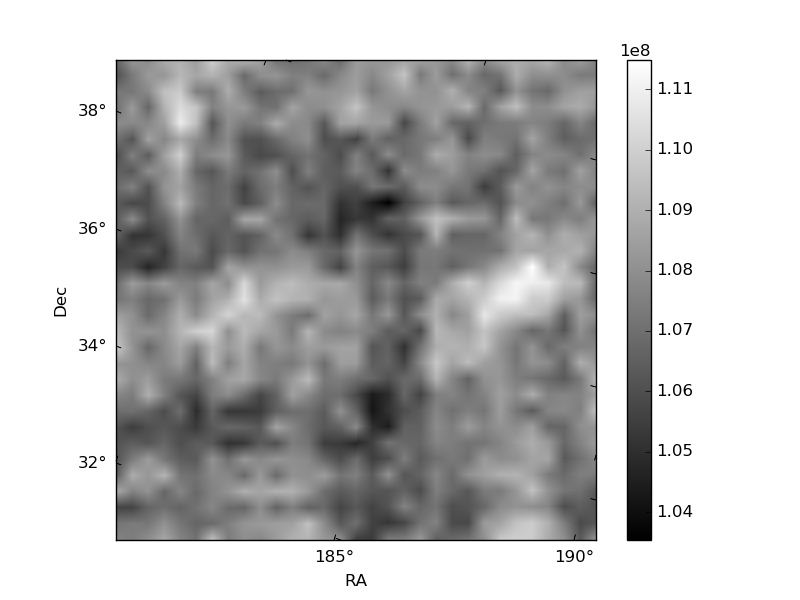
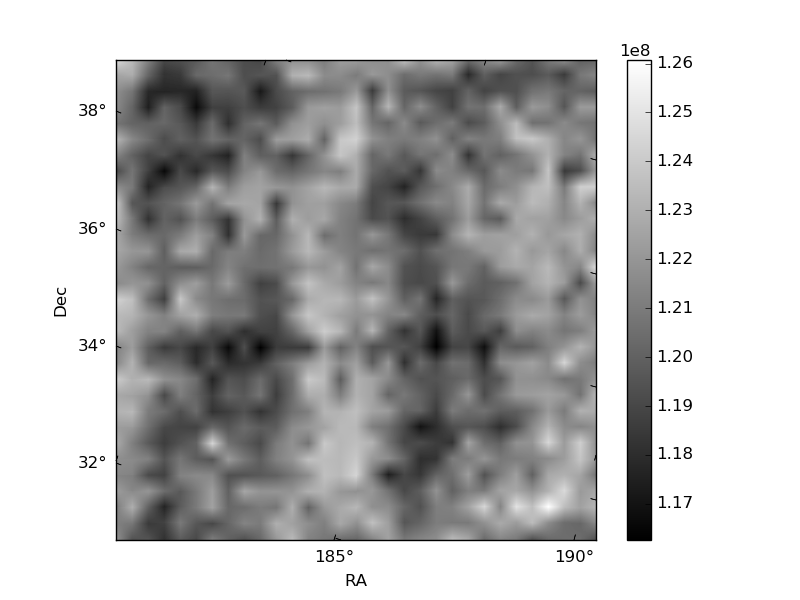
Histogram calculated using DETX and DETY for each event in the final _common_clean file
| Quadrant A | 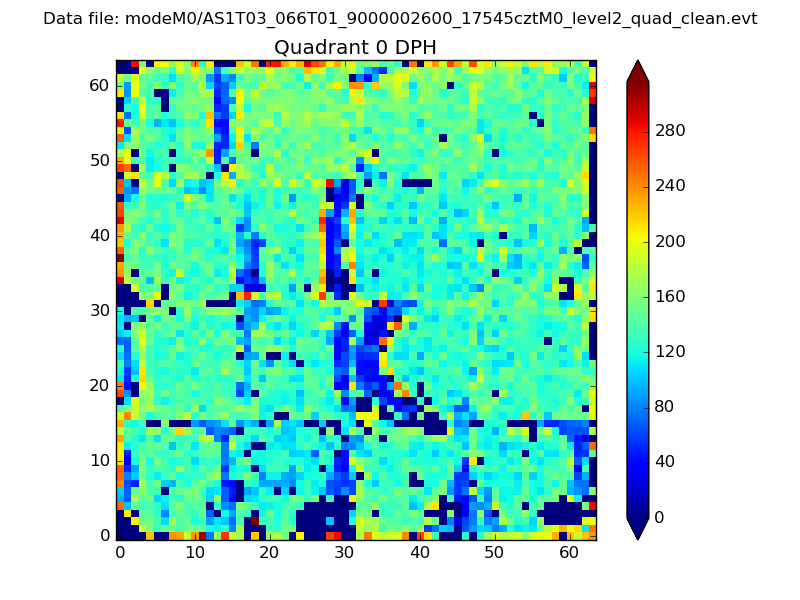 |
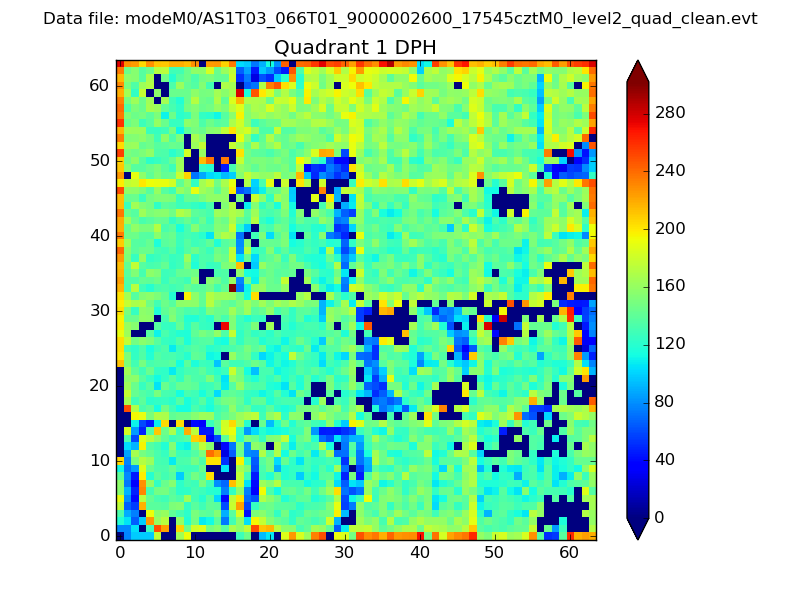 |
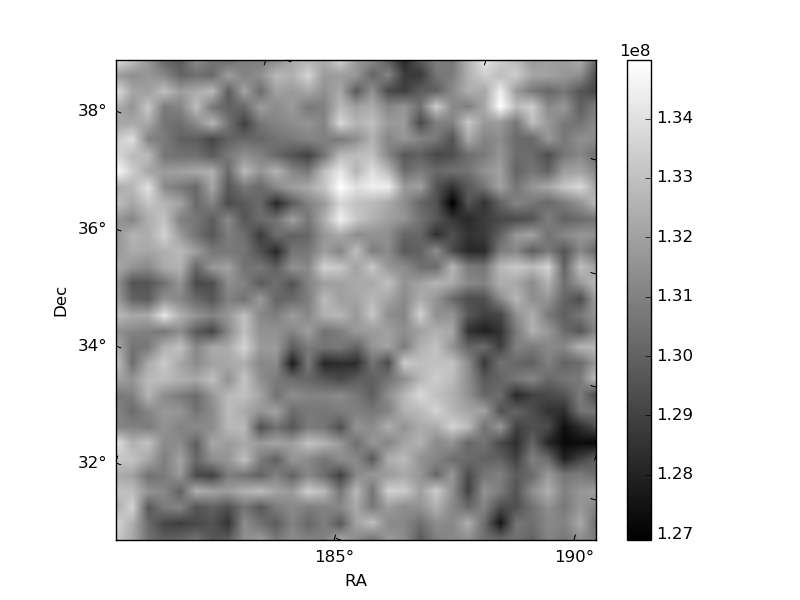
Quadrant B |
|---|---|---|---|
| Quadrant D | 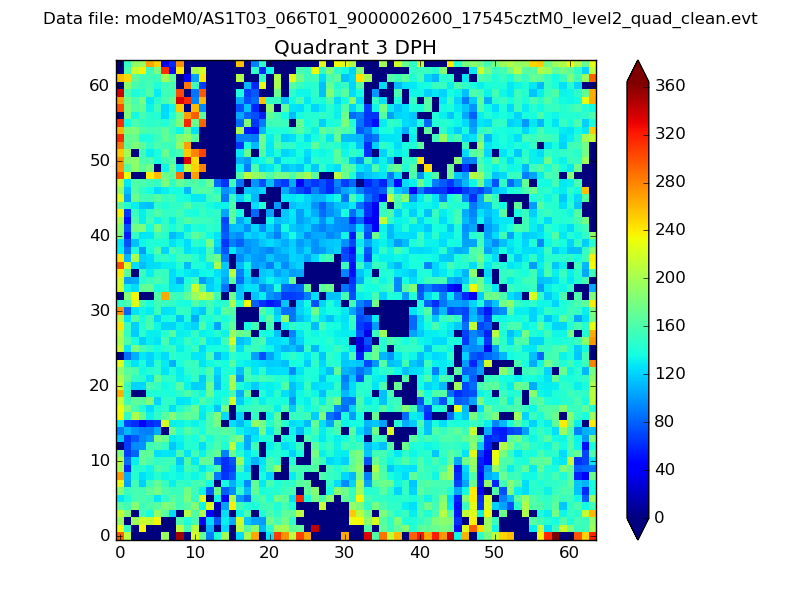 |
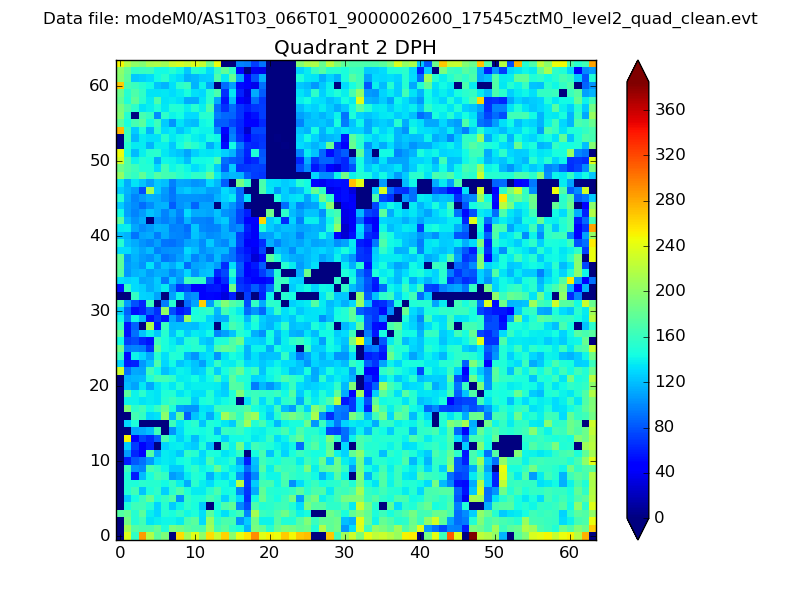 |
Quadrant C |
| Plot type | Count rate plots | Images |
|---|---|---|
| Comparison with Poisson distribution Blue bars denote a histogram of data divided into 1 sec bins. Red curve is a Poisson curve with rate = median count rate of data. |
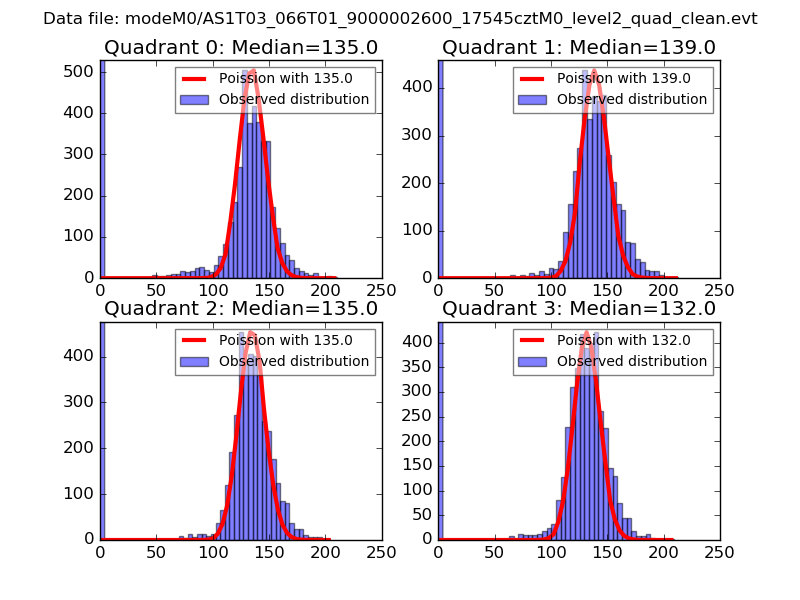 |
 |
| Quadrant-wise count rates Data is divided into 100 sec bins |
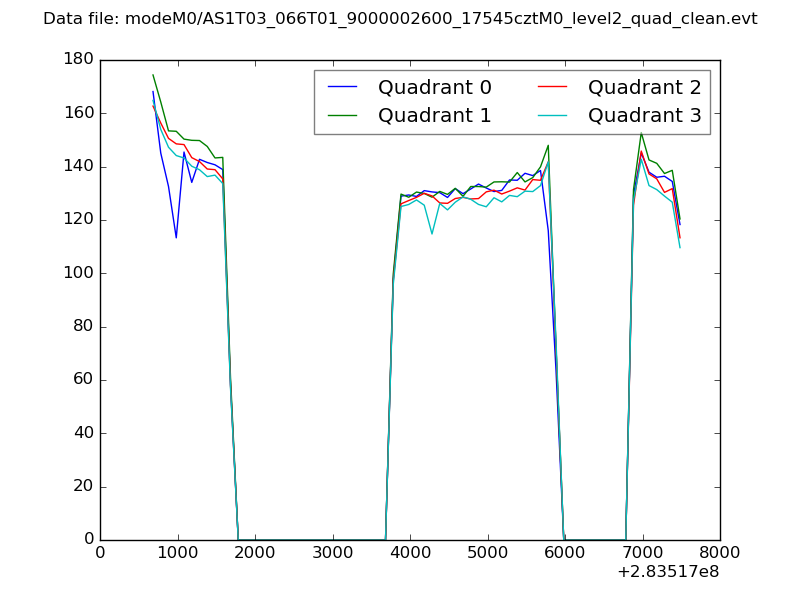 |
|
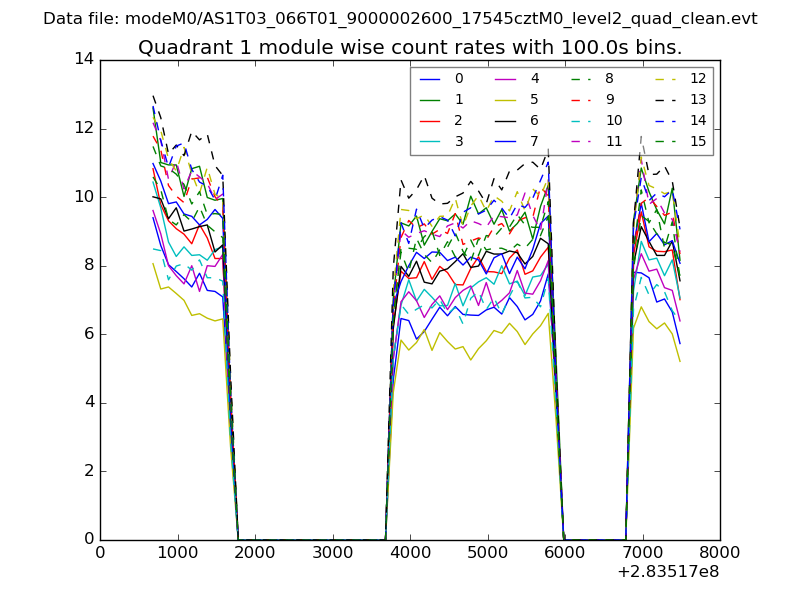
| Module-wise count rates for Quadrant A Data is divided into 100 sec bins |
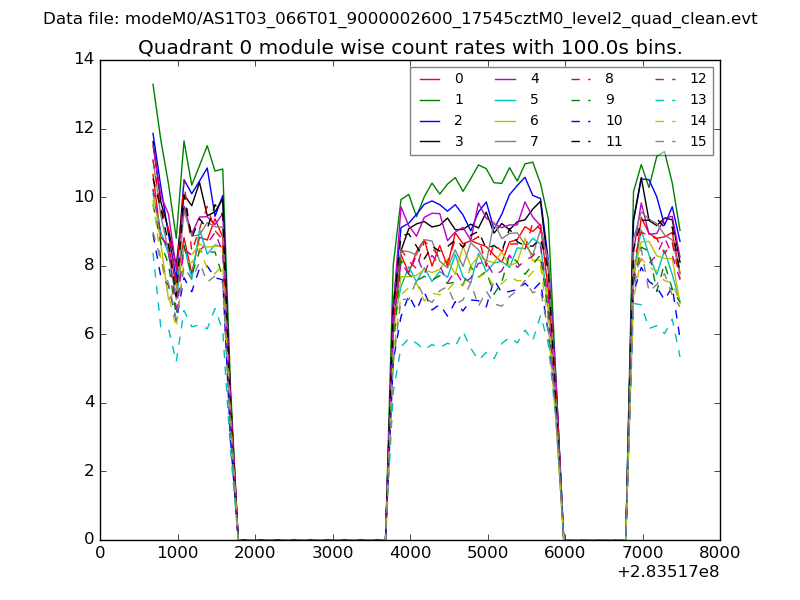 |
 |
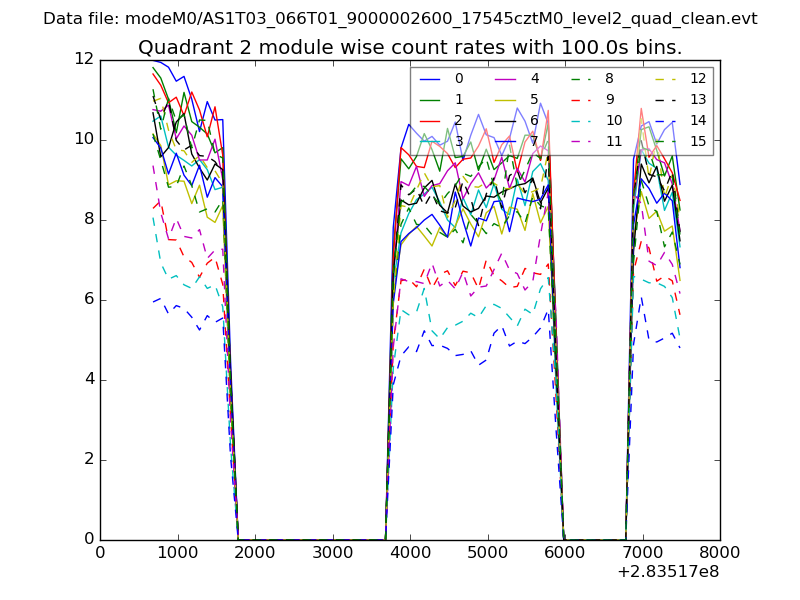
| Module-wise count rates for Quadrant B Data is divided into 100 sec bins |
 |
 |
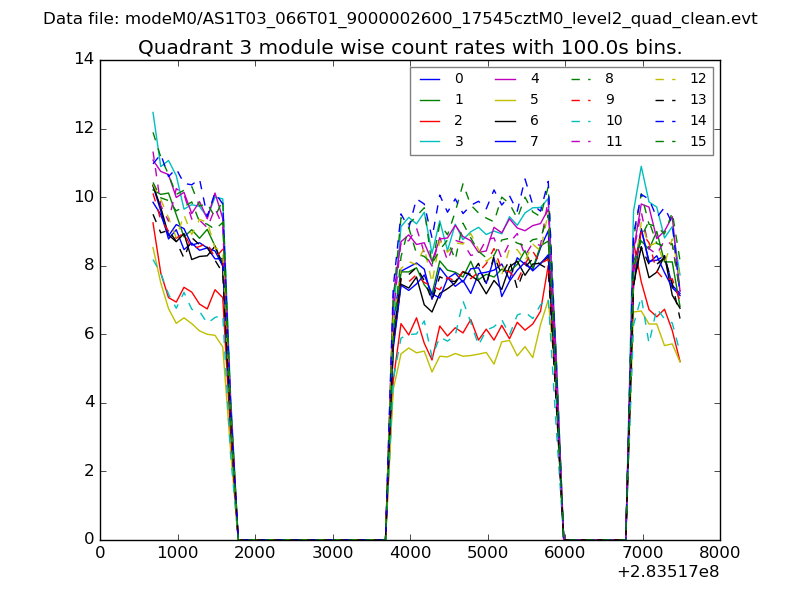
| Module-wise count rates for Quadrant C Data is divided into 100 sec bins |
 |
 |
| Module-wise count rates for Quadrant D Data is divided into 100 sec bins |
 |
 |
| Parameter | Plot |
|---|---|
| CZT HV Monitor | 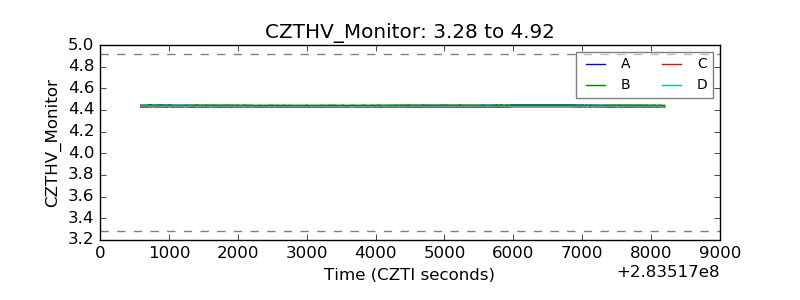 |
| D_VDD | 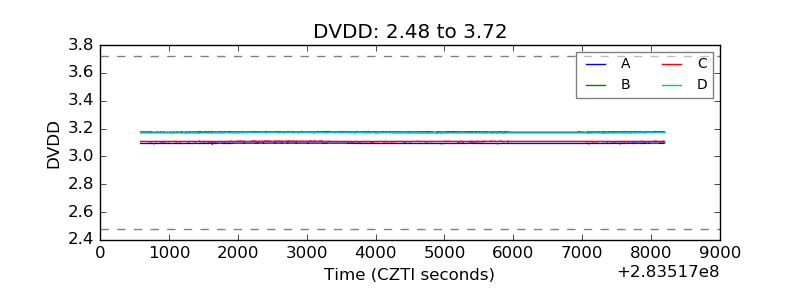 |
| Temperature 1 | 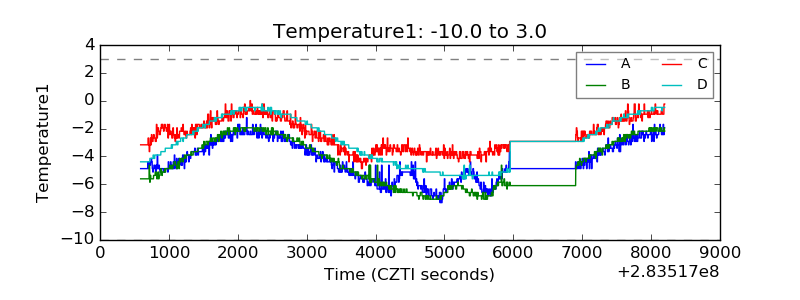 |
| Veto HV Monitor | 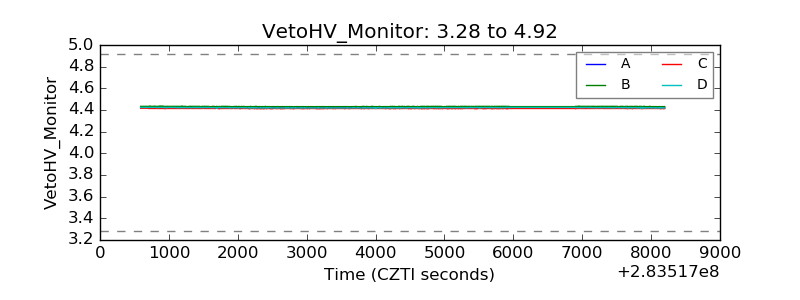 |
| Veto LLD | 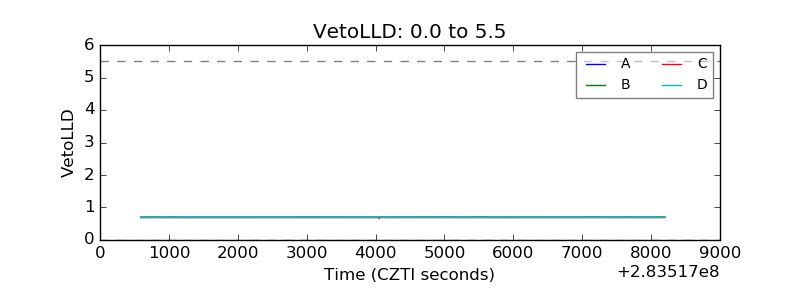 |
| Alpha Counter | 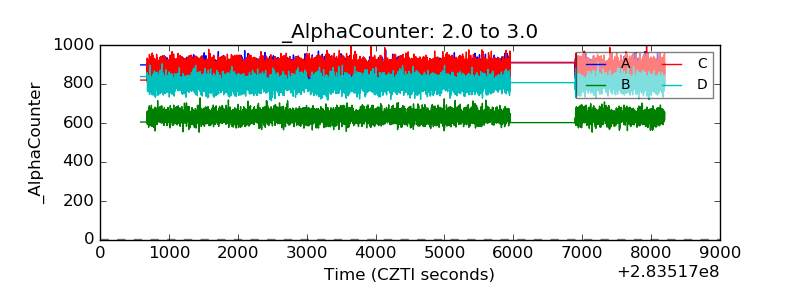 |
| _CPM_Rate | 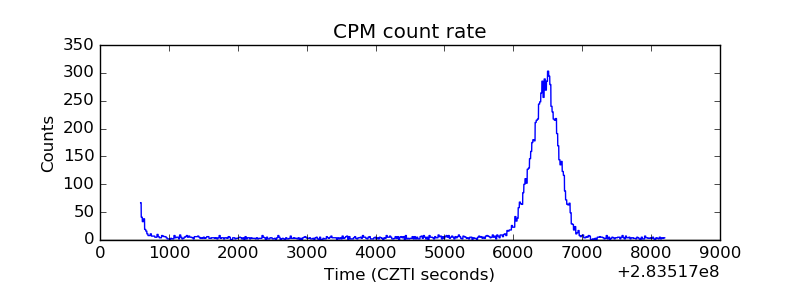 |
| CZT Counter | 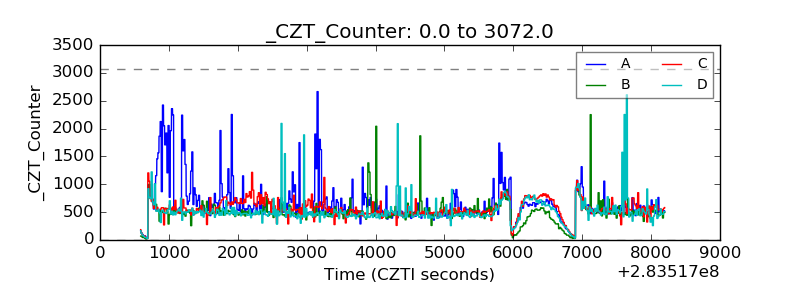 |
| +2.5 Volts monitor | 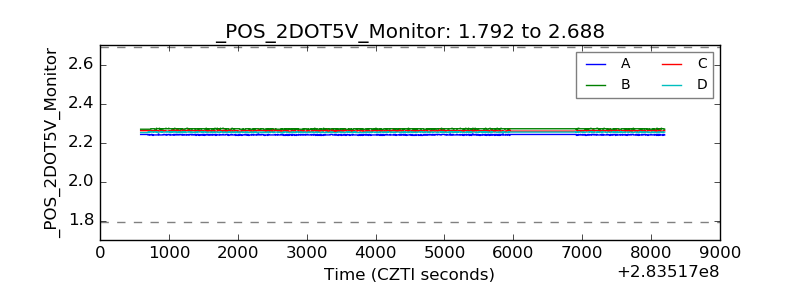 |
| +5 Volts monitor | 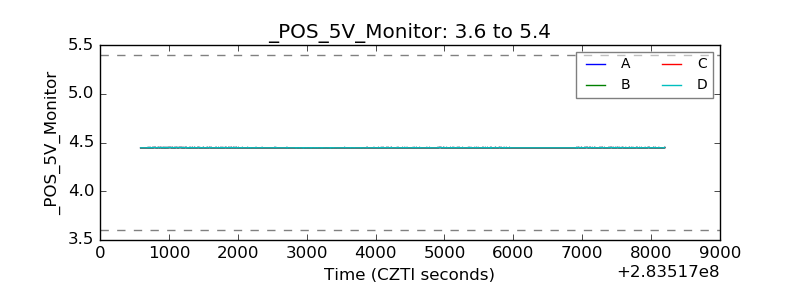 |
| _ROLL_ROT | 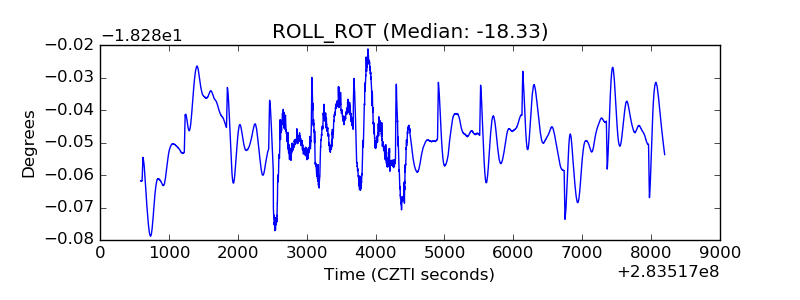 |
| _Roll_DEC | 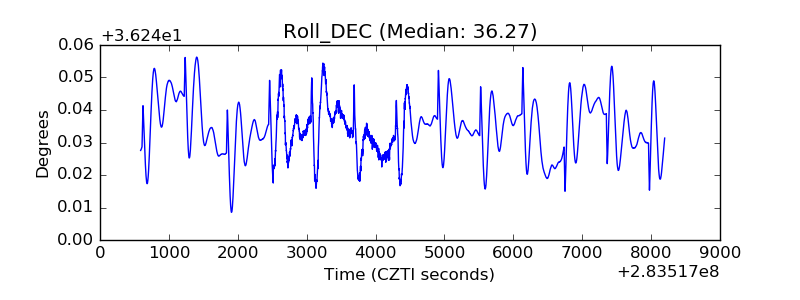 |
| _Roll_RA | 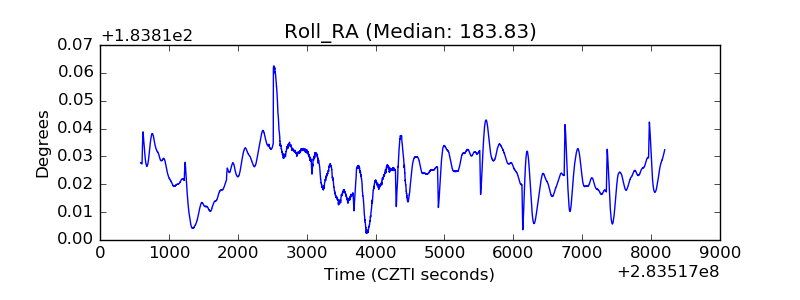 |
| Veto Counter | 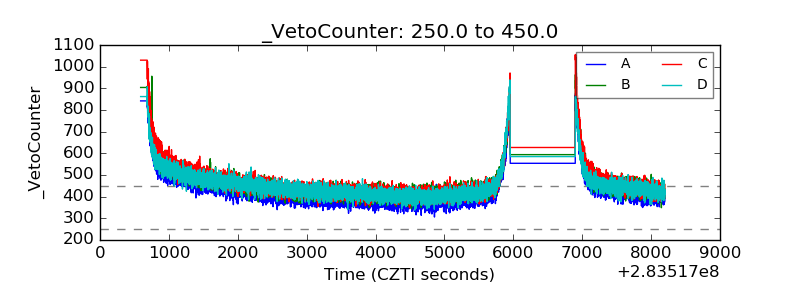 |