| Param | Original file | Final file |
|---|---|---|
| Filename | modeM0/AS1T03_066T01_9000002600_17546cztM0_level2.evt | modeM0/AS1T03_066T01_9000002600_17546cztM0_level2_quad_clean.evt |
| Size (bytes) | 551,692,800 | 76,550,400 |
| Size | 526.1 MB | 73.0 MB |
| Events in quadrant A | 4,163,155 | 460,642 |
| Events in quadrant B | 3,933,433 | 466,929 |
| Events in quadrant C | 4,285,620 | 445,572 |
| Events in quadrant D | 3,841,720 | 447,549 |
| Mode M9 | |||
|---|---|---|---|
| Quadrant | BADHDUFLAG | Total packets | Discarded packets |
| A | 0 | 6 | 0 |
| B | 0 | 6 | 0 |
| C | 0 | 6 | 0 |
| D | 0 | 6 | 0 |
| Mode SS | |||
|---|---|---|---|
| Quadrant | BADHDUFLAG | Total packets | Discarded packets |
| A | 0 | 146 | 0 |
| B | 0 | 146 | 0 |
| C | 0 | 146 | 0 |
| D | 0 | 146 | 0 |
| Mode M0 | |||
|---|---|---|---|
| Quadrant | BADHDUFLAG | Total packets | Discarded packets |
| A | 0 | 16897 | 1 |
| B | 0 | 16187 | 1 |
| C | 0 | 17074 | 1 |
| D | 0 | 16050 | 1 |
| Quadrant | Total seconds | Saturated seconds | Saturation percentage |
|---|---|---|---|
| A | 7132 | 173 | 2.425687% |
| B | 7133 | 199 | 2.789850% |
| C | 7133 | 247 | 3.462779% |
| D | 7133 | 138 | 1.934670% |
Noise dominated data is calculated using 1-second bins in cleaned event files. If a bin has >2000 counts, and if more than 50% of those come from <1% of pixels, then it is considered to be noise-dominated and hence unusable.
| Quadrant | # 1 sec bins | Bins with >0 counts | Bins with >2000 counts | High rate bins dominated by noise | Noise dominated (total time) | Noise dominated (detector-on time) | Marked lightcurve |
|---|---|---|---|---|---|---|---|
| A | 7782 | 7133 | 59 | 59 | 0.76% | 0.83% | 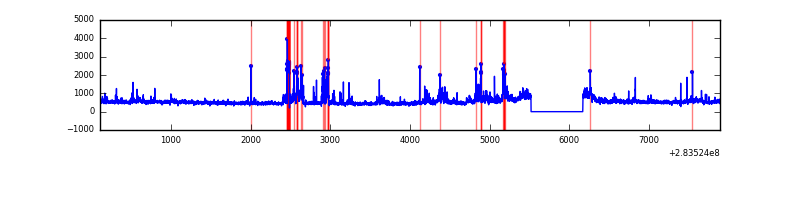 |
| B | 7783 | 7133 | 49 | 49 | 0.63% | 0.69% | 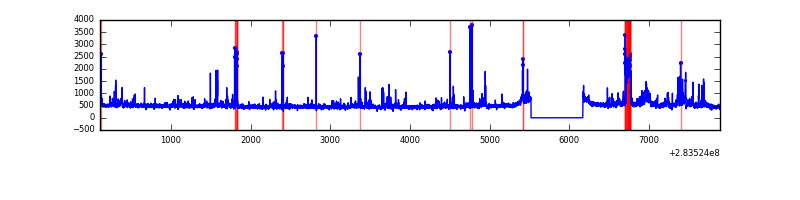 |
| C | 7783 | 7133 | 89 | 89 | 1.14% | 1.25% | 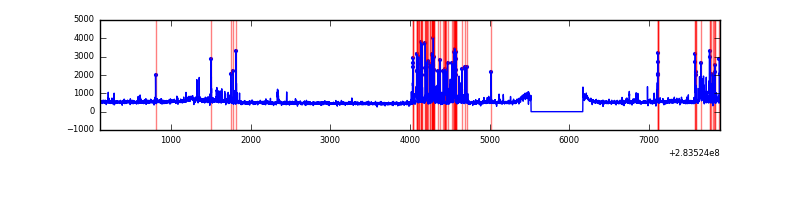 |
| D | 7783 | 7133 | 58 | 58 | 0.75% | 0.81% | 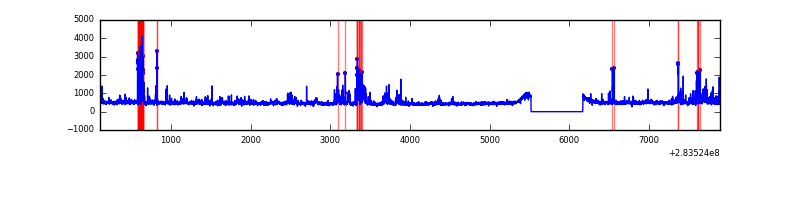 |
Top three noisy pixels from each quadrant. If the there are fewer than three noisy pixels in the level2.evt file, extra rows are filled as -1
| Pixel properties | Quadrant properties | ||||||
|---|---|---|---|---|---|---|---|
| Quadrant | DetID | PixID | Counts | Sigma | Mean | Median | Sigma |
| A | 14 | 237 | 499901 | 2856.98 | 870 | 851 | 174.7 |
| A | 15 | 174 | 320073 | 1827.49 | 870 | 851 | 174.7 |
| A | 0 | 226 | 7536 | 38.27 | 870 | 851 | 174.7 |
| B | 10 | 245 | 475736 | 2877.57 | 863 | 841 | 165.0 |
| B | 0 | 244 | 21020 | 122.27 | 863 | 841 | 165.0 |
| B | 12 | 111 | 19726 | 114.43 | 863 | 841 | 165.0 |
| C | 0 | 79 | 584669 | 3007.63 | 830 | 835 | 194.1 |
| C | 3 | 233 | 296499 | 1523.12 | 830 | 835 | 194.1 |
| C | 14 | 238 | 125926 | 644.41 | 830 | 835 | 194.1 |
| D | 5 | 222 | 485791 | 2349.91 | 847 | 823 | 206.4 |
| D | 13 | 189 | 80215 | 384.69 | 847 | 823 | 206.4 |
| D | 2 | 234 | 26265 | 123.28 | 847 | 823 | 206.4 |
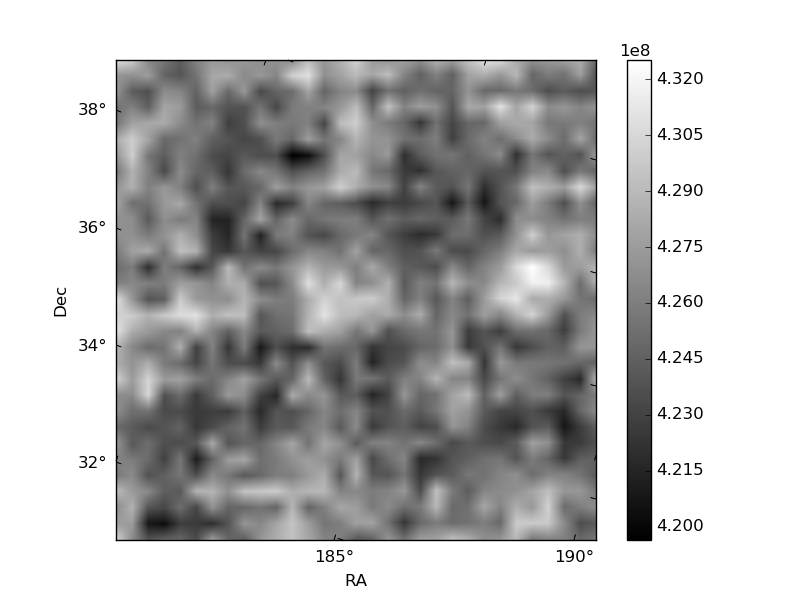
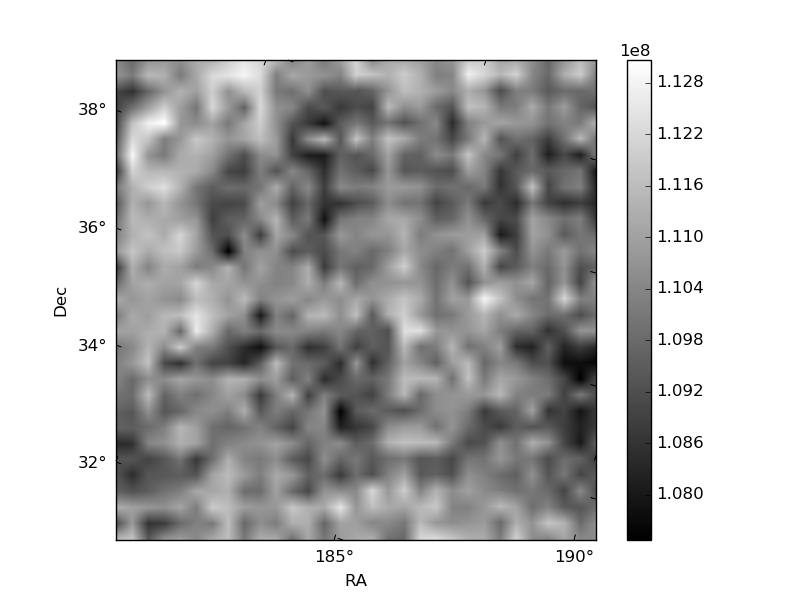
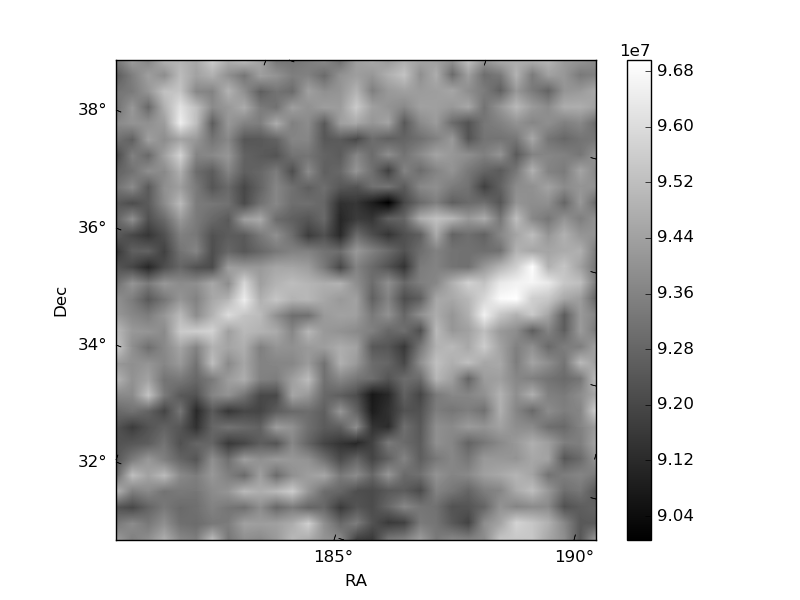
Histogram calculated using DETX and DETY for each event in the final _common_clean file
| Quadrant A | 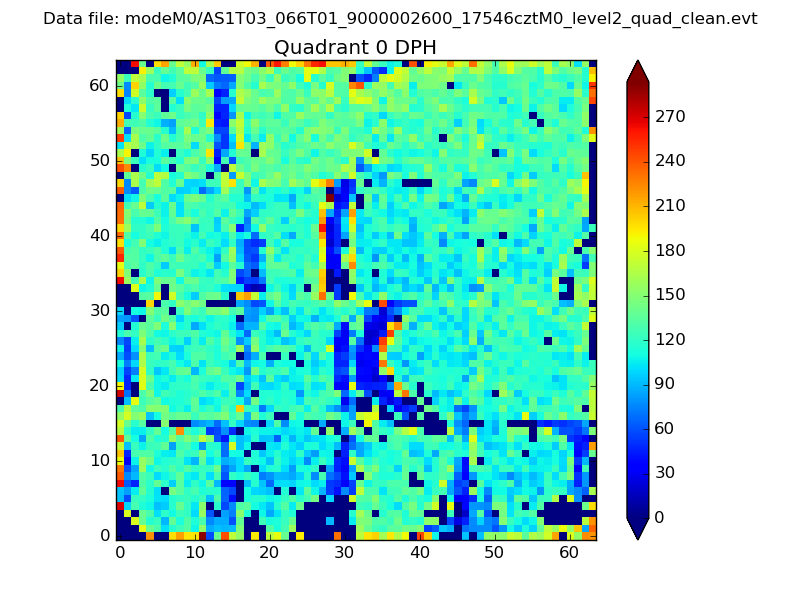 |
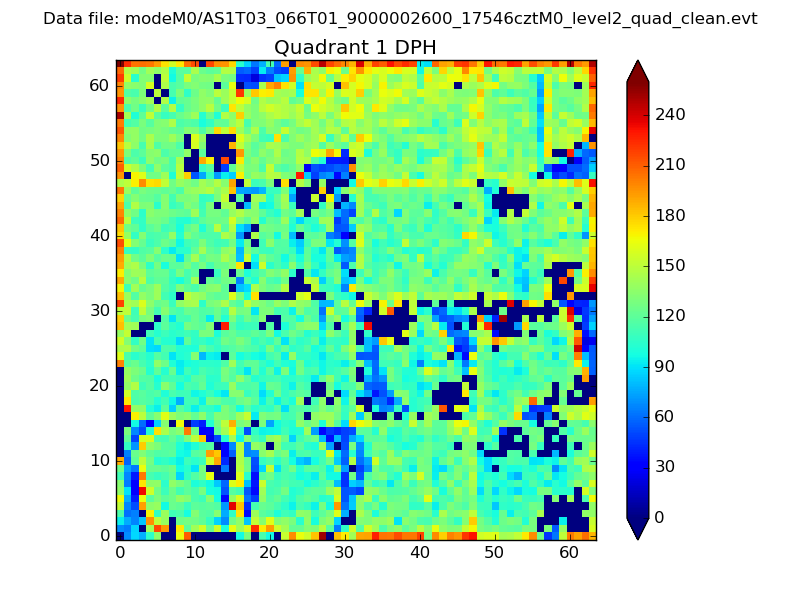 |
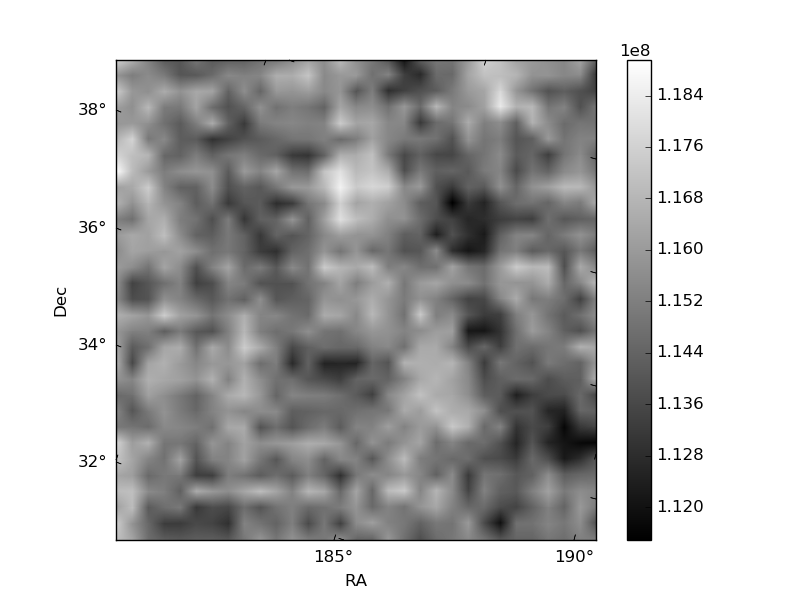
Quadrant B |
|---|---|---|---|
| Quadrant D | 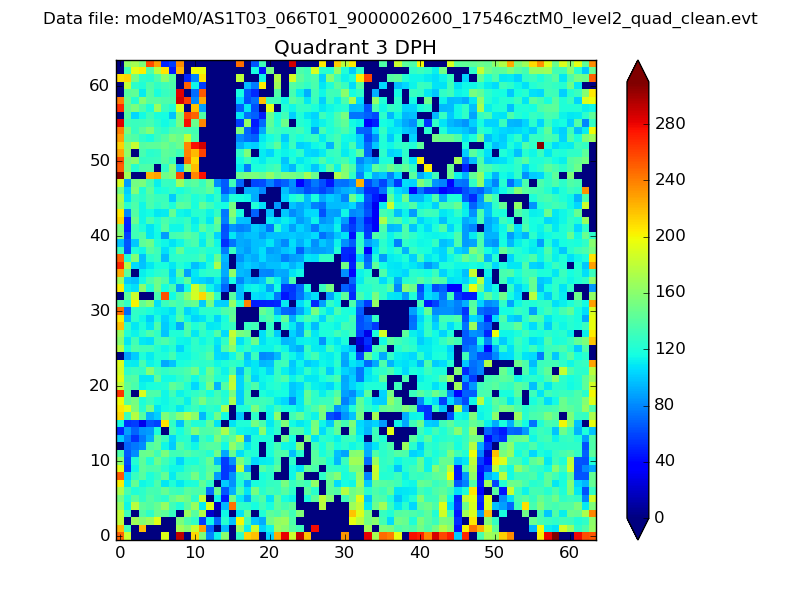 |
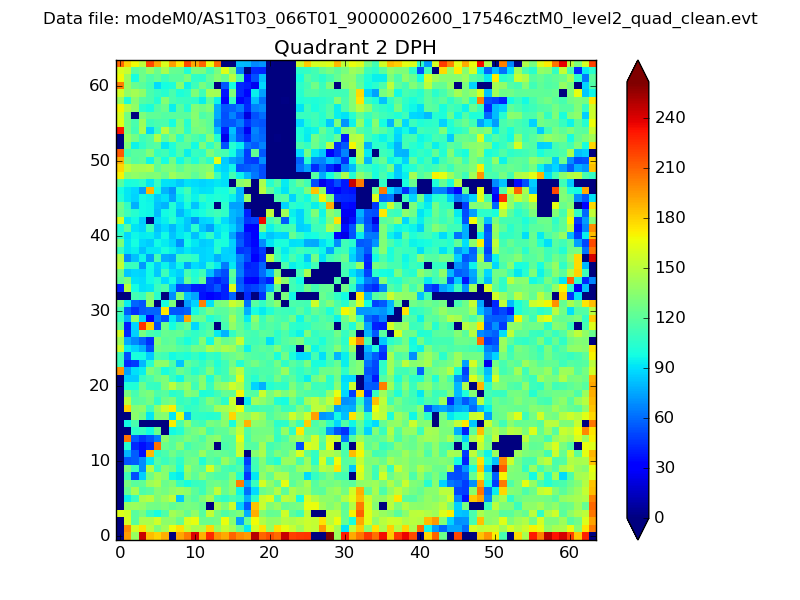 |
Quadrant C |
| Plot type | Count rate plots | Images |
|---|---|---|
| Comparison with Poisson distribution Blue bars denote a histogram of data divided into 1 sec bins. Red curve is a Poisson curve with rate = median count rate of data. |
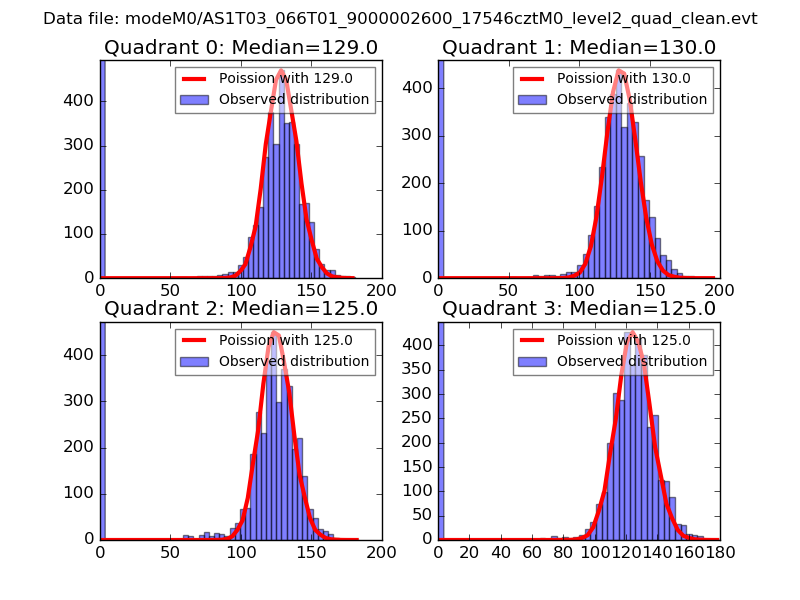 |
 |
| Quadrant-wise count rates Data is divided into 100 sec bins |
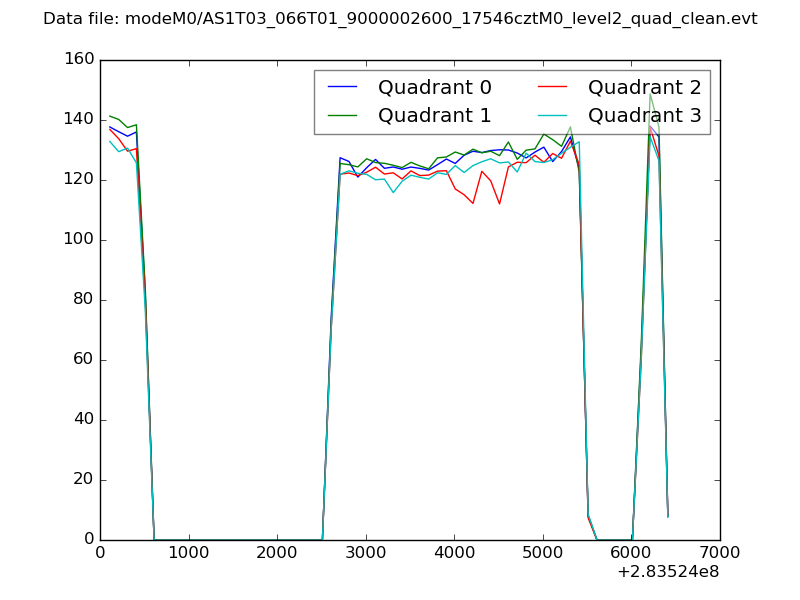 |
|
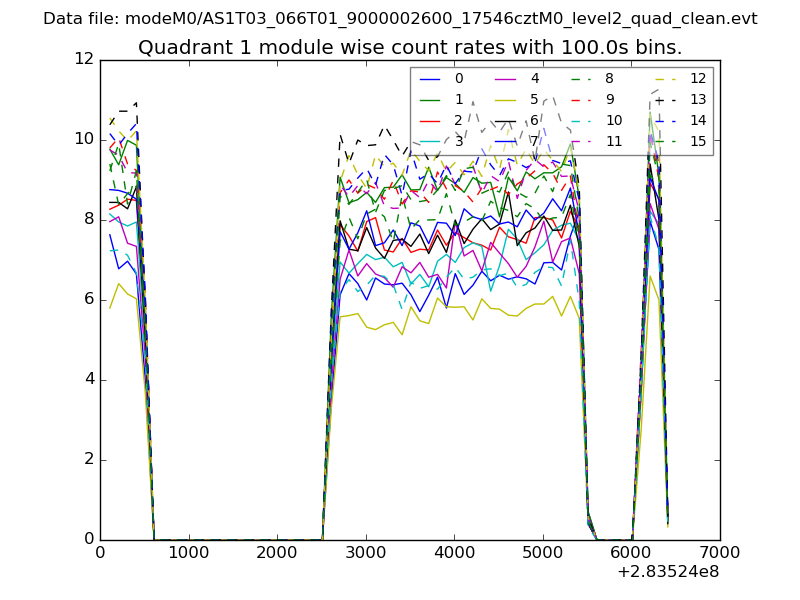
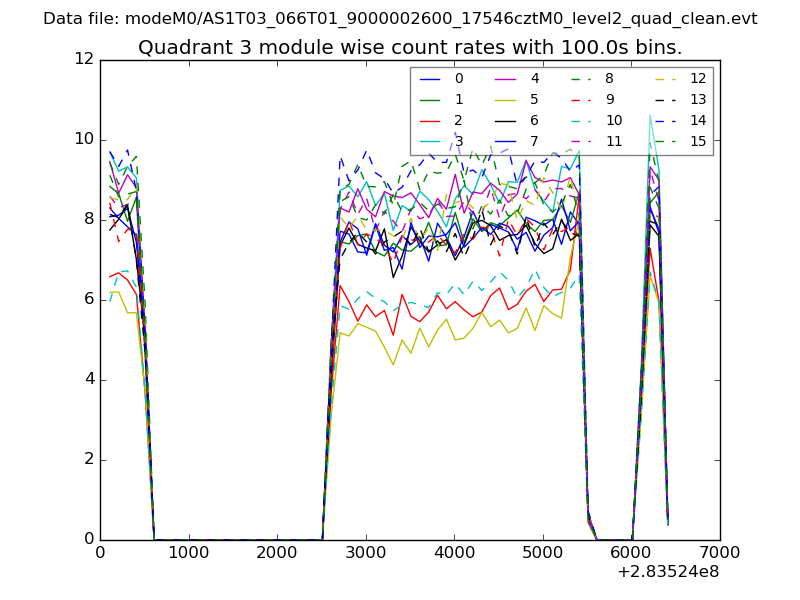
| Module-wise count rates for Quadrant A Data is divided into 100 sec bins |
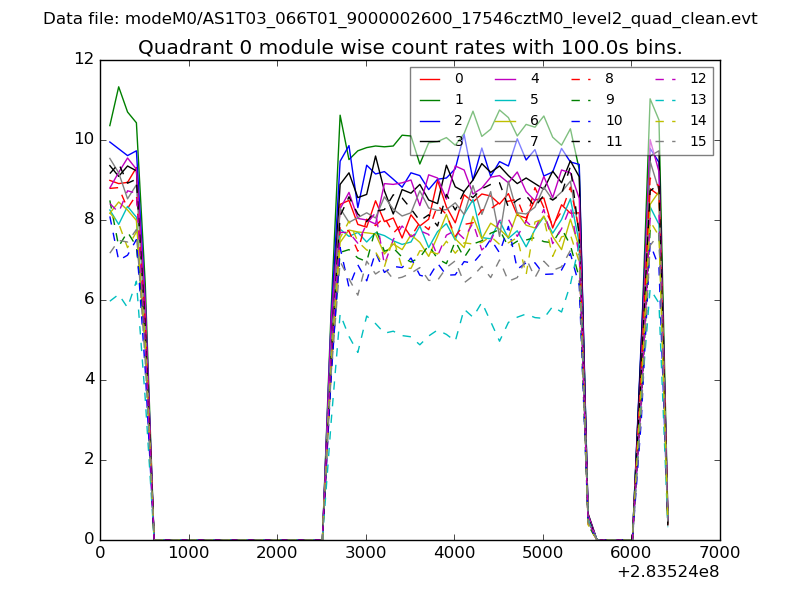 |
 |
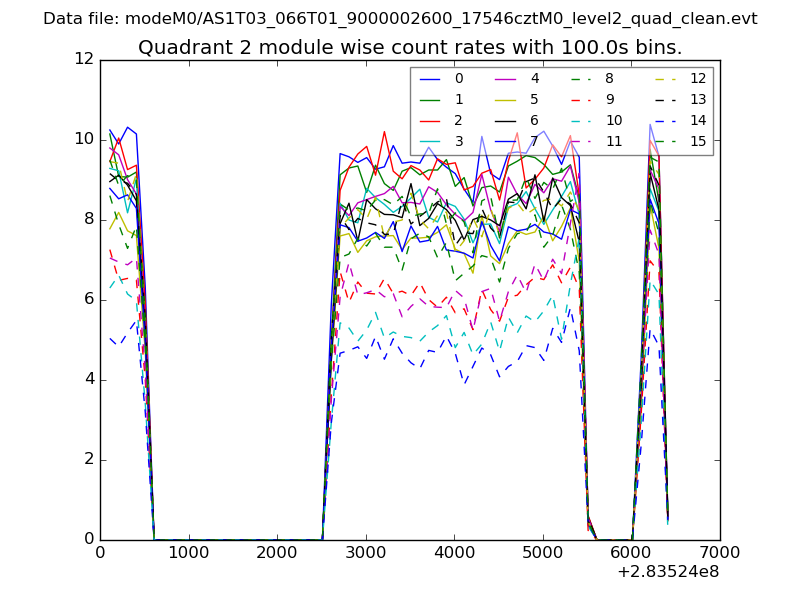
| Module-wise count rates for Quadrant B Data is divided into 100 sec bins |
 |
 |
| Module-wise count rates for Quadrant C Data is divided into 100 sec bins |
 |
 |
| Module-wise count rates for Quadrant D Data is divided into 100 sec bins |
 |
 |
| Parameter | Plot |
|---|---|
| CZT HV Monitor | 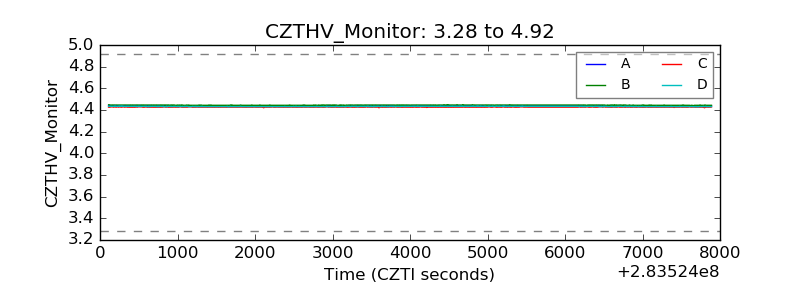 |
| D_VDD | 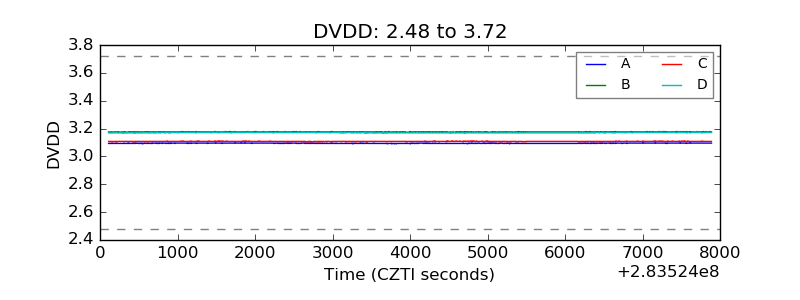 |
| Temperature 1 | 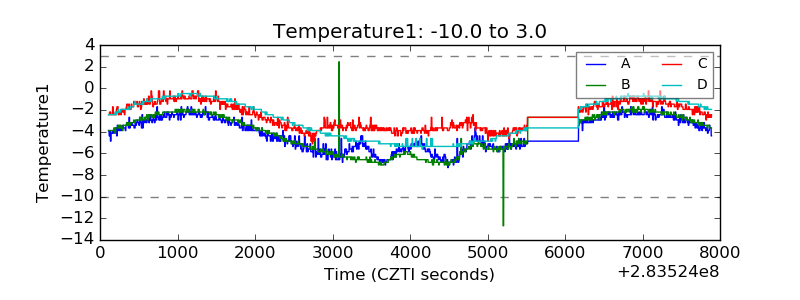 |
| Veto HV Monitor | 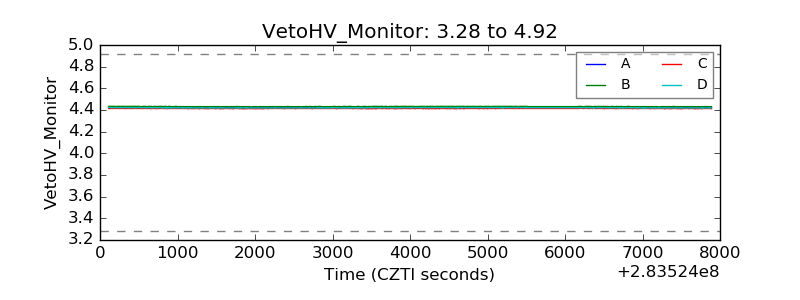 |
| Veto LLD | 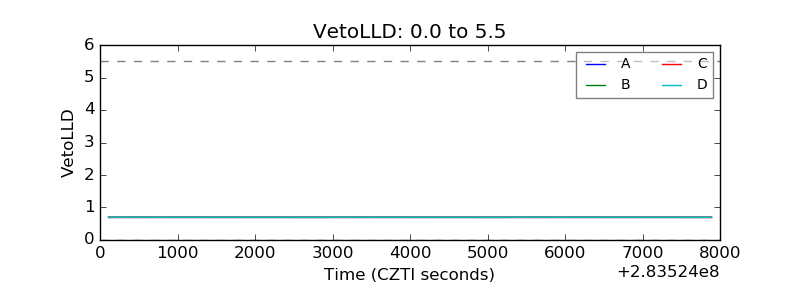 |
| Alpha Counter | 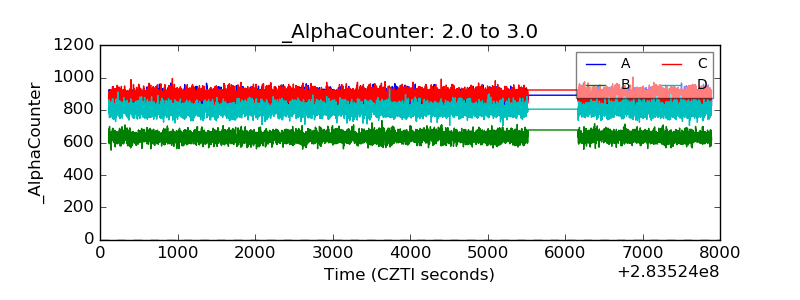 |
| _CPM_Rate | 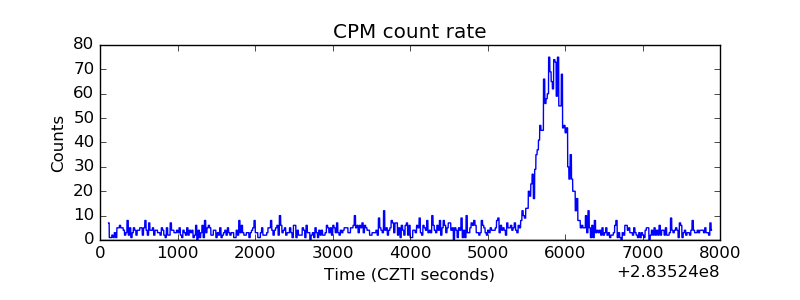 |
| CZT Counter | 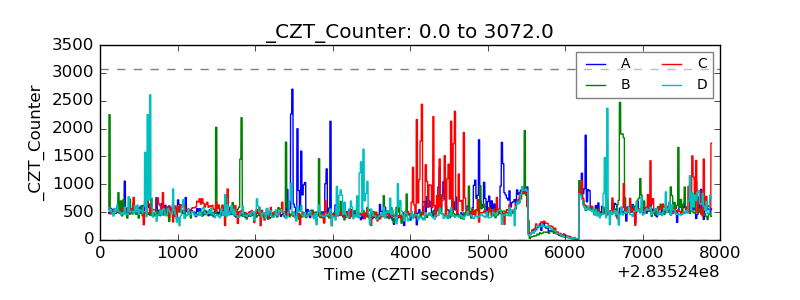 |
| +2.5 Volts monitor |  |
| +5 Volts monitor |  |
| _ROLL_ROT |  |
| _Roll_DEC | 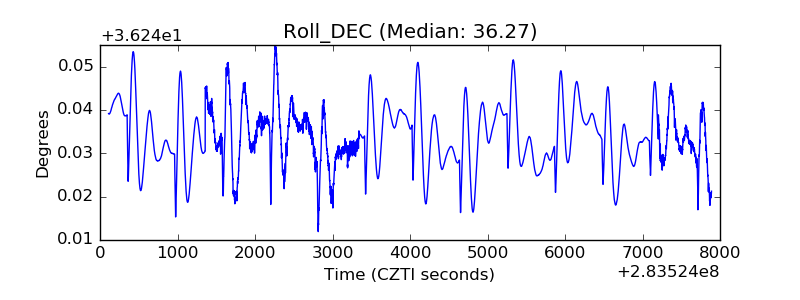 |
| _Roll_RA | 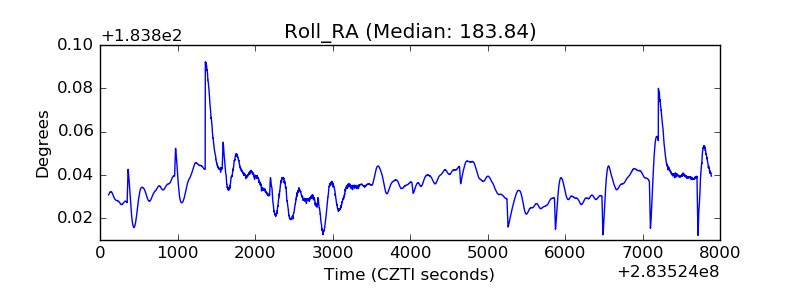 |
| Veto Counter | 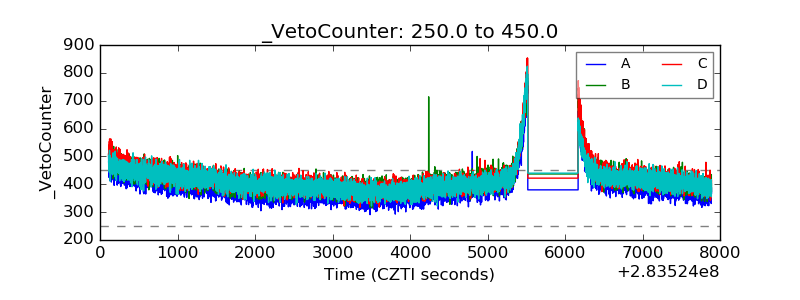 |