| Param | Original file | Final file |
|---|---|---|
| Filename | modeM0/AS1T03_066T01_9000002600_17547cztM0_level2.evt | modeM0/AS1T03_066T01_9000002600_17547cztM0_level2_quad_clean.evt |
| Size (bytes) | 587,148,480 | 72,599,040 |
| Size | 559.9 MB | 69.2 MB |
| Events in quadrant A | 3,971,481 | 444,543 |
| Events in quadrant B | 4,962,615 | 411,675 |
| Events in quadrant C | 4,541,889 | 430,610 |
| Events in quadrant D | 3,839,257 | 431,518 |
| Mode M9 | |||
|---|---|---|---|
| Quadrant | BADHDUFLAG | Total packets | Discarded packets |
| A | 0 | 3 | 0 |
| B | 0 | 3 | 0 |
| C | 0 | 3 | 0 |
| D | 0 | 3 | 0 |
| Mode SS | |||
|---|---|---|---|
| Quadrant | BADHDUFLAG | Total packets | Discarded packets |
| A | 0 | 140 | 0 |
| B | 0 | 140 | 0 |
| C | 0 | 140 | 0 |
| D | 0 | 140 | 0 |
| Mode M0 | |||
|---|---|---|---|
| Quadrant | BADHDUFLAG | Total packets | Discarded packets |
| A | 0 | 16281 | 1 |
| B | 0 | 19210 | 1 |
| C | 0 | 17936 | 2 |
| D | 0 | 16162 | 1 |
| Quadrant | Total seconds | Saturated seconds | Saturation percentage |
|---|---|---|---|
| A | 6880 | 152 | 2.209302% |
| B | 6881 | 724 | 10.521726% |
| C | 6880 | 366 | 5.319767% |
| D | 6880 | 141 | 2.049419% |
Noise dominated data is calculated using 1-second bins in cleaned event files. If a bin has >2000 counts, and if more than 50% of those come from <1% of pixels, then it is considered to be noise-dominated and hence unusable.
| Quadrant | # 1 sec bins | Bins with >0 counts | Bins with >2000 counts | High rate bins dominated by noise | Noise dominated (total time) | Noise dominated (detector-on time) | Marked lightcurve |
|---|---|---|---|---|---|---|---|
| A | 7200 | 6881 | 34 | 34 | 0.47% | 0.49% | 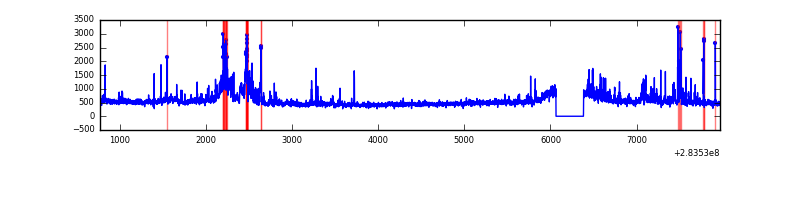 |
| B | 7201 | 6881 | 484 | 484 | 6.72% | 7.03% | 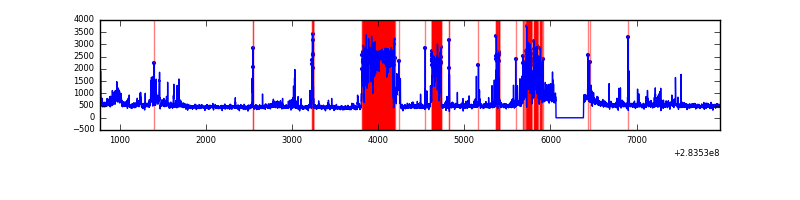 |
| C | 7200 | 6880 | 137 | 137 | 1.90% | 1.99% | 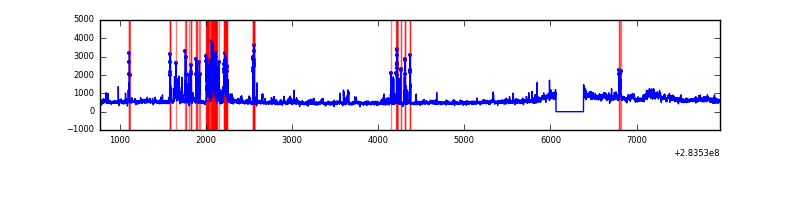 |
| D | 7200 | 6881 | 52 | 52 | 0.72% | 0.76% | 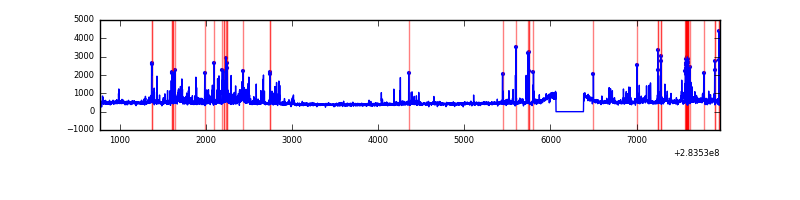 |
Top three noisy pixels from each quadrant. If the there are fewer than three noisy pixels in the level2.evt file, extra rows are filled as -1
| Pixel properties | Quadrant properties | ||||||
|---|---|---|---|---|---|---|---|
| Quadrant | DetID | PixID | Counts | Sigma | Mean | Median | Sigma |
| A | 14 | 237 | 505707 | 2956.72 | 832 | 813 | 170.8 |
| A | 15 | 174 | 264741 | 1545.59 | 832 | 813 | 170.8 |
| A | 0 | 226 | 7402 | 38.59 | 832 | 813 | 170.8 |
| B | 10 | 245 | 1749989 | 11285.4 | 801 | 780 | 155.0 |
| B | 0 | 219 | 19884 | 123.25 | 801 | 780 | 155.0 |
| B | 12 | 111 | 18102 | 111.76 | 801 | 780 | 155.0 |
| C | 3 | 233 | 707229 | 3811.21 | 787 | 791 | 185.4 |
| C | 0 | 79 | 615784 | 3317.87 | 787 | 791 | 185.4 |
| C | 14 | 238 | 119737 | 641.71 | 787 | 791 | 185.4 |
| D | 5 | 222 | 535429 | 2714.95 | 811 | 786 | 196.9 |
| D | 10 | 70 | 102987 | 518.98 | 811 | 786 | 196.9 |
| D | 13 | 189 | 78501 | 394.64 | 811 | 786 | 196.9 |
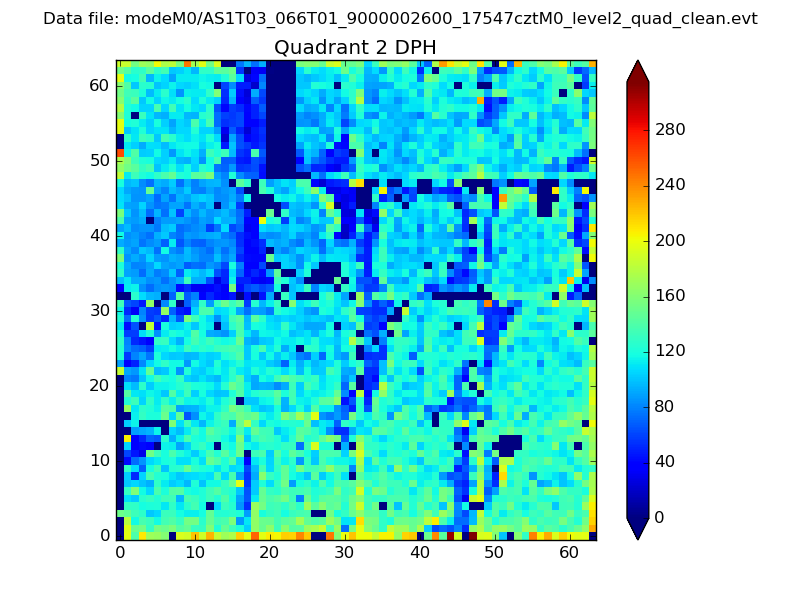
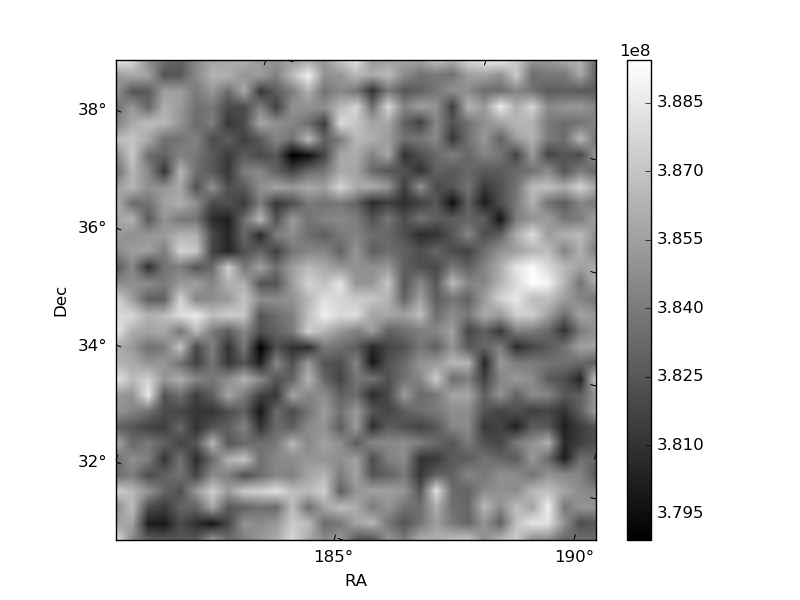
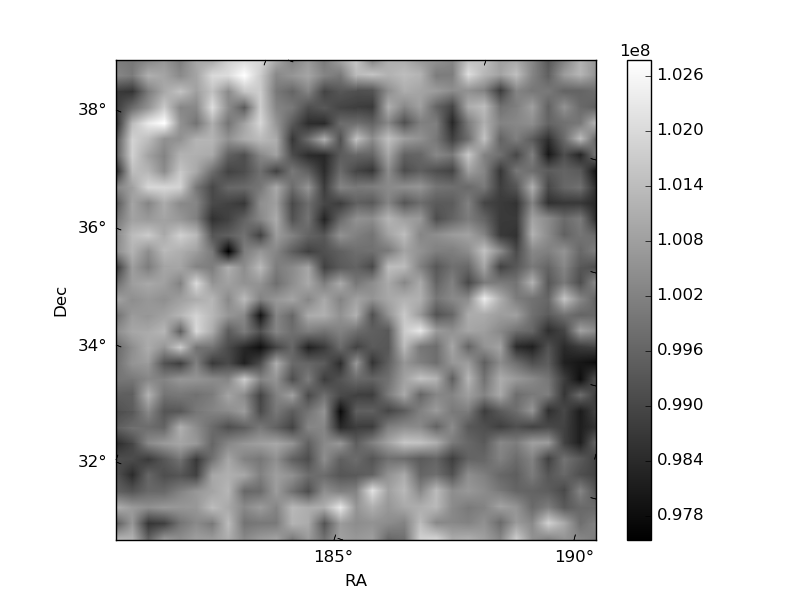
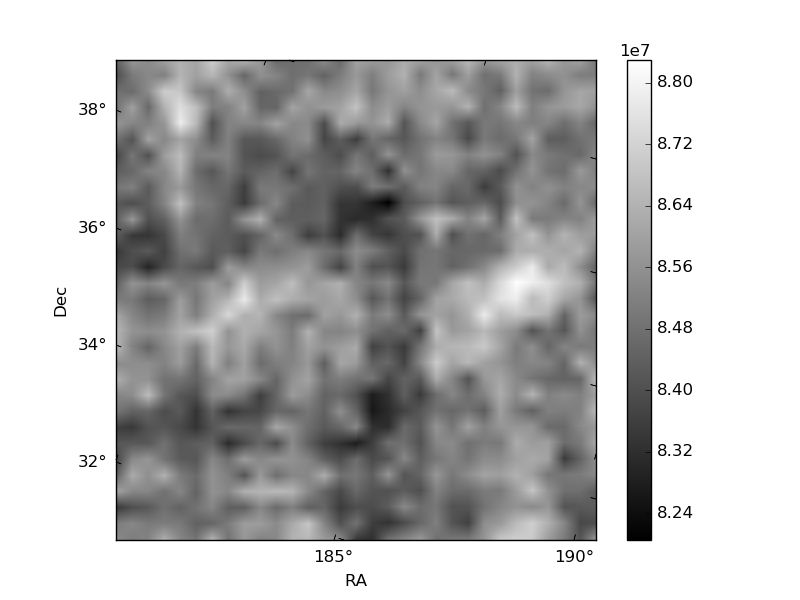
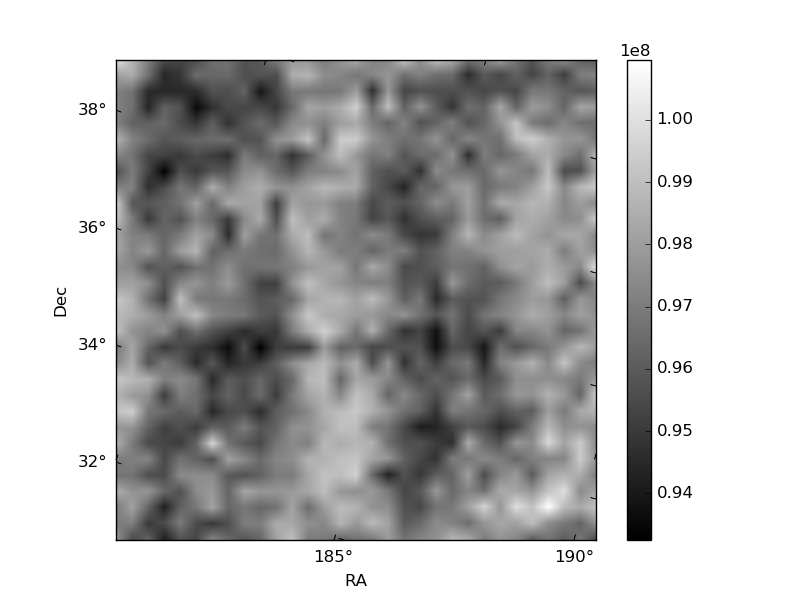
Histogram calculated using DETX and DETY for each event in the final _common_clean file
| Quadrant A | 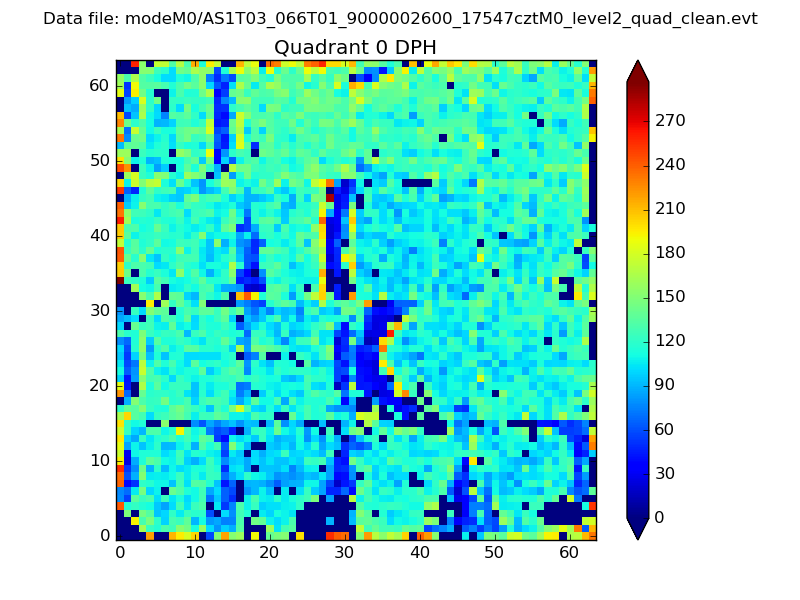 |
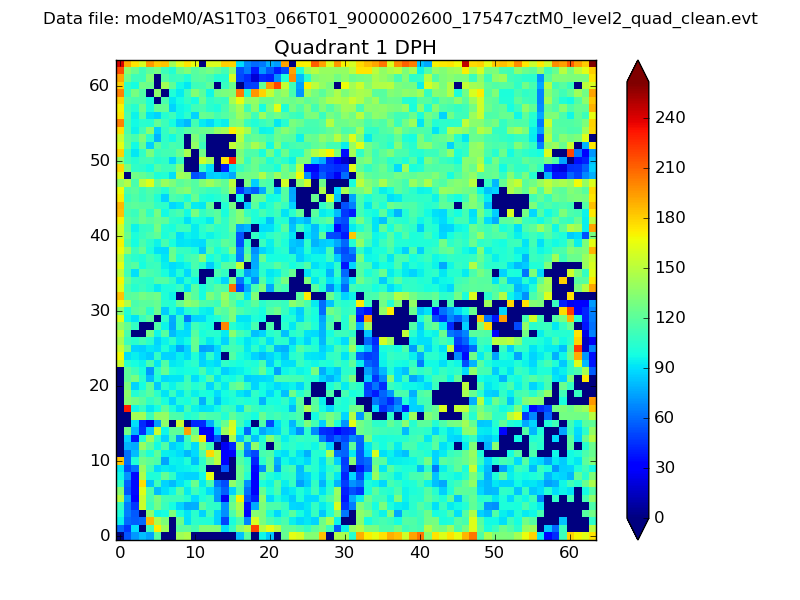 |
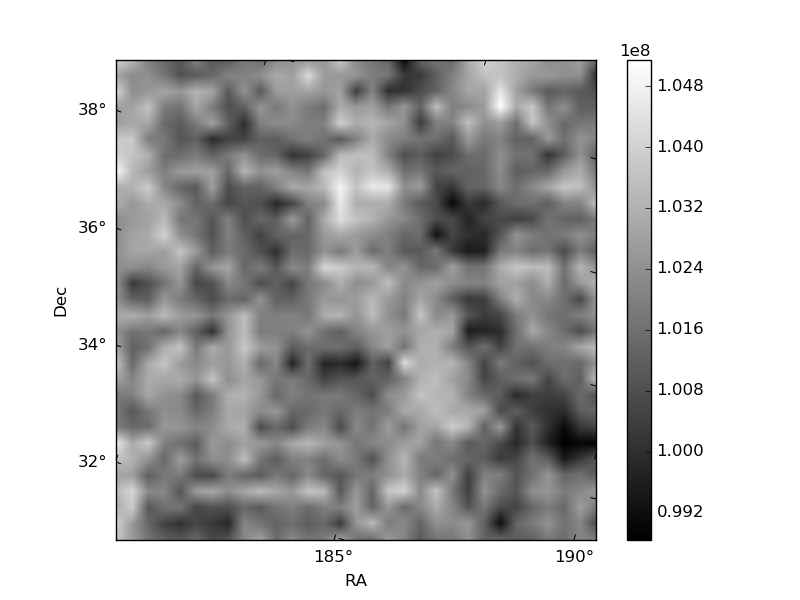
Quadrant B |
|---|---|---|---|
| Quadrant D | 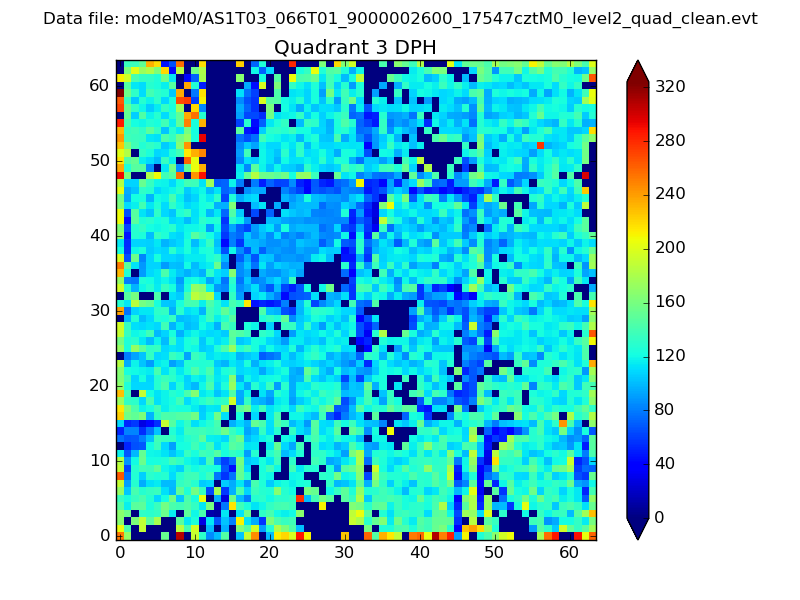 |
 |
Quadrant C |
| Plot type | Count rate plots | Images |
|---|---|---|
| Comparison with Poisson distribution Blue bars denote a histogram of data divided into 1 sec bins. Red curve is a Poisson curve with rate = median count rate of data. |
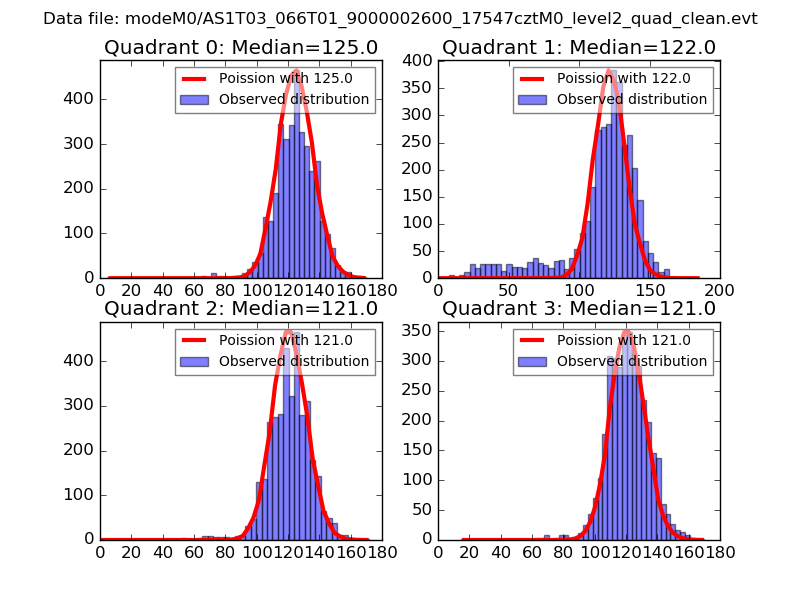 |
 |
| Quadrant-wise count rates Data is divided into 100 sec bins |
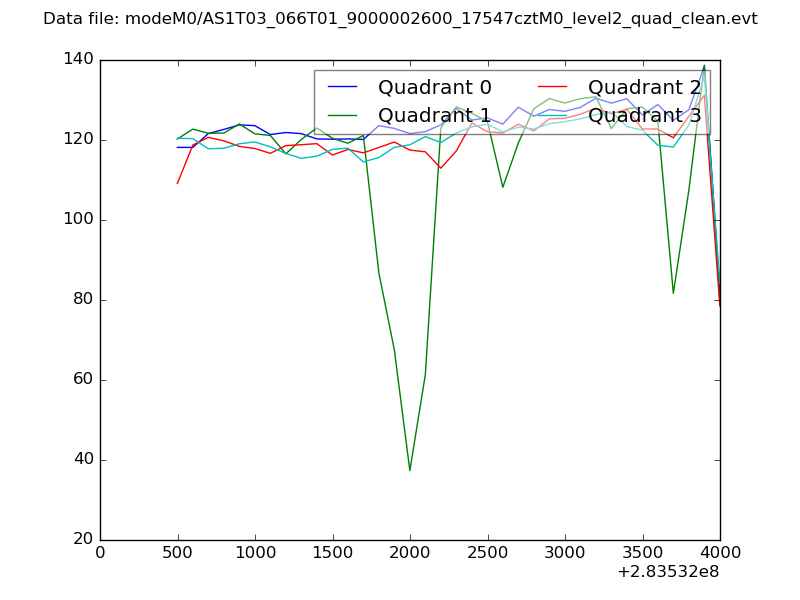 |
|
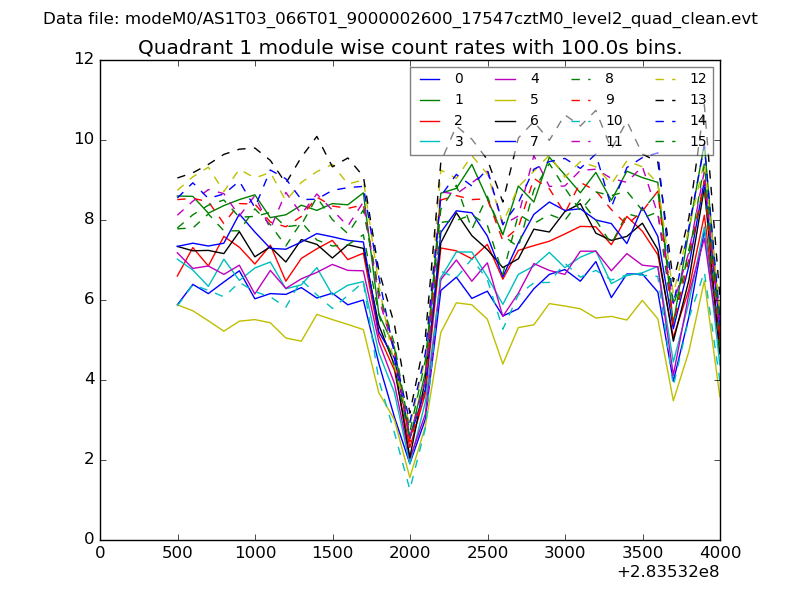
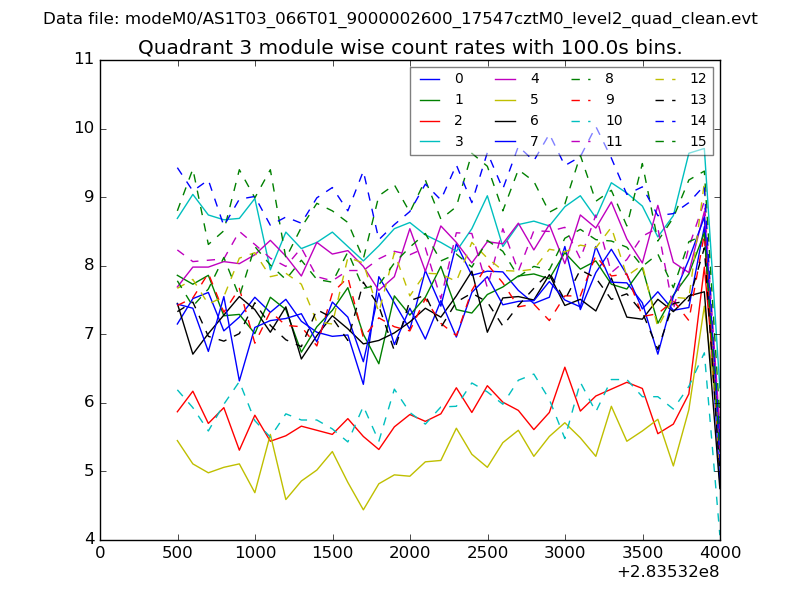
| Module-wise count rates for Quadrant A Data is divided into 100 sec bins |
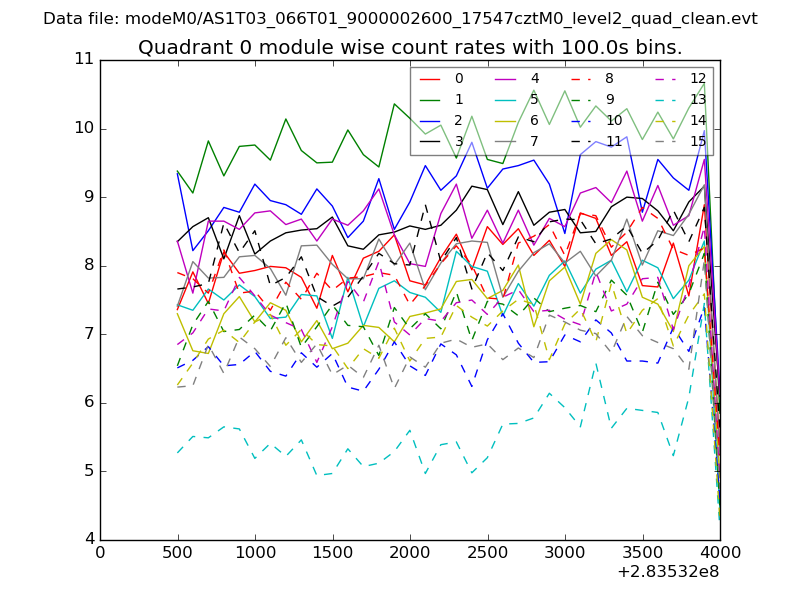 |
 |
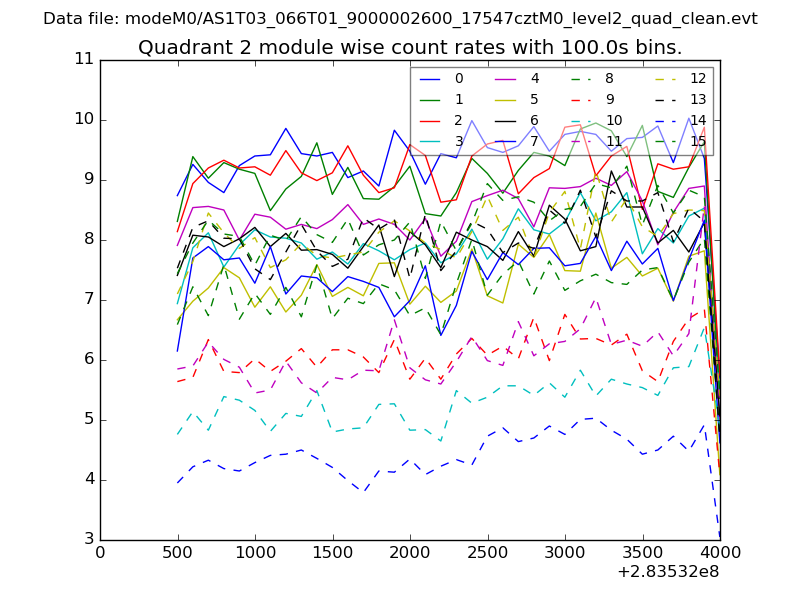
| Module-wise count rates for Quadrant B Data is divided into 100 sec bins |
 |
 |
| Module-wise count rates for Quadrant C Data is divided into 100 sec bins |
 |
 |
| Module-wise count rates for Quadrant D Data is divided into 100 sec bins |
 |
 |
| Parameter | Plot |
|---|---|
| CZT HV Monitor | 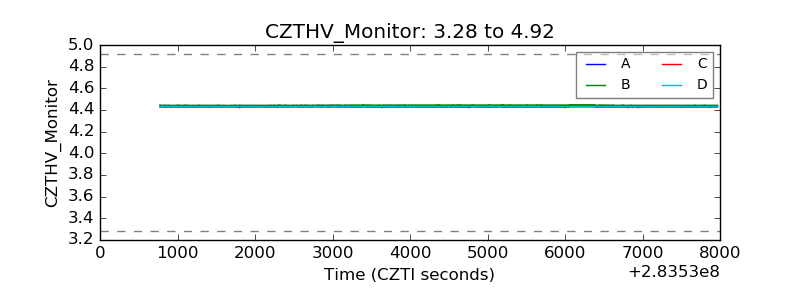 |
| D_VDD | 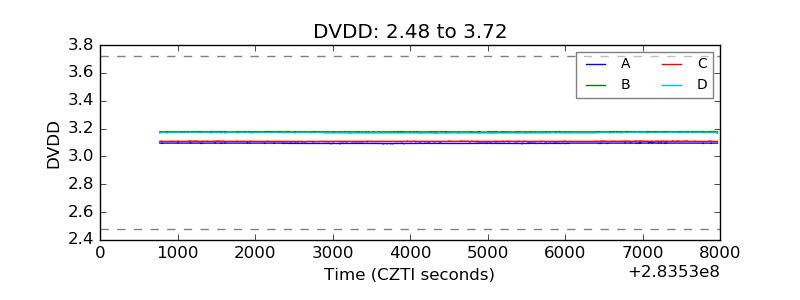 |
| Temperature 1 | 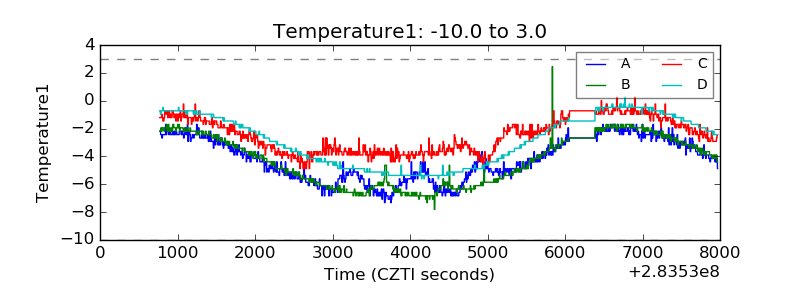 |
| Veto HV Monitor |  |
| Veto LLD | 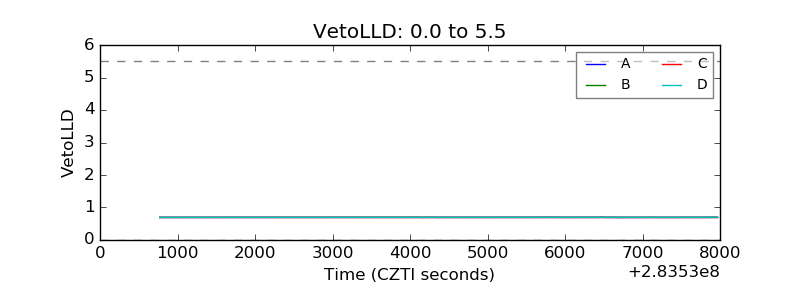 |
| Alpha Counter | 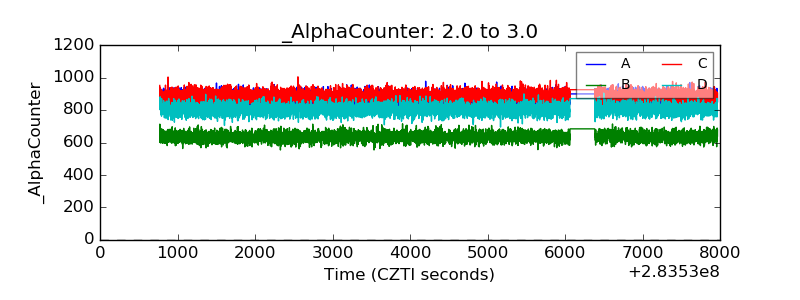 |
| _CPM_Rate | 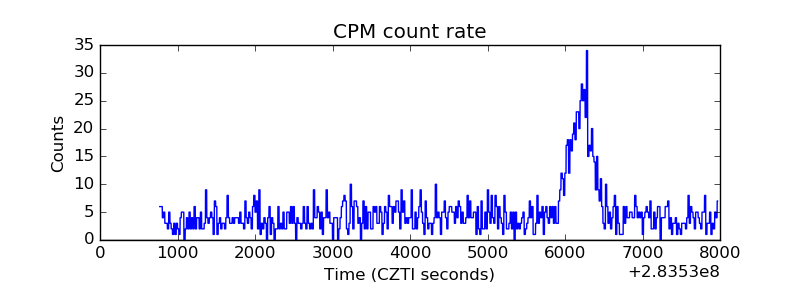 |
| CZT Counter | 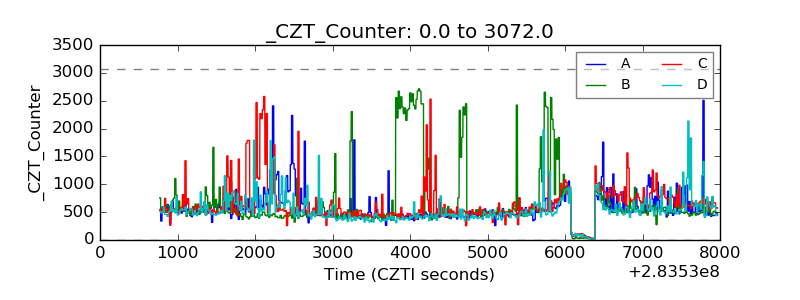 |
| +2.5 Volts monitor |  |
| +5 Volts monitor |  |
| _ROLL_ROT | 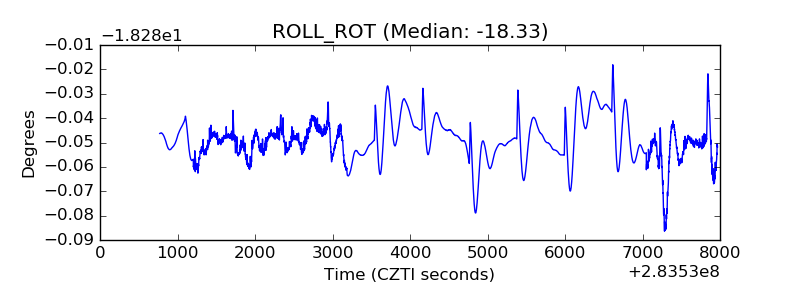 |
| _Roll_DEC |  |
| _Roll_RA | 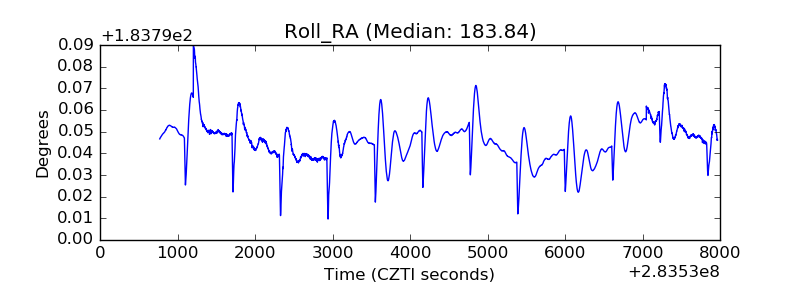 |
| Veto Counter | 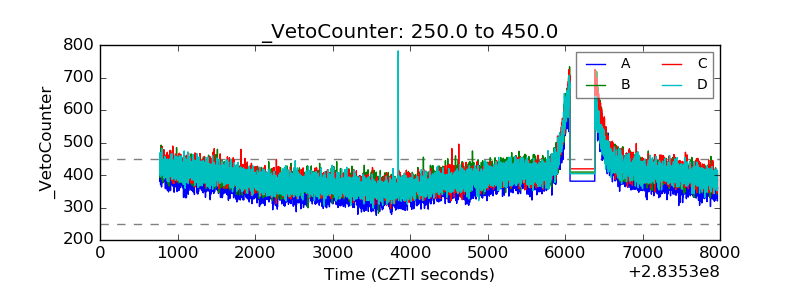 |