| Param | Original file | Final file |
|---|---|---|
| Filename | modeM0/AS1T03_066T01_9000002600_17548cztM0_level2.evt | modeM0/AS1T03_066T01_9000002600_17548cztM0_level2_quad_clean.evt |
| Size (bytes) | 617,227,200 | 77,469,120 |
| Size | 588.6 MB | 73.9 MB |
| Events in quadrant A | 3,976,345 | 470,924 |
| Events in quadrant B | 5,300,870 | 436,820 |
| Events in quadrant C | 4,585,246 | 455,754 |
| Events in quadrant D | 4,316,379 | 454,347 |
| Mode M9 | |||
|---|---|---|---|
| Quadrant | BADHDUFLAG | Total packets | Discarded packets |
| A | 0 | 6 | 0 |
| B | 0 | 6 | 0 |
| C | 0 | 6 | 0 |
| D | 0 | 6 | 0 |
| Mode SS | |||
|---|---|---|---|
| Quadrant | BADHDUFLAG | Total packets | Discarded packets |
| A | 0 | 156 | 0 |
| B | 0 | 156 | 0 |
| C | 0 | 156 | 0 |
| D | 0 | 156 | 0 |
| Mode M0 | |||
|---|---|---|---|
| Quadrant | BADHDUFLAG | Total packets | Discarded packets |
| A | 0 | 16877 | 3 |
| B | 0 | 20510 | 2 |
| C | 0 | 18558 | 2 |
| D | 0 | 17901 | 2 |
| Quadrant | Total seconds | Saturated seconds | Saturation percentage |
|---|---|---|---|
| A | 7580 | 188 | 2.480211% |
| B | 7580 | 697 | 9.195251% |
| C | 7581 | 239 | 3.152618% |
| D | 7581 | 234 | 3.086664% |
Noise dominated data is calculated using 1-second bins in cleaned event files. If a bin has >2000 counts, and if more than 50% of those come from <1% of pixels, then it is considered to be noise-dominated and hence unusable.
| Quadrant | # 1 sec bins | Bins with >0 counts | Bins with >2000 counts | High rate bins dominated by noise | Noise dominated (total time) | Noise dominated (detector-on time) | Marked lightcurve |
|---|---|---|---|---|---|---|---|
| A | 8200 | 7582 | 23 | 23 | 0.28% | 0.30% | 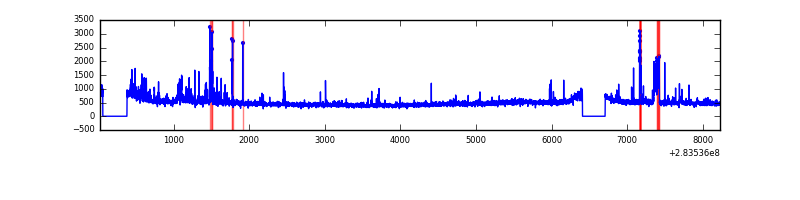 |
| B | 8200 | 7581 | 450 | 450 | 5.49% | 5.94% |  |
| C | 8201 | 7581 | 4 | 4 | 0.05% | 0.05% | 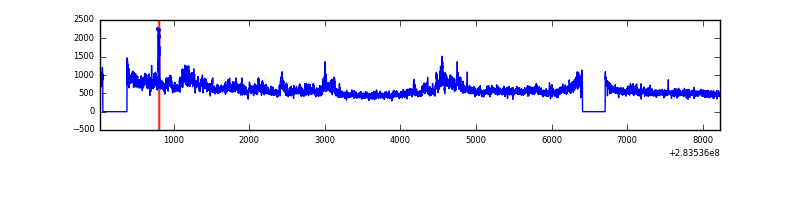 |
| D | 8201 | 7583 | 84 | 84 | 1.02% | 1.11% | 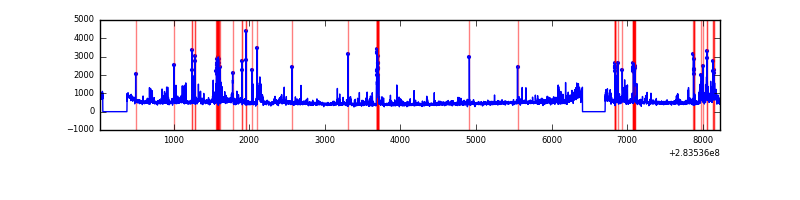 |
Top three noisy pixels from each quadrant. If the there are fewer than three noisy pixels in the level2.evt file, extra rows are filled as -1
| Pixel properties | Quadrant properties | ||||||
|---|---|---|---|---|---|---|---|
| Quadrant | DetID | PixID | Counts | Sigma | Mean | Median | Sigma |
| A | 14 | 237 | 334396 | 1758.64 | 926 | 904 | 189.6 |
| A | 15 | 174 | 78371 | 408.51 | 926 | 904 | 189.6 |
| A | 0 | 226 | 8189 | 38.42 | 926 | 904 | 189.6 |
| B | 10 | 245 | 1714266 | 9982.13 | 893 | 867 | 171.6 |
| B | 12 | 111 | 20501 | 114.39 | 893 | 867 | 171.6 |
| B | 5 | 172 | 18648 | 103.59 | 893 | 867 | 171.6 |
| C | 3 | 233 | 937696 | 4531.19 | 881 | 884 | 206.7 |
| C | 14 | 238 | 134481 | 646.18 | 881 | 884 | 206.7 |
| C | 5 | 218 | 39098 | 184.83 | 881 | 884 | 206.7 |
| D | 5 | 222 | 415182 | 1878.63 | 902 | 872 | 220.5 |
| D | 13 | 189 | 226572 | 1023.4 | 902 | 872 | 220.5 |
| D | 10 | 70 | 154769 | 697.82 | 902 | 872 | 220.5 |
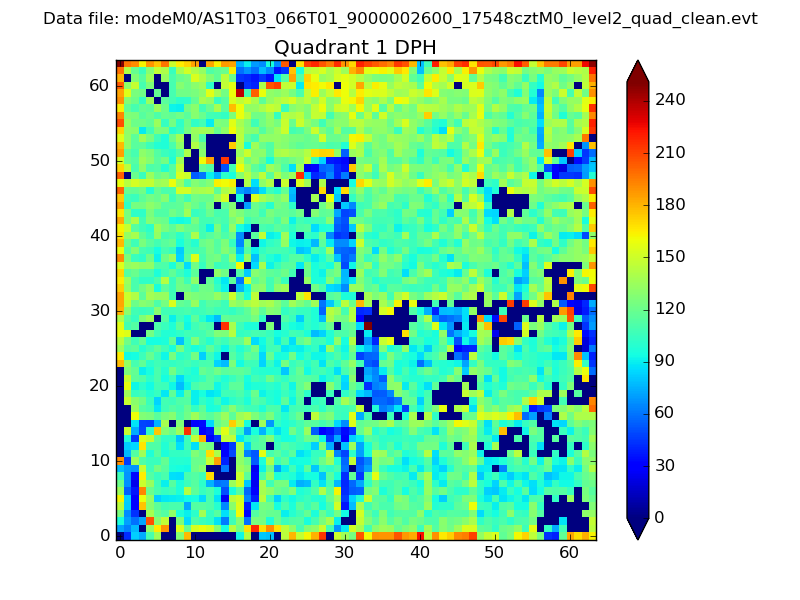
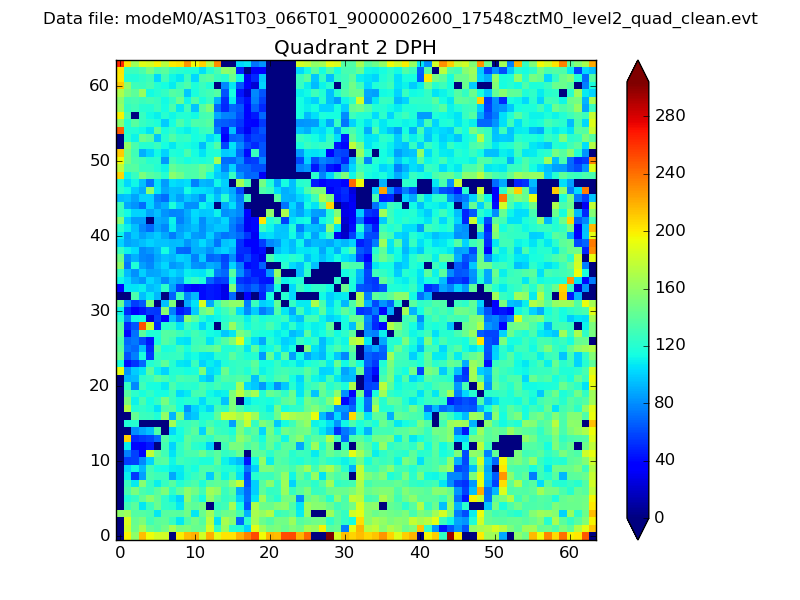
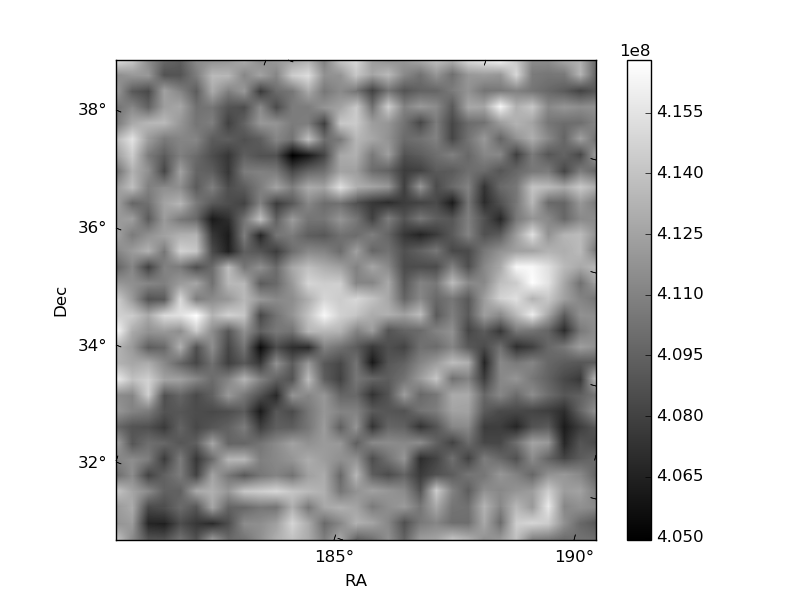
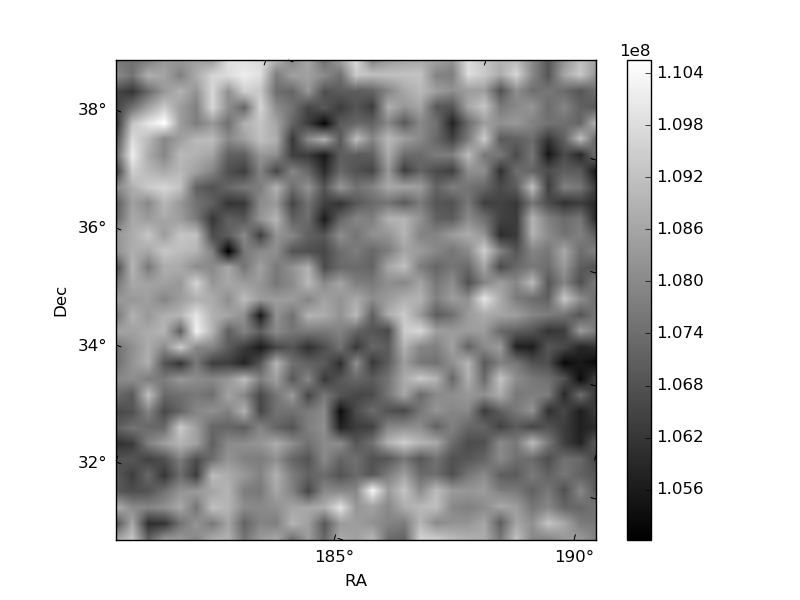
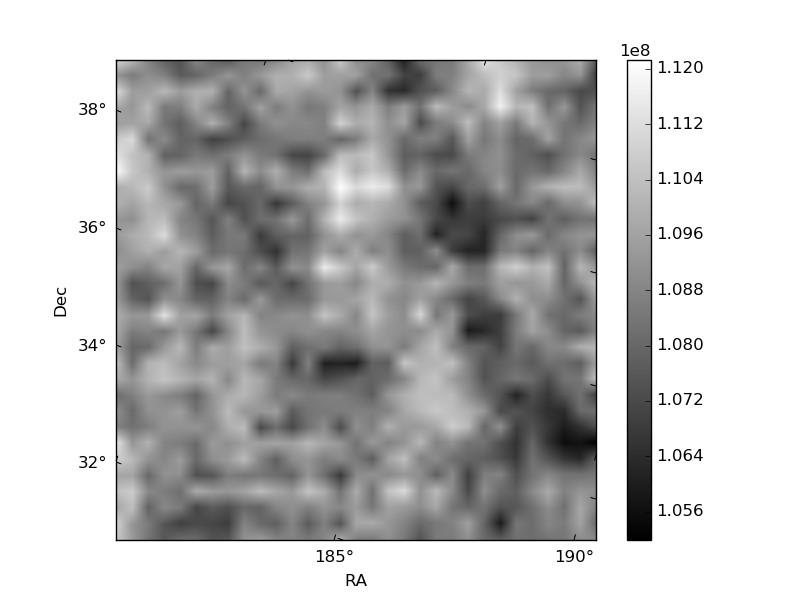
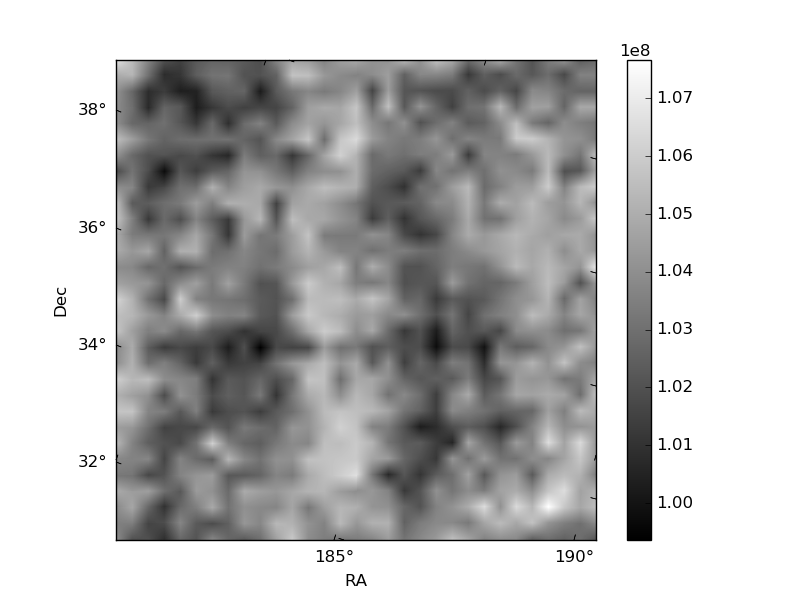
Histogram calculated using DETX and DETY for each event in the final _common_clean file
| Quadrant A | 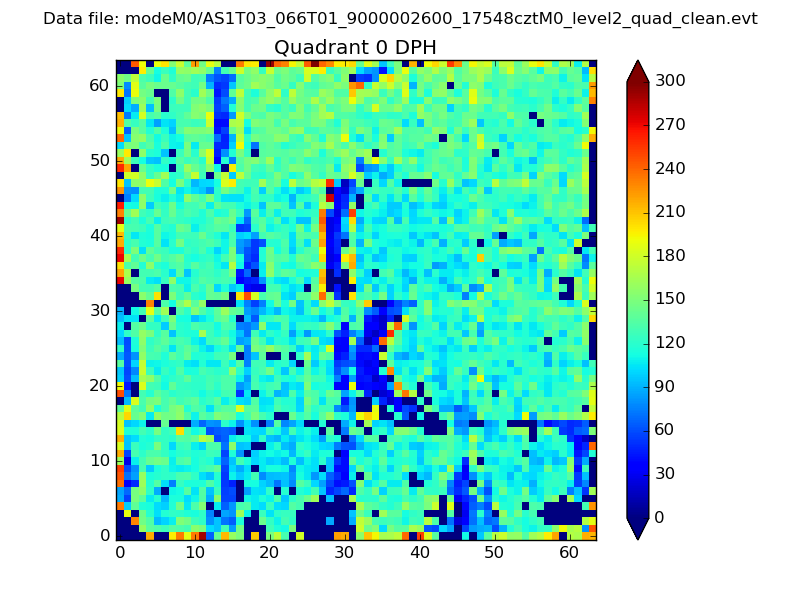 |
 |
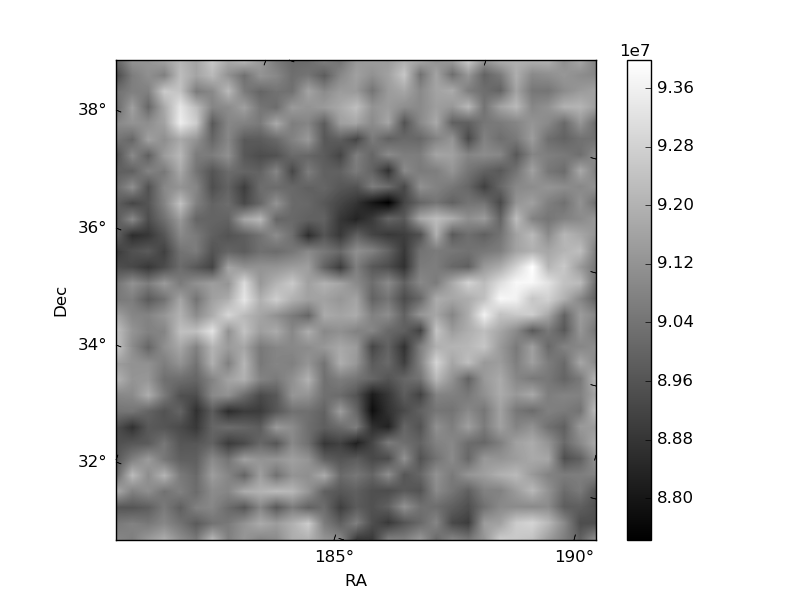
Quadrant B |
|---|---|---|---|
| Quadrant D | 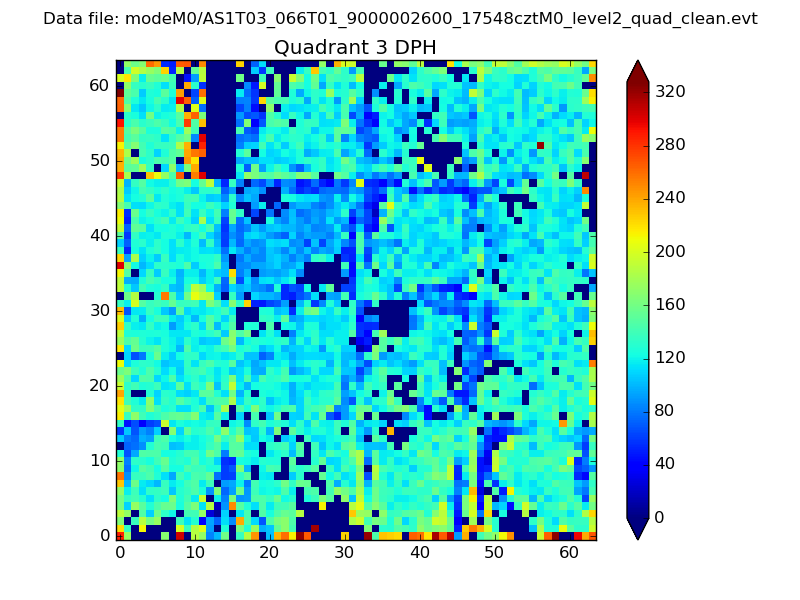 |
 |
Quadrant C |
| Plot type | Count rate plots | Images |
|---|---|---|
| Comparison with Poisson distribution Blue bars denote a histogram of data divided into 1 sec bins. Red curve is a Poisson curve with rate = median count rate of data. |
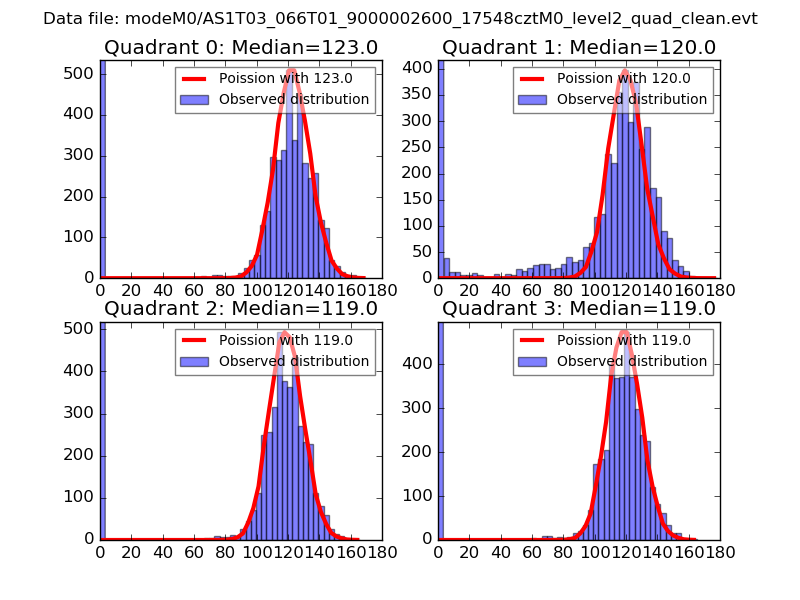 |
 |
| Quadrant-wise count rates Data is divided into 100 sec bins |
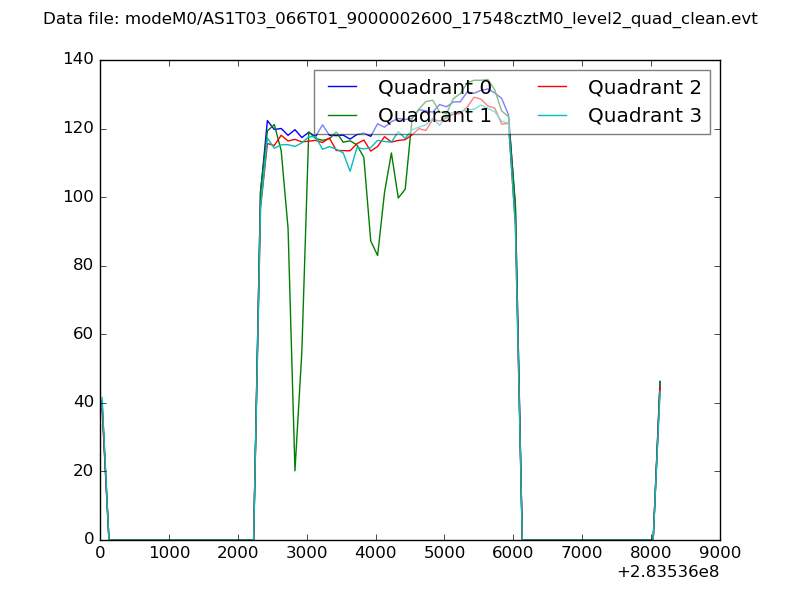 |
|
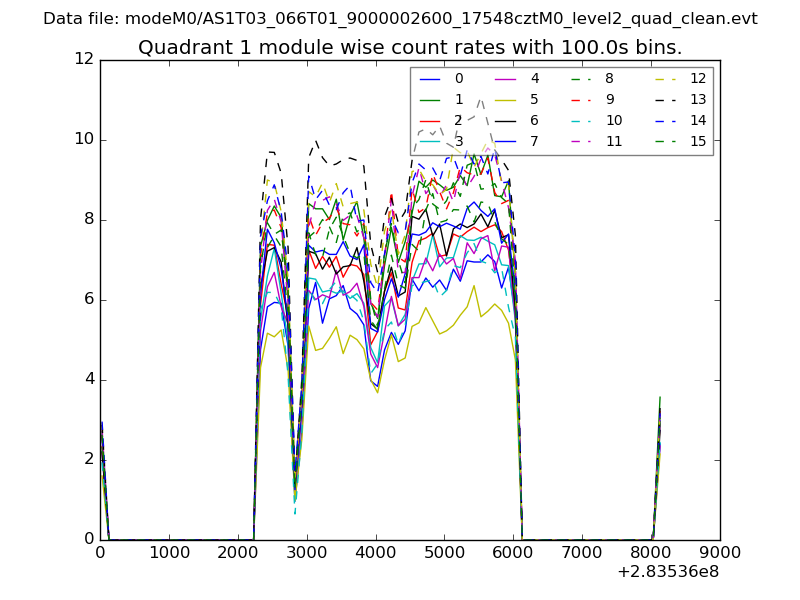
| Module-wise count rates for Quadrant A Data is divided into 100 sec bins |
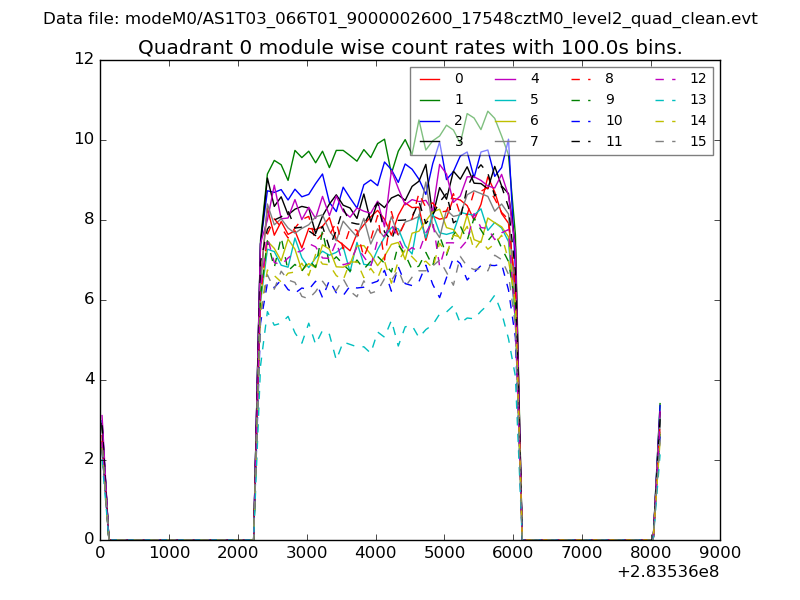 |
 |
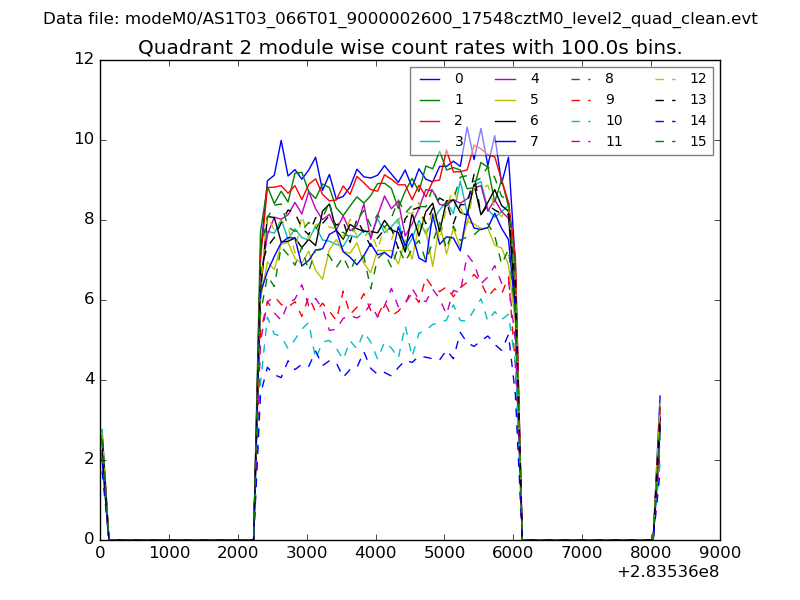
| Module-wise count rates for Quadrant B Data is divided into 100 sec bins |
 |
 |
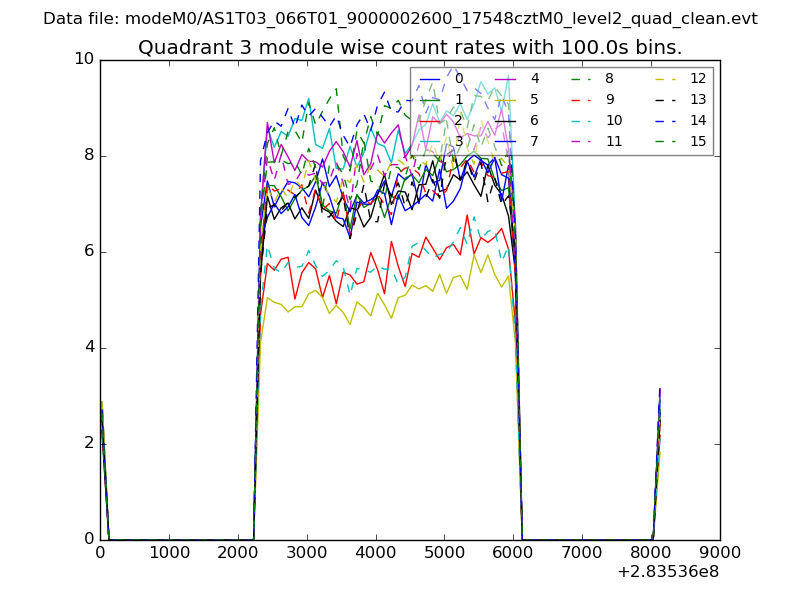
| Module-wise count rates for Quadrant C Data is divided into 100 sec bins |
 |
 |
| Module-wise count rates for Quadrant D Data is divided into 100 sec bins |
 |
 |
| Parameter | Plot |
|---|---|
| CZT HV Monitor | 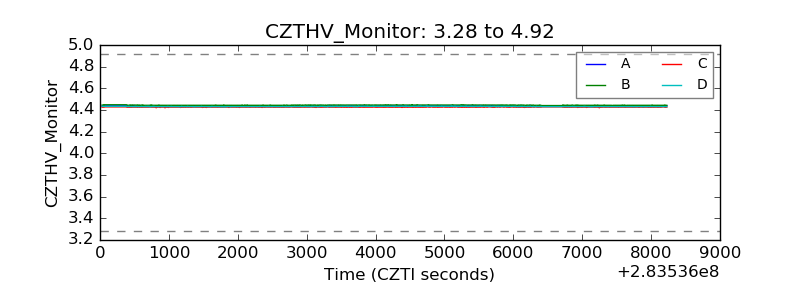 |
| D_VDD | 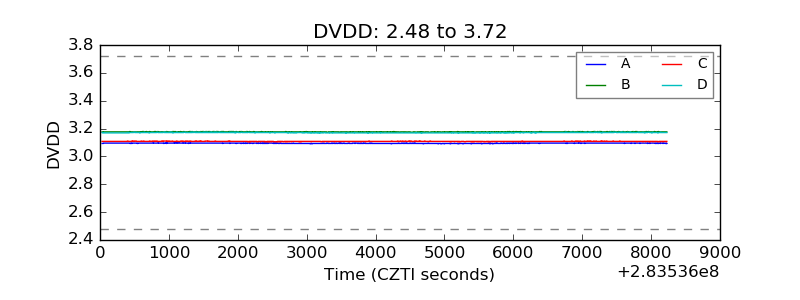 |
| Temperature 1 | 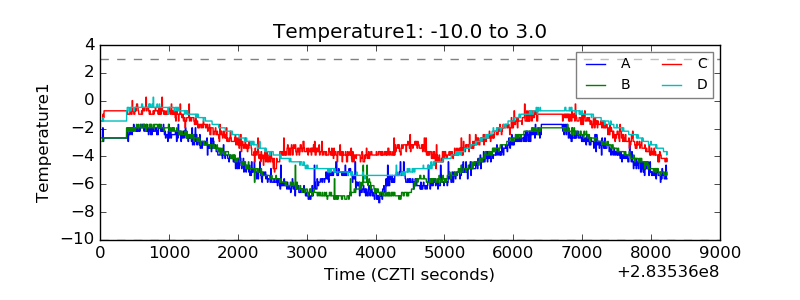 |
| Veto HV Monitor | 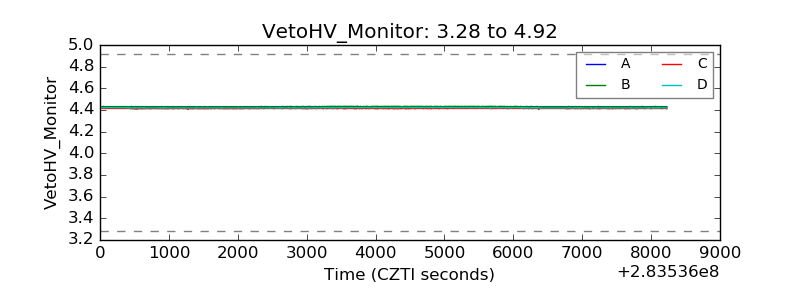 |
| Veto LLD | 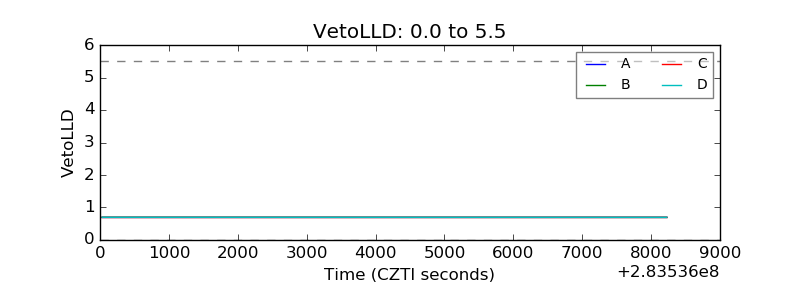 |
| Alpha Counter | 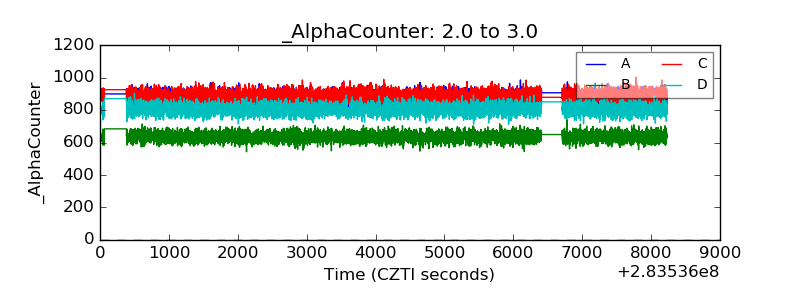 |
| _CPM_Rate | 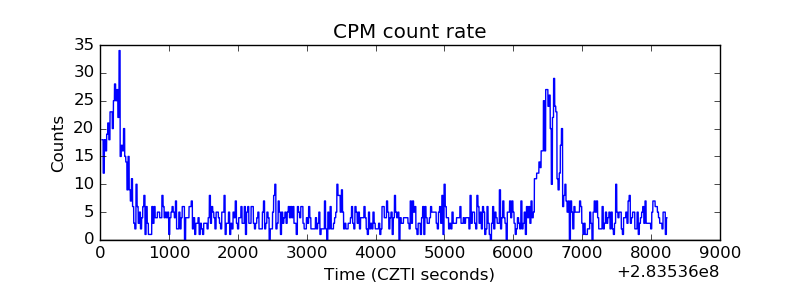 |
| CZT Counter | 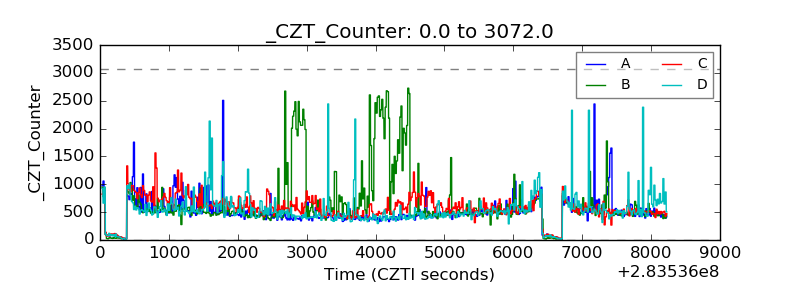 |
| +2.5 Volts monitor | 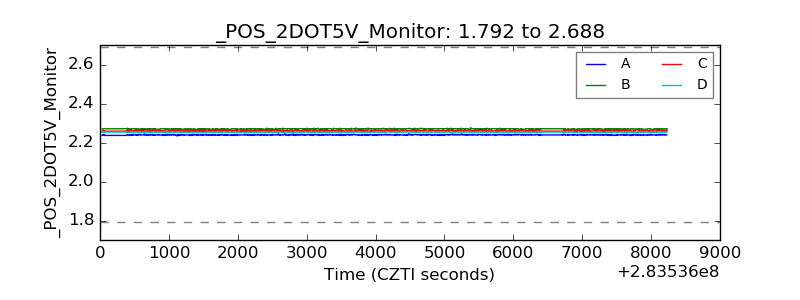 |
| +5 Volts monitor |  |
| _ROLL_ROT | 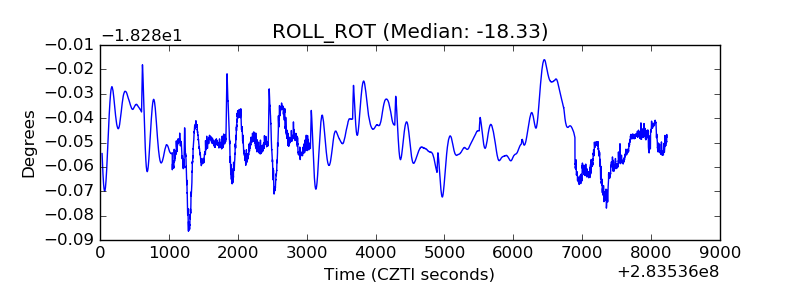 |
| _Roll_DEC | 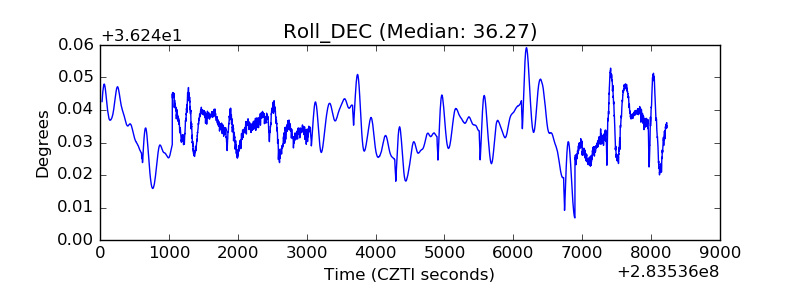 |
| _Roll_RA | 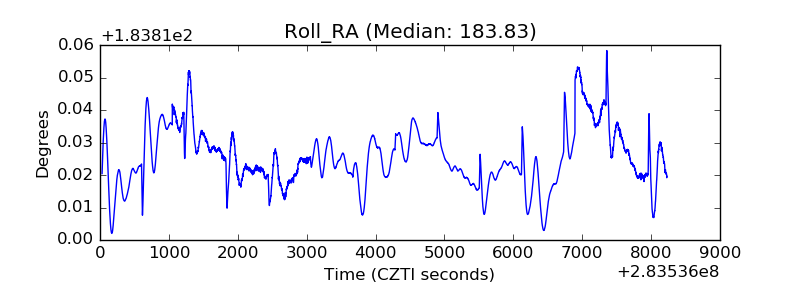 |
| Veto Counter | 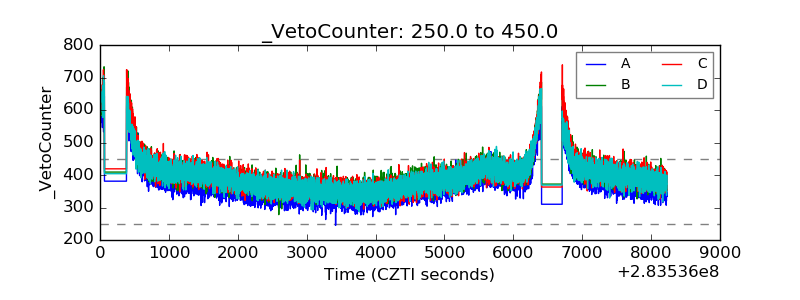 |