| Param | Original file | Final file |
|---|---|---|
| Filename | modeM0/AS1T03_066T01_9000002600_17555cztM0_level2.evt | modeM0/AS1T03_066T01_9000002600_17555cztM0_level2_quad_clean.evt |
| Size (bytes) | 2,007,250,560 | 351,797,760 |
| Size | 1.9 GB | 335.5 MB |
| Events in quadrant A | 14,609,953 | 2,267,860 |
| Events in quadrant B | 16,037,116 | 2,192,181 |
| Events in quadrant C | 14,855,783 | 2,212,232 |
| Events in quadrant D | 13,508,428 | 2,171,069 |
| Mode M9 | |||
|---|---|---|---|
| Quadrant | BADHDUFLAG | Total packets | Discarded packets |
| A | 0 | 29 | 0 |
| B | 0 | 29 | 0 |
| C | 0 | 30 | 0 |
| D | 0 | 30 | 0 |
| Mode SS | |||
|---|---|---|---|
| Quadrant | BADHDUFLAG | Total packets | Discarded packets |
| A | 0 | 536 | 0 |
| B | 0 | 536 | 0 |
| C | 0 | 536 | 0 |
| D | 0 | 536 | 0 |
| Mode M0 | |||
|---|---|---|---|
| Quadrant | BADHDUFLAG | Total packets | Discarded packets |
| A | 0 | 61580 | 5 |
| B | 0 | 65131 | 5 |
| C | 0 | 61342 | 5 |
| D | 0 | 58862 | 5 |
| Quadrant | Total seconds | Saturated seconds | Saturation percentage |
|---|---|---|---|
| A | 26342 | 647 | 2.456154% |
| B | 26342 | 1633 | 6.199226% |
| C | 26342 | 955 | 3.625389% |
| D | 26342 | 434 | 1.647559% |
Noise dominated data is calculated using 1-second bins in cleaned event files. If a bin has >2000 counts, and if more than 50% of those come from <1% of pixels, then it is considered to be noise-dominated and hence unusable.
| Quadrant | # 1 sec bins | Bins with >0 counts | Bins with >2000 counts | High rate bins dominated by noise | Noise dominated (total time) | Noise dominated (detector-on time) | Marked lightcurve |
|---|---|---|---|---|---|---|---|
| A | 44640 | 26347 | 331 | 331 | 0.74% | 1.26% | 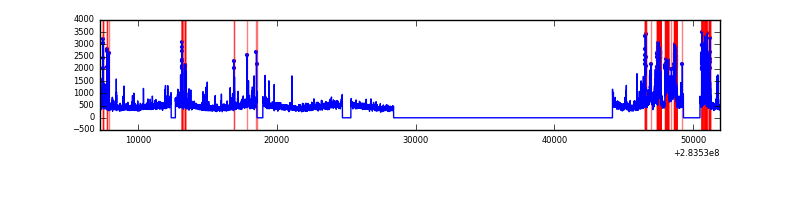 |
| B | 44641 | 26347 | 1139 | 1139 | 2.55% | 4.32% | 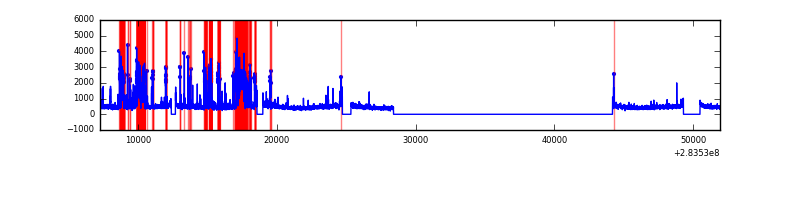 |
| C | 44641 | 26344 | 384 | 384 | 0.86% | 1.46% | 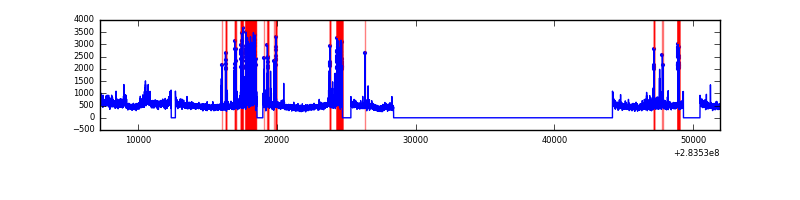 |
| D | 44641 | 26347 | 211 | 211 | 0.47% | 0.80% | 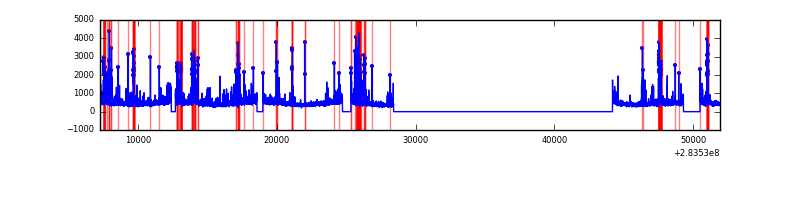 |
Top three noisy pixels from each quadrant. If the there are fewer than three noisy pixels in the level2.evt file, extra rows are filled as -1
| Pixel properties | Quadrant properties | ||||||
|---|---|---|---|---|---|---|---|
| Quadrant | DetID | PixID | Counts | Sigma | Mean | Median | Sigma |
| A | 14 | 237 | 2435692 | 3926.81 | 3091 | 3027 | 619.5 |
| A | 15 | 174 | 293372 | 468.68 | 3091 | 3027 | 619.5 |
| A | 0 | 226 | 26873 | 38.49 | 3091 | 3027 | 619.5 |
| B | 10 | 245 | 4056276 | 7163.83 | 3007 | 2926 | 565.8 |
| B | 6 | 36 | 101678 | 174.53 | 3007 | 2926 | 565.8 |
| B | 12 | 111 | 69370 | 117.43 | 3007 | 2926 | 565.8 |
| C | 0 | 79 | 1734510 | 2535.3 | 2949 | 2975 | 683.0 |
| C | 3 | 233 | 940506 | 1372.73 | 2949 | 2975 | 683.0 |
| C | 14 | 238 | 454752 | 661.49 | 2949 | 2975 | 683.0 |
| D | 13 | 189 | 845784 | 1155.29 | 3002 | 2923 | 729.6 |
| D | 5 | 222 | 749551 | 1023.38 | 3002 | 2923 | 729.6 |
| D | 10 | 70 | 141585 | 190.06 | 3002 | 2923 | 729.6 |
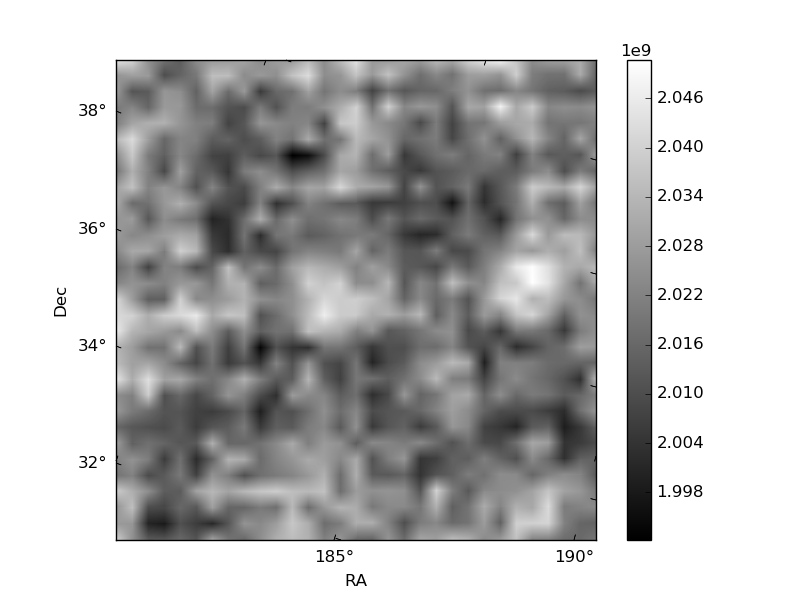
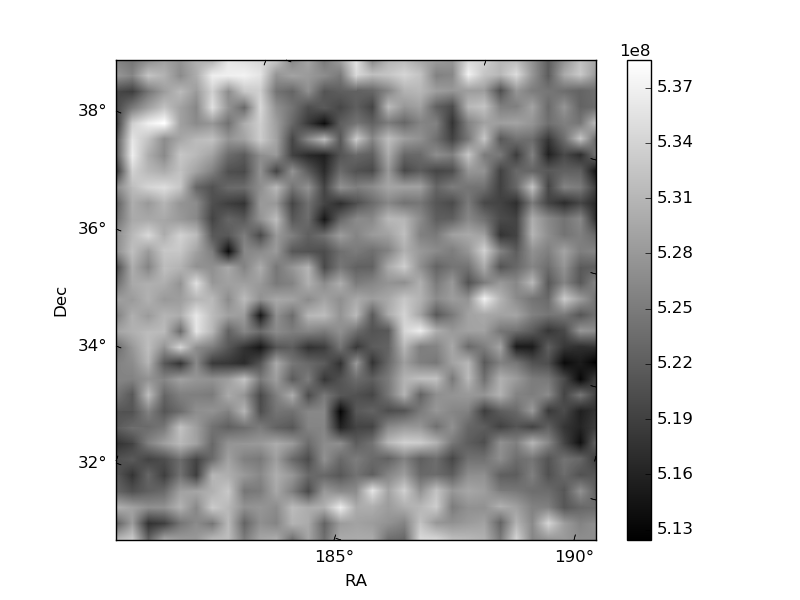
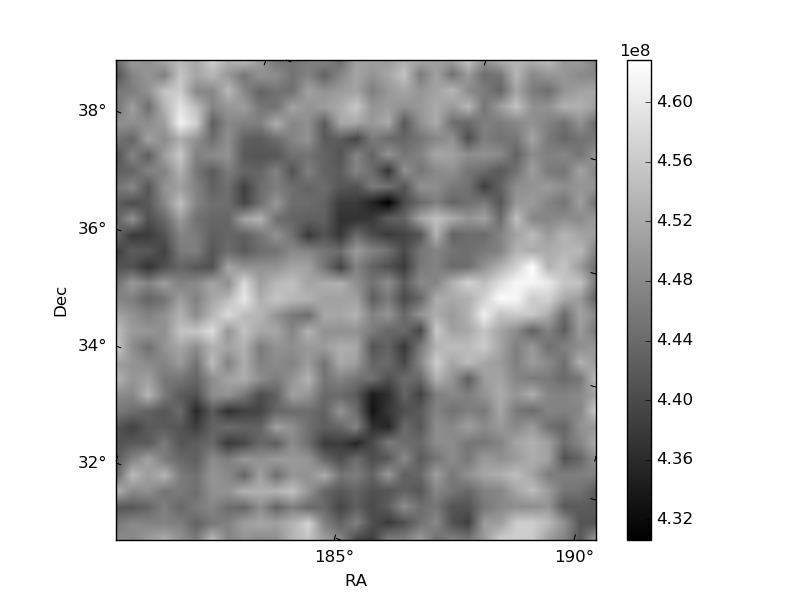
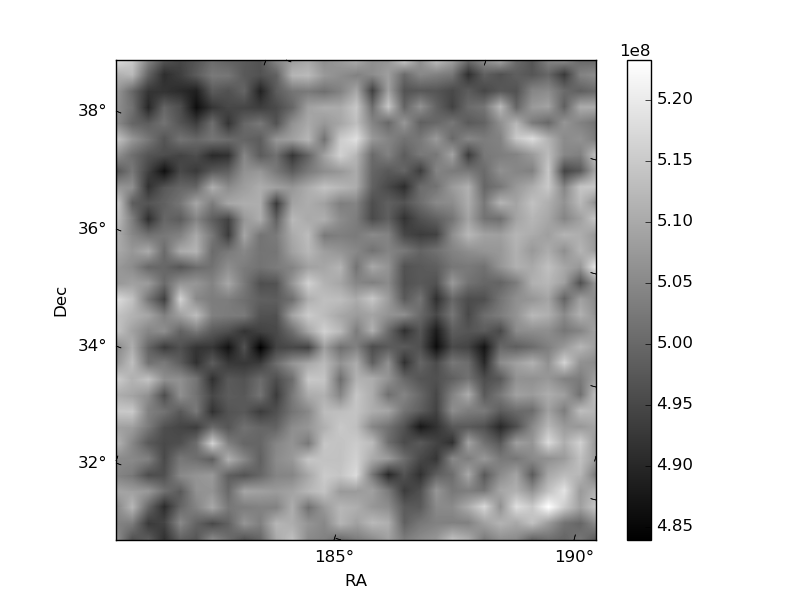
Histogram calculated using DETX and DETY for each event in the final _common_clean file
| Quadrant A | 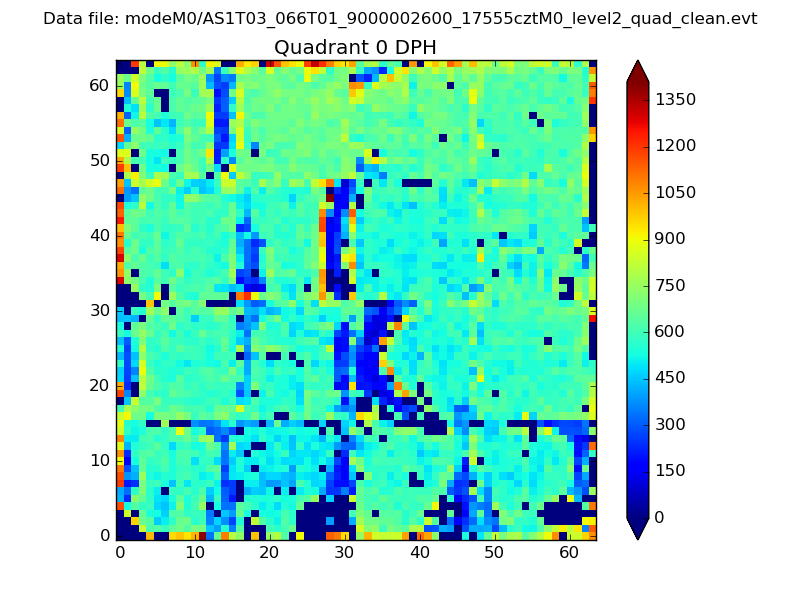 |
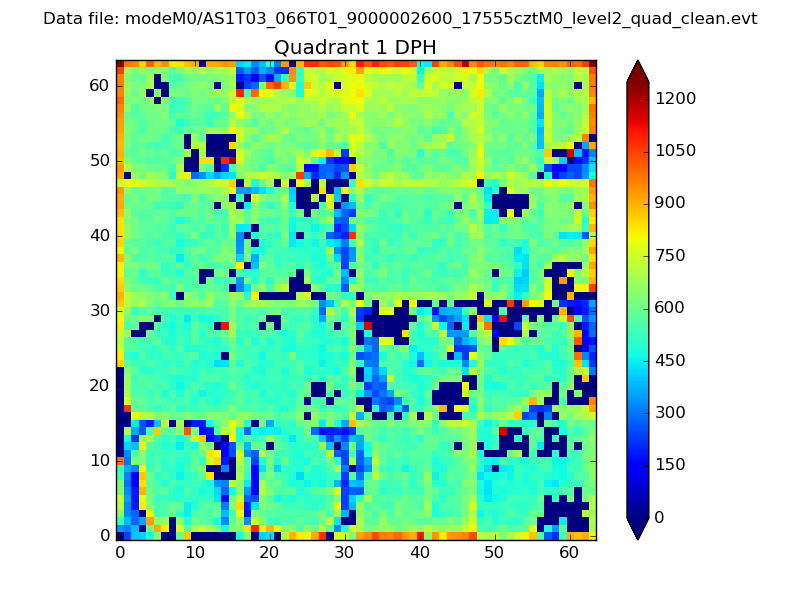 |
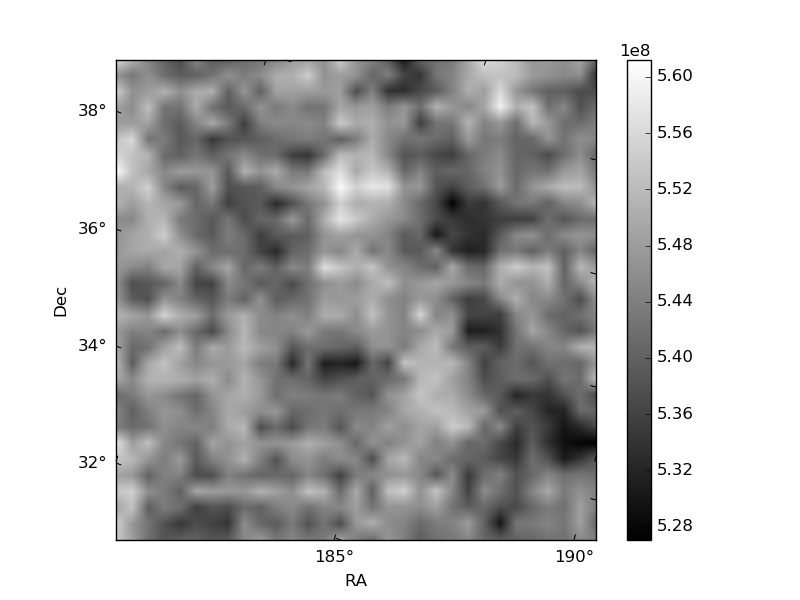
Quadrant B |
|---|---|---|---|
| Quadrant D | 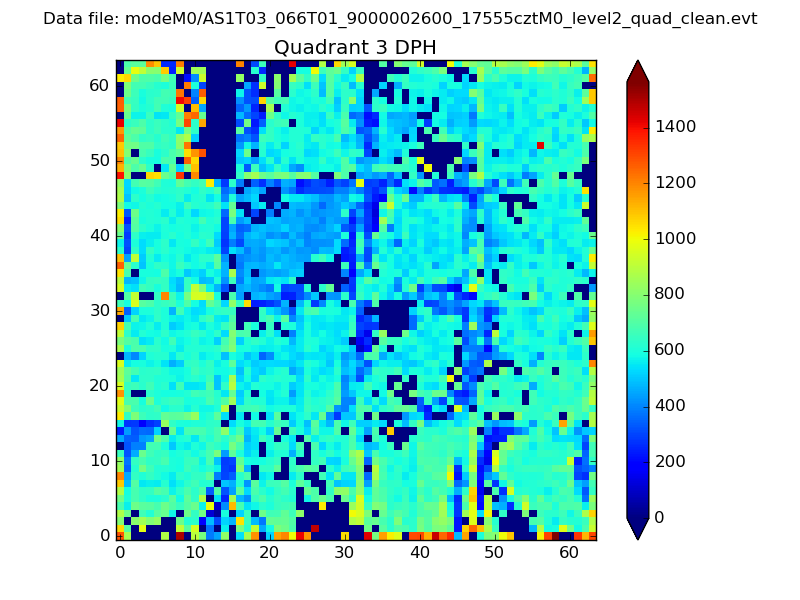 |
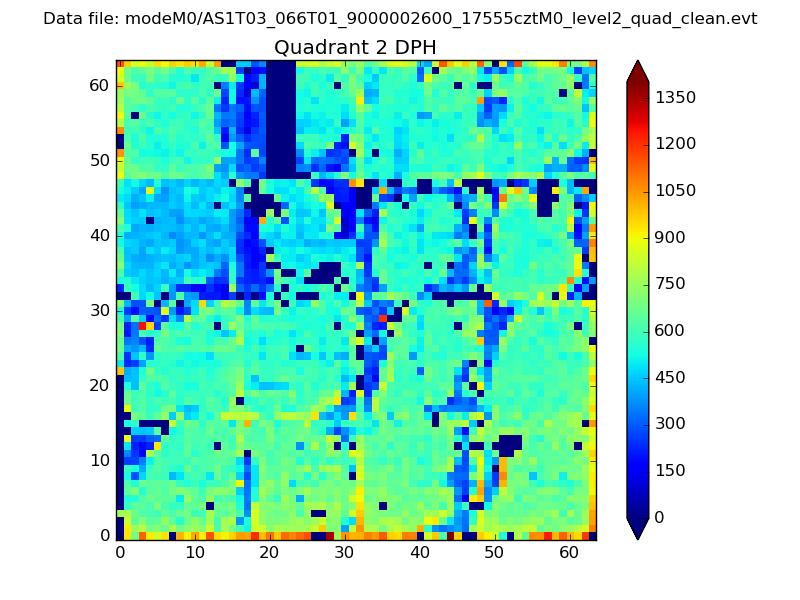 |
Quadrant C |
| Plot type | Count rate plots | Images |
|---|---|---|
| Comparison with Poisson distribution Blue bars denote a histogram of data divided into 1 sec bins. Red curve is a Poisson curve with rate = median count rate of data. |
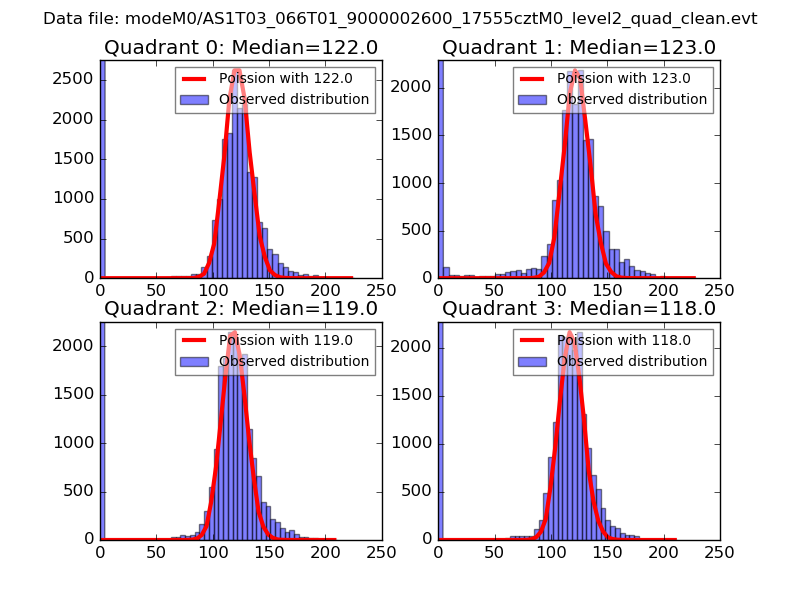 |
 |
| Quadrant-wise count rates Data is divided into 100 sec bins |
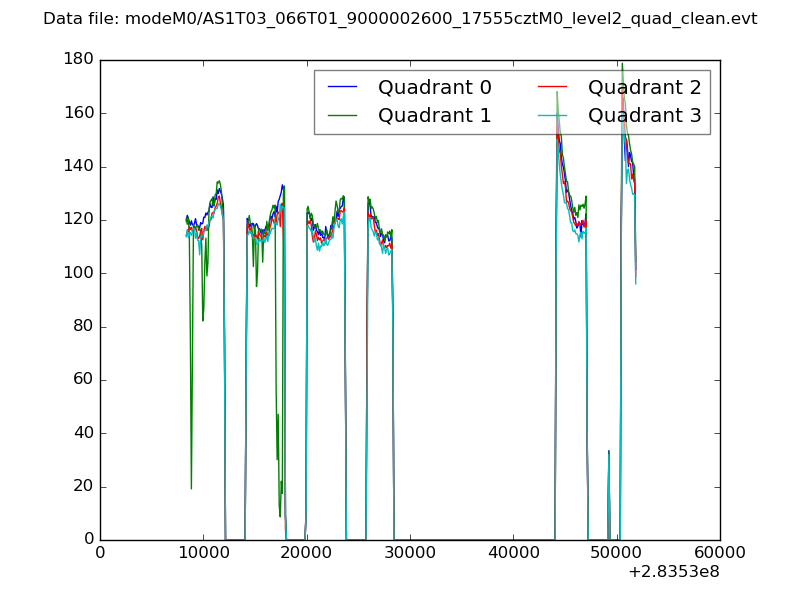 |
|
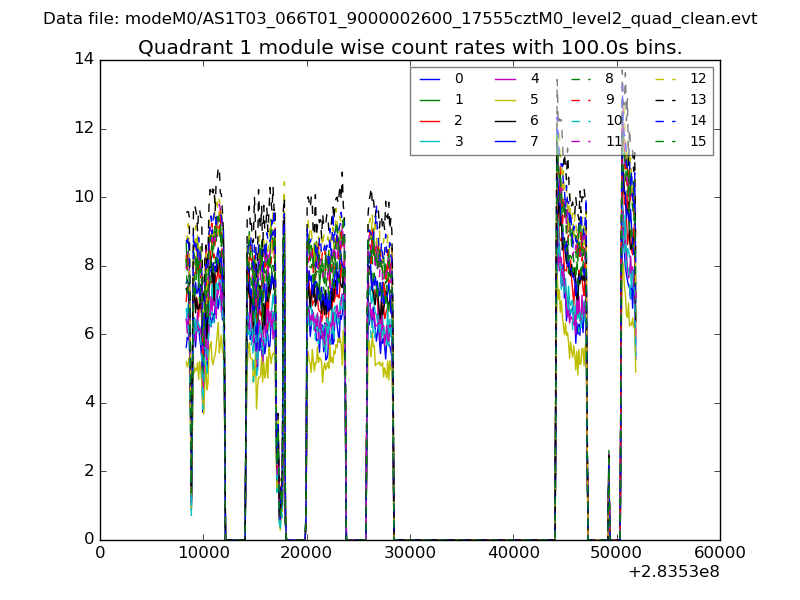
| Module-wise count rates for Quadrant A Data is divided into 100 sec bins |
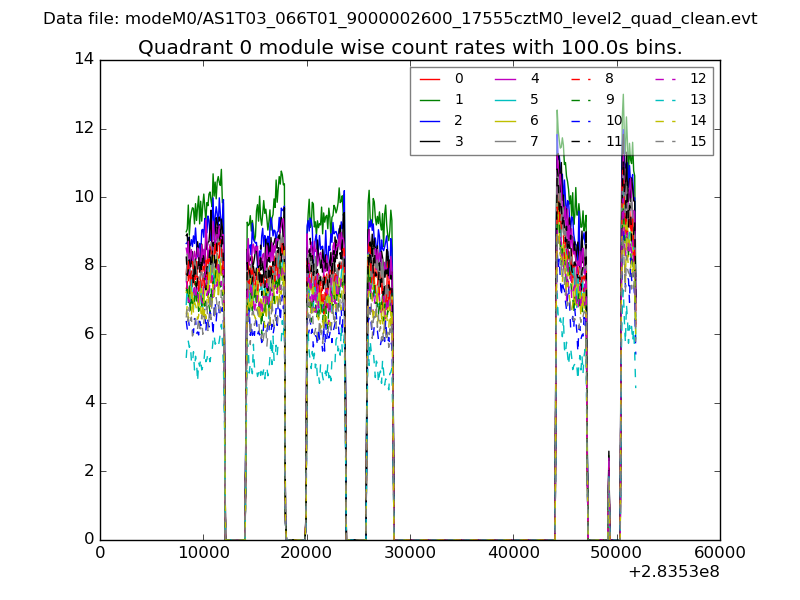 |
 |
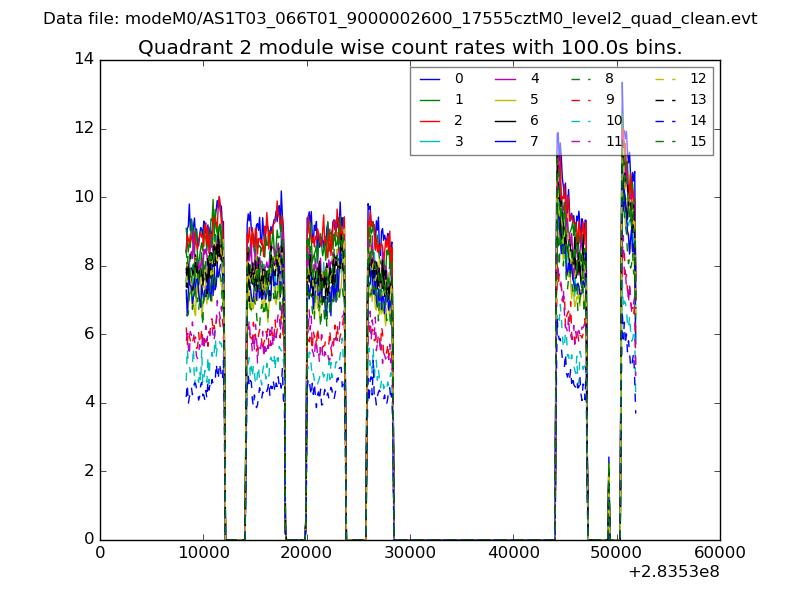
| Module-wise count rates for Quadrant B Data is divided into 100 sec bins |
 |
 |
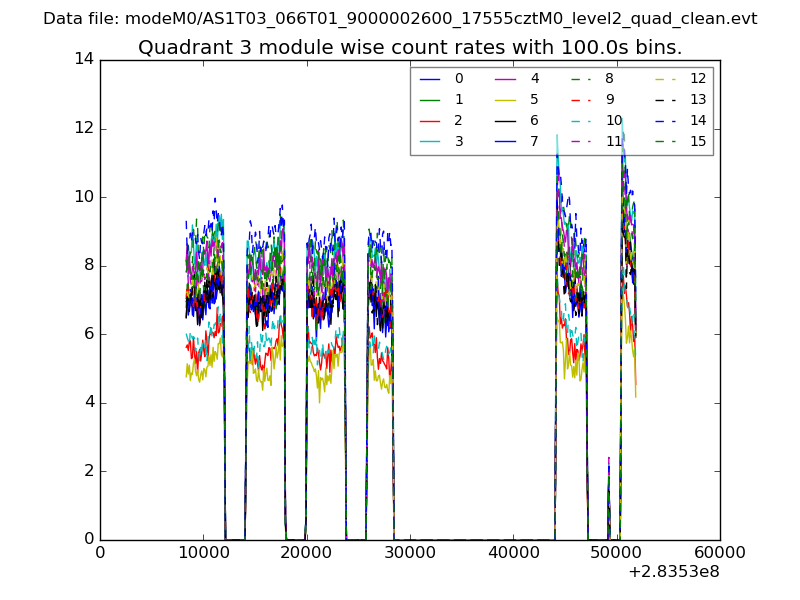
| Module-wise count rates for Quadrant C Data is divided into 100 sec bins |
 |
 |
| Module-wise count rates for Quadrant D Data is divided into 100 sec bins |
 |
 |
| Parameter | Plot |
|---|---|
| CZT HV Monitor | 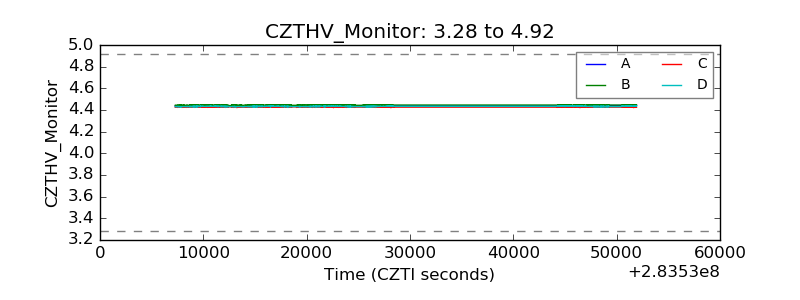 |
| D_VDD | 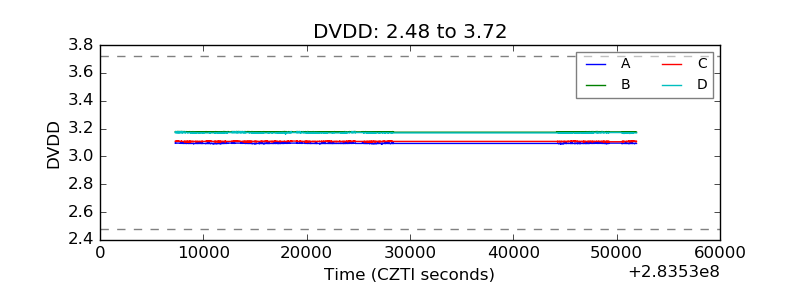 |
| Temperature 1 |  |
| Veto HV Monitor | 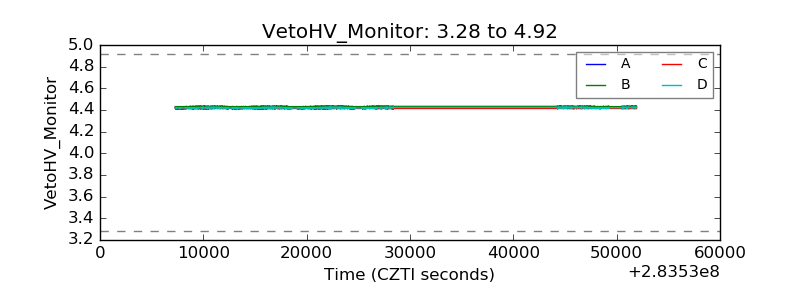 |
| Veto LLD | 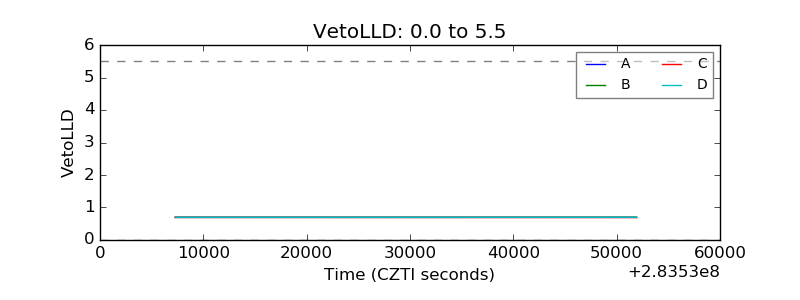 |
| Alpha Counter | 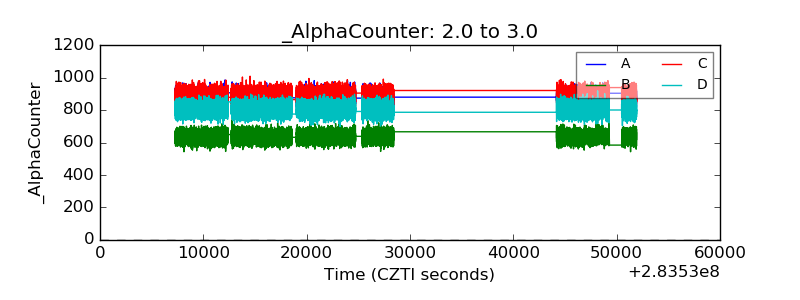 |
| _CPM_Rate | 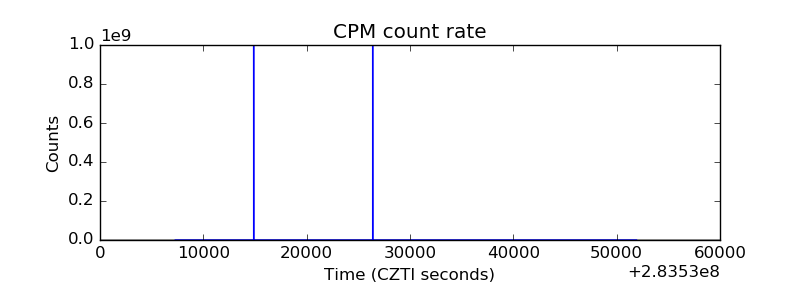 |
| CZT Counter | 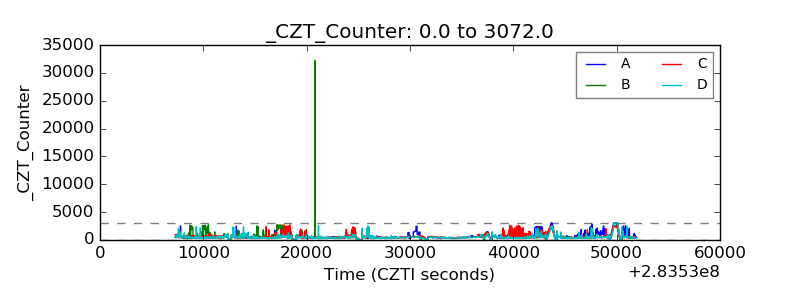 |
| +2.5 Volts monitor |  |
| +5 Volts monitor |  |
| _ROLL_ROT | 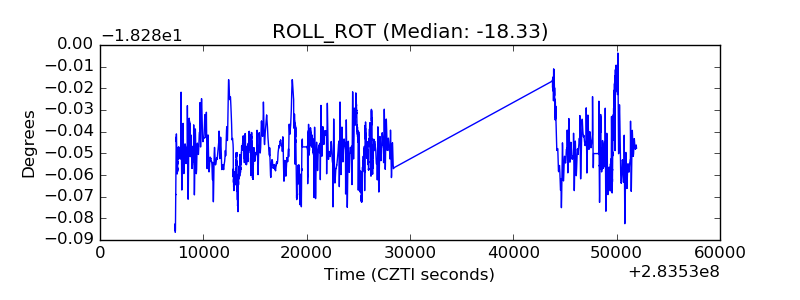 |
| _Roll_DEC |  |
| _Roll_RA | 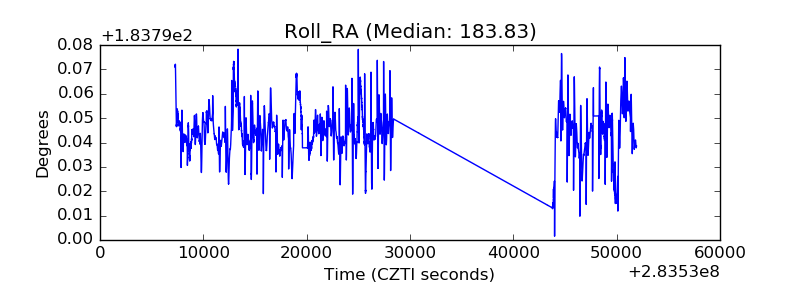 |
| Veto Counter | 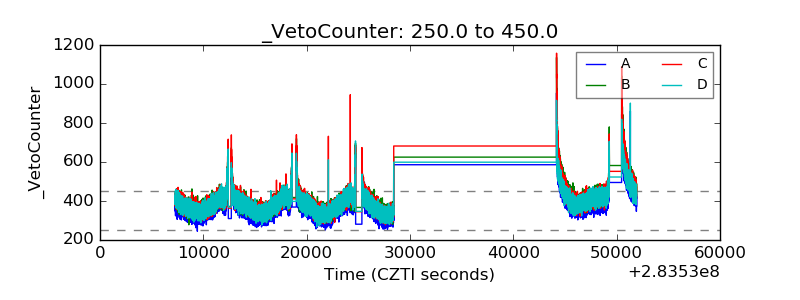 |