| Param | Original file | Final file |
|---|---|---|
| Filename | modeM0/AS1T03_066T01_9000002600_17556cztM0_level2.evt | modeM0/AS1T03_066T01_9000002600_17556cztM0_level2_quad_clean.evt |
| Size (bytes) | 3,396,136,320 | 579,798,720 |
| Size | 3.2 GB | 552.9 MB |
| Events in quadrant A | 26,508,707 | 3,701,434 |
| Events in quadrant B | 24,611,643 | 3,670,128 |
| Events in quadrant C | 25,365,327 | 3,598,716 |
| Events in quadrant D | 23,373,569 | 3,544,636 |
| Mode M9 | |||
|---|---|---|---|
| Quadrant | BADHDUFLAG | Total packets | Discarded packets |
| A | 0 | 66 | 0 |
| B | 0 | 66 | 0 |
| C | 0 | 66 | 0 |
| D | 0 | 66 | 0 |
| Mode SS | |||
|---|---|---|---|
| Quadrant | BADHDUFLAG | Total packets | Discarded packets |
| A | 0 | 904 | 0 |
| B | 0 | 904 | 0 |
| C | 0 | 904 | 0 |
| D | 0 | 904 | 0 |
| Mode M0 | |||
|---|---|---|---|
| Quadrant | BADHDUFLAG | Total packets | Discarded packets |
| A | 0 | 109280 | 10 |
| B | 0 | 102358 | 8 |
| C | 0 | 103934 | 8 |
| D | 0 | 100981 | 8 |
| Quadrant | Total seconds | Saturated seconds | Saturation percentage |
|---|---|---|---|
| A | 44380 | 2089 | 4.707075% |
| B | 44381 | 1773 | 3.994953% |
| C | 44381 | 1519 | 3.422636% |
| D | 44381 | 698 | 1.572745% |
Noise dominated data is calculated using 1-second bins in cleaned event files. If a bin has >2000 counts, and if more than 50% of those come from <1% of pixels, then it is considered to be noise-dominated and hence unusable.
| Quadrant | # 1 sec bins | Bins with >0 counts | Bins with >2000 counts | High rate bins dominated by noise | Noise dominated (total time) | Noise dominated (detector-on time) | Marked lightcurve |
|---|---|---|---|---|---|---|---|
| A | 50930 | 44388 | 1280 | 1280 | 2.51% | 2.88% | 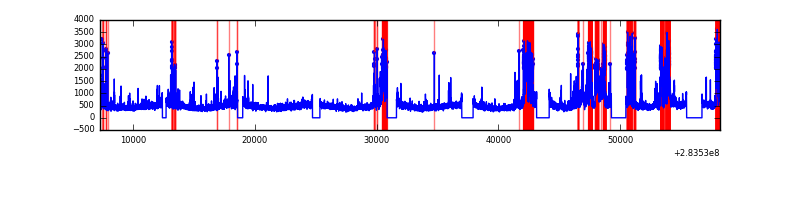 |
| B | 50931 | 44388 | 1145 | 1145 | 2.25% | 2.58% | 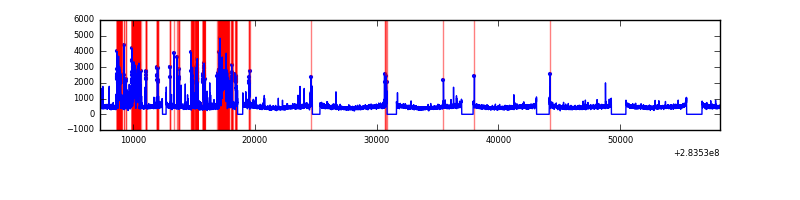 |
| C | 50931 | 44386 | 657 | 657 | 1.29% | 1.48% | 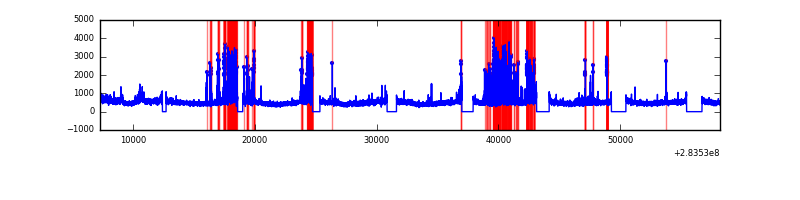 |
| D | 50931 | 44389 | 335 | 335 | 0.66% | 0.75% | 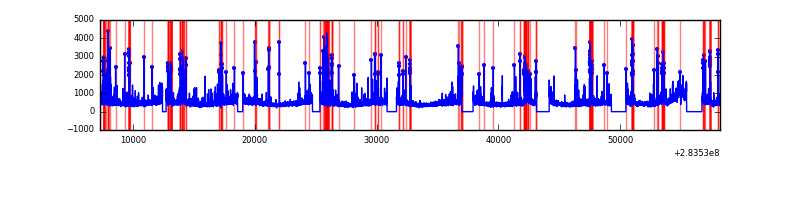 |
Top three noisy pixels from each quadrant. If the there are fewer than three noisy pixels in the level2.evt file, extra rows are filled as -1
| Pixel properties | Quadrant properties | ||||||
|---|---|---|---|---|---|---|---|
| Quadrant | DetID | PixID | Counts | Sigma | Mean | Median | Sigma |
| A | 14 | 237 | 6290925 | 6064.85 | 5177 | 5068 | 1036.4 |
| A | 15 | 174 | 315947 | 299.95 | 5177 | 5068 | 1036.4 |
| A | 0 | 226 | 44900 | 38.43 | 5177 | 5068 | 1036.4 |
| B | 10 | 245 | 4058598 | 4142.65 | 5174 | 5043 | 978.5 |
| B | 6 | 36 | 174095 | 172.77 | 5174 | 5043 | 978.5 |
| B | 12 | 111 | 118609 | 116.06 | 5174 | 5043 | 978.5 |
| C | 0 | 79 | 3497672 | 3002.9 | 5017 | 5056 | 1163.1 |
| C | 3 | 233 | 1224530 | 1048.49 | 5017 | 5056 | 1163.1 |
| C | 14 | 238 | 773425 | 660.63 | 5017 | 5056 | 1163.1 |
| D | 13 | 189 | 1162530 | 941.18 | 5102 | 4967 | 1229.9 |
| D | 7 | 238 | 1162027 | 940.77 | 5102 | 4967 | 1229.9 |
| D | 5 | 222 | 1031868 | 834.94 | 5102 | 4967 | 1229.9 |
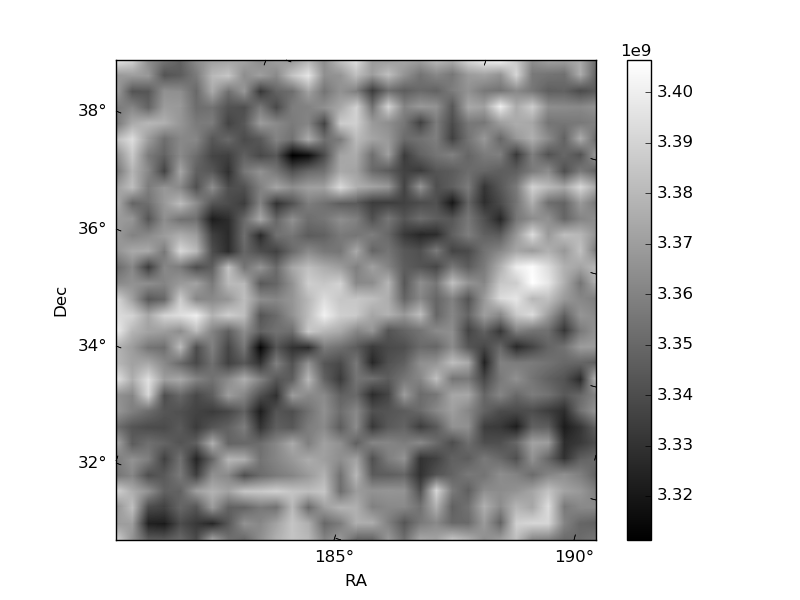
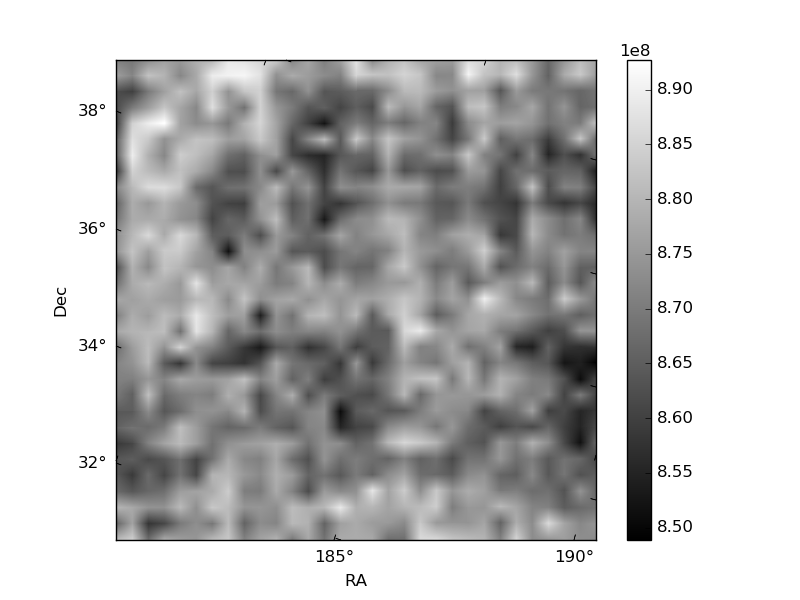
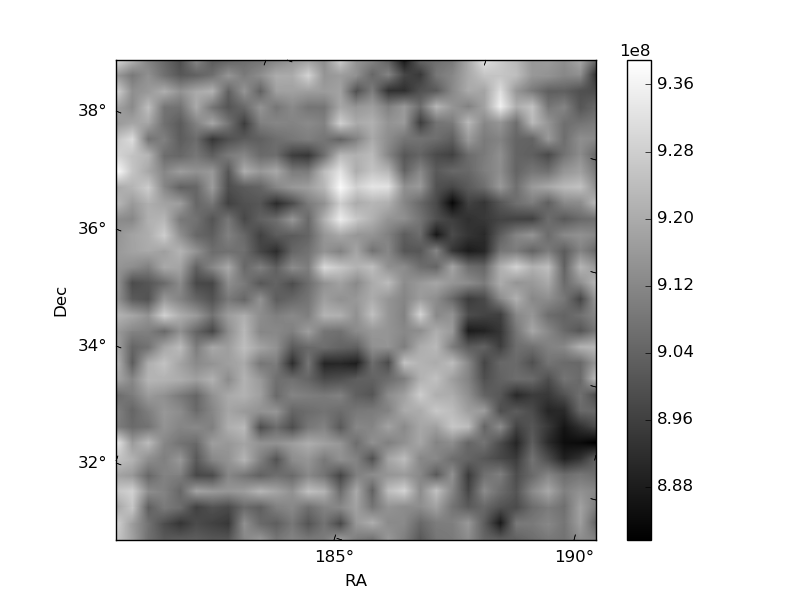
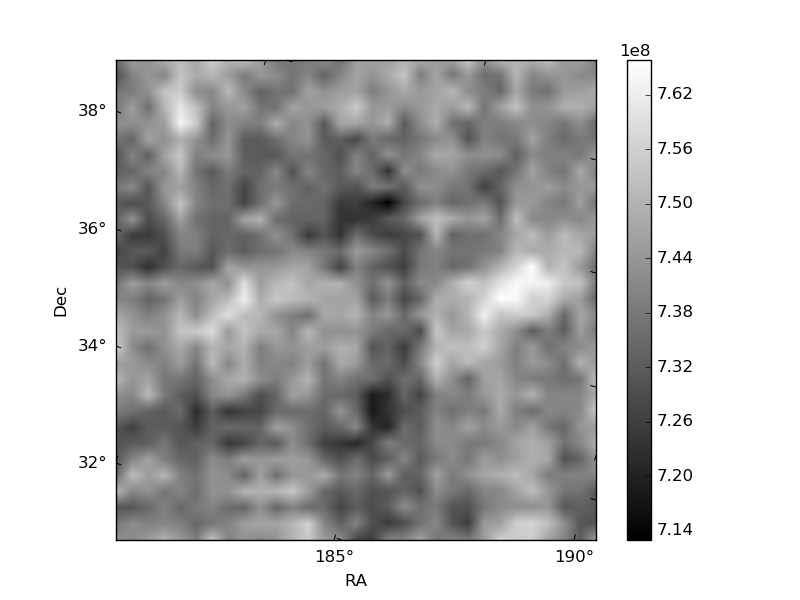
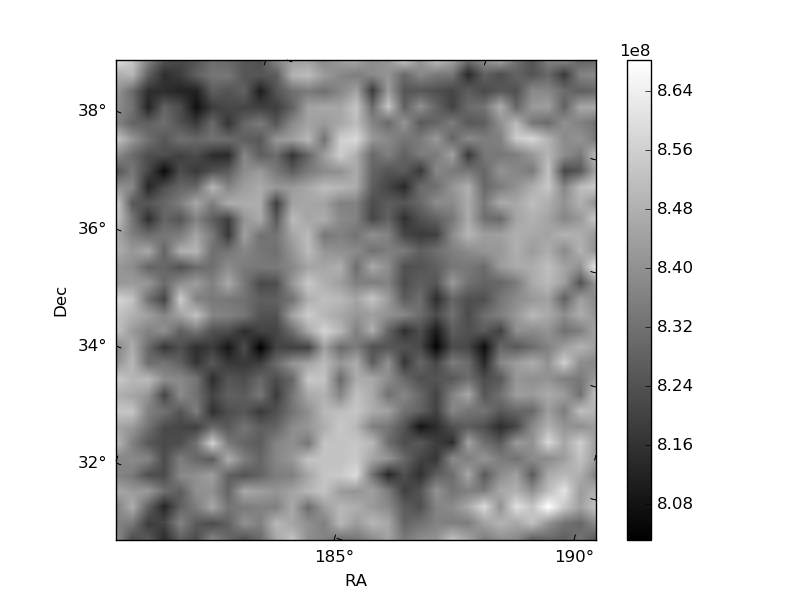
Histogram calculated using DETX and DETY for each event in the final _common_clean file
| Quadrant A | 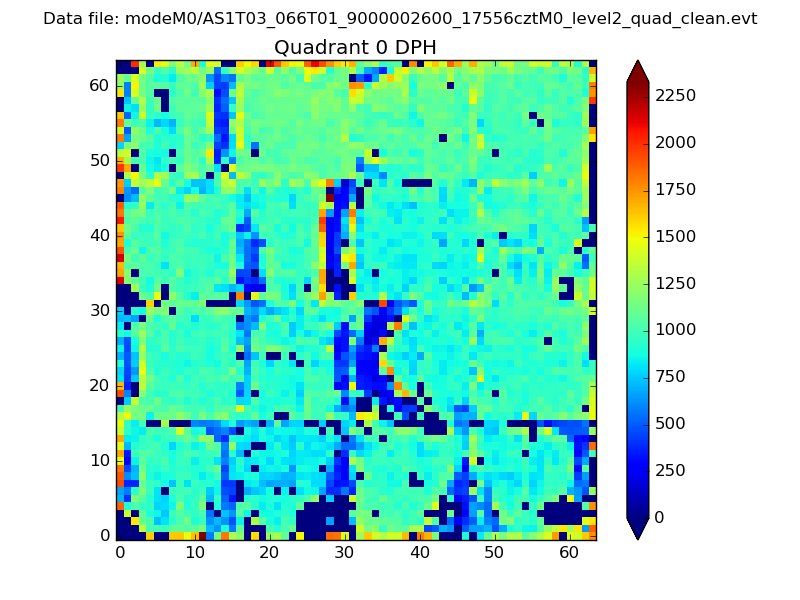 |
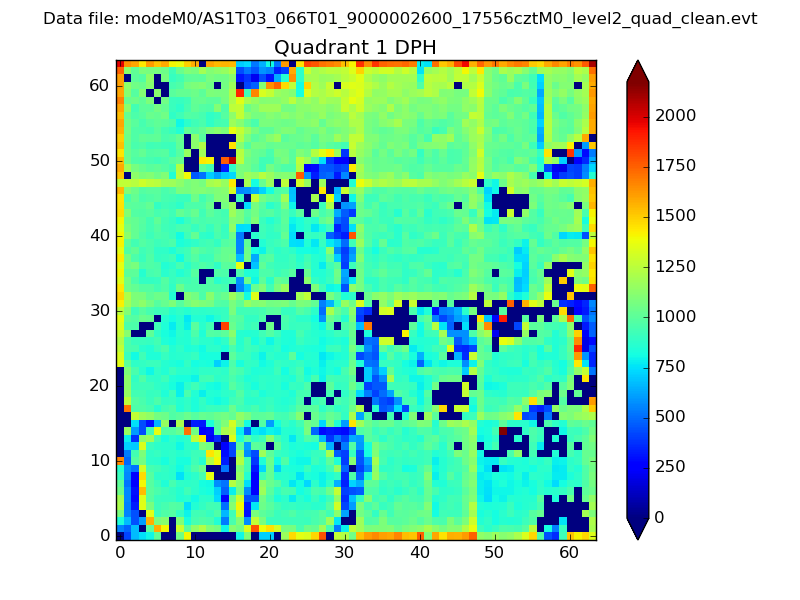 |
Quadrant B |
|---|---|---|---|
| Quadrant D | 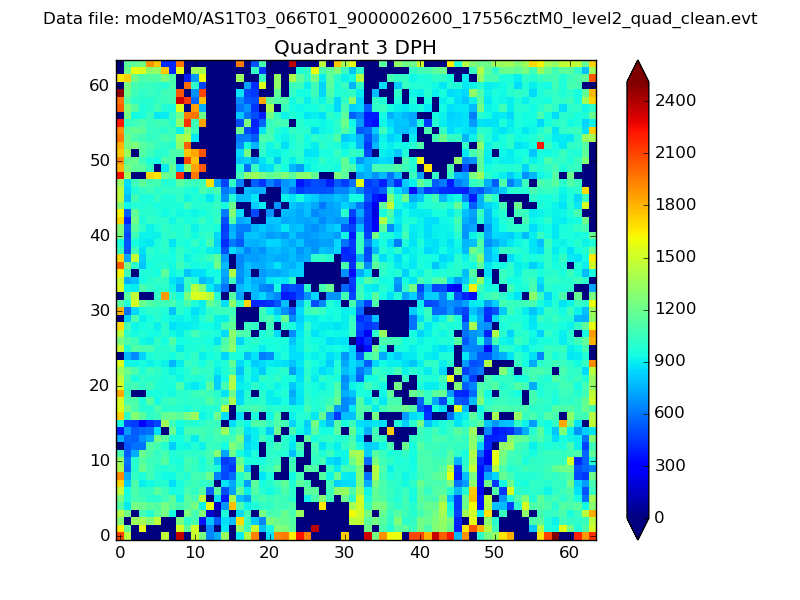 |
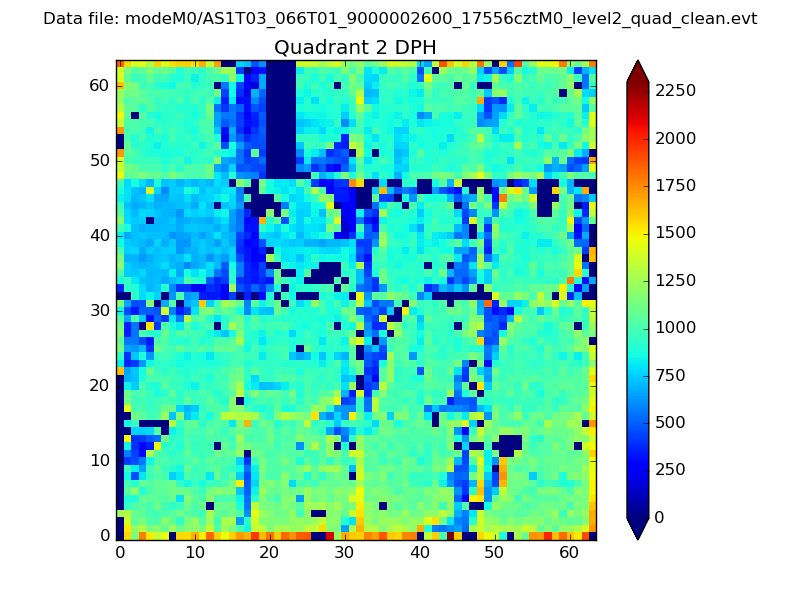 |
Quadrant C |
| Plot type | Count rate plots | Images |
|---|---|---|
| Comparison with Poisson distribution Blue bars denote a histogram of data divided into 1 sec bins. Red curve is a Poisson curve with rate = median count rate of data. |
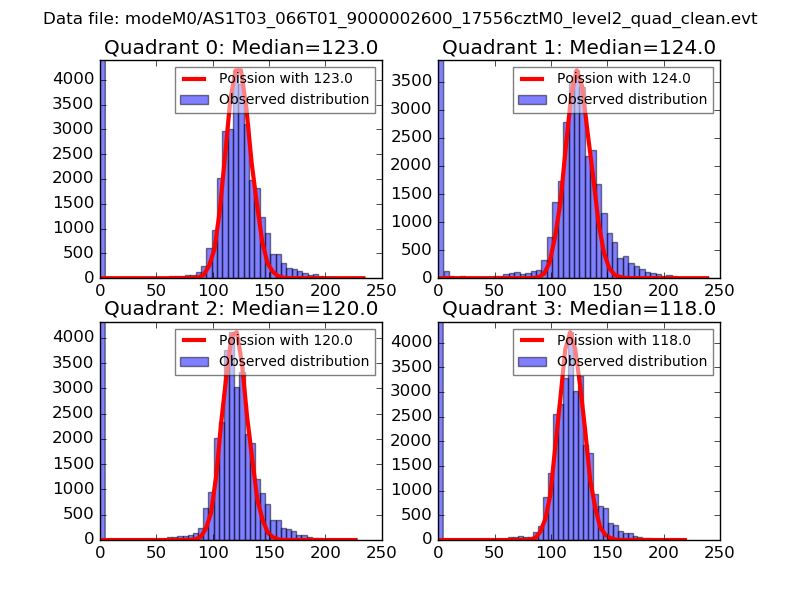 |
 |
| Quadrant-wise count rates Data is divided into 100 sec bins |
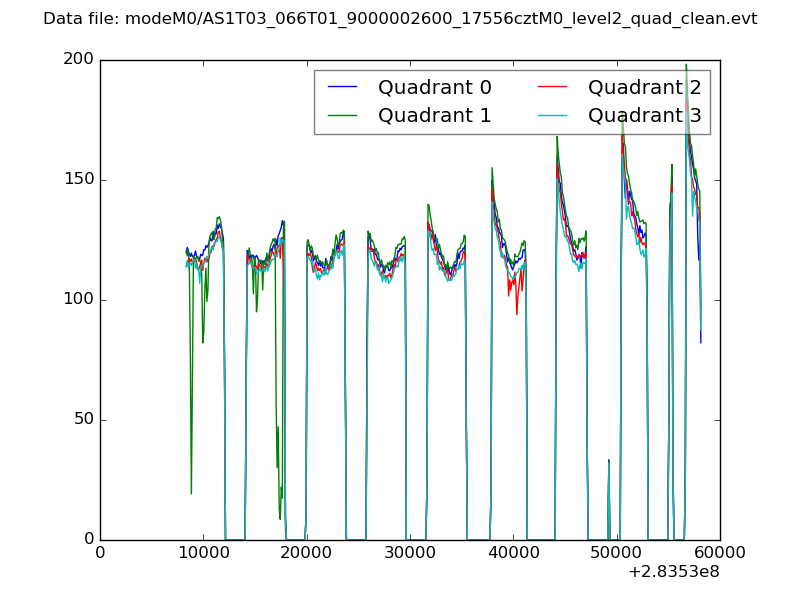 |
|
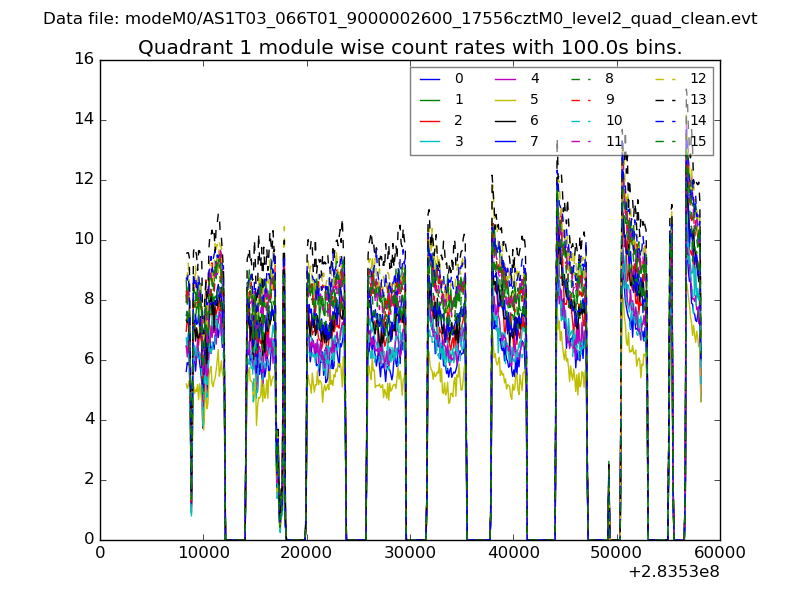
| Module-wise count rates for Quadrant A Data is divided into 100 sec bins |
 |
 |
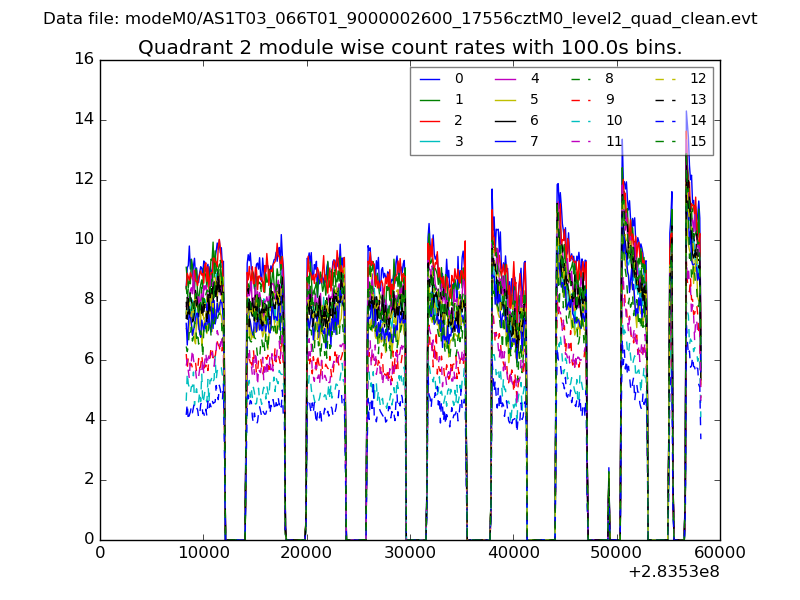
| Module-wise count rates for Quadrant B Data is divided into 100 sec bins |
 |
 |
| Module-wise count rates for Quadrant C Data is divided into 100 sec bins |
 |
 |
| Module-wise count rates for Quadrant D Data is divided into 100 sec bins |
 |
 |
| Parameter | Plot |
|---|---|
| CZT HV Monitor | 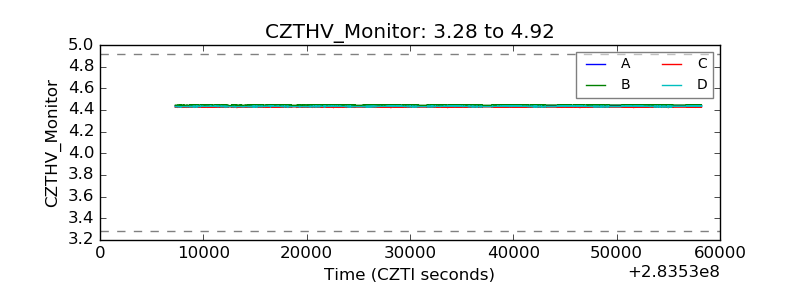 |
| D_VDD |  |
| Temperature 1 | 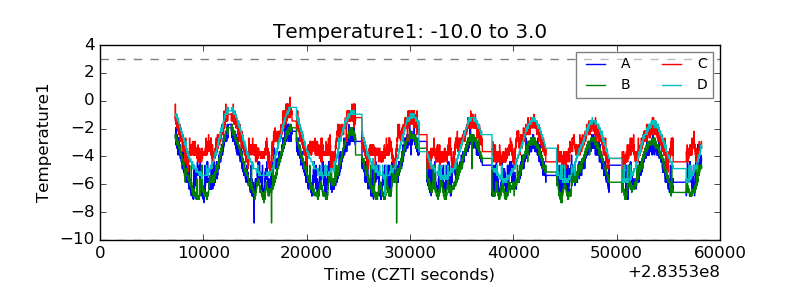 |
| Veto HV Monitor | 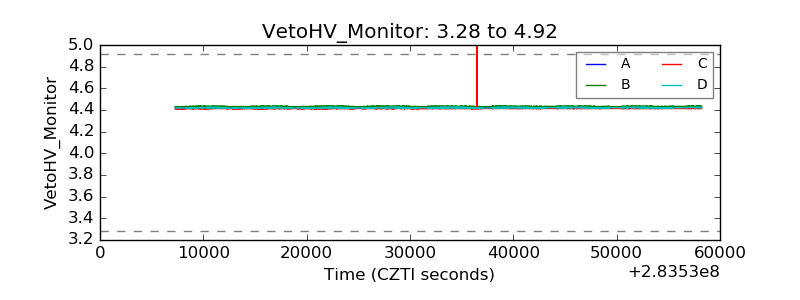 |
| Veto LLD | 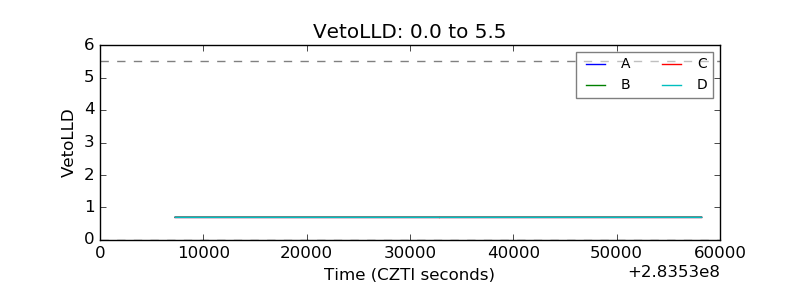 |
| Alpha Counter | 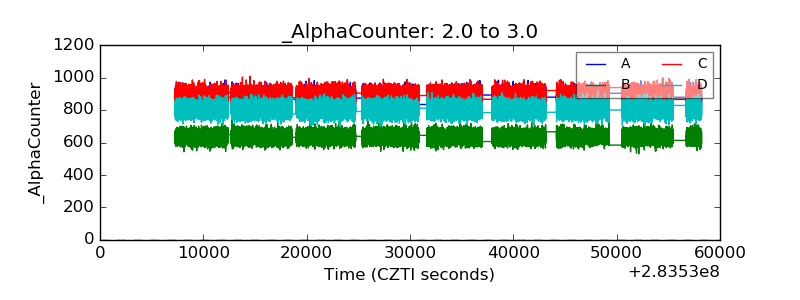 |
| _CPM_Rate | 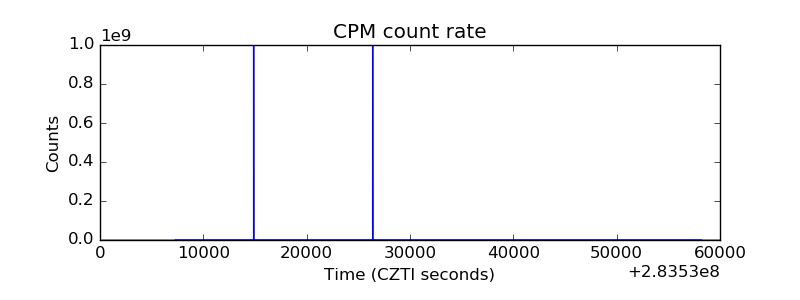 |
| CZT Counter | 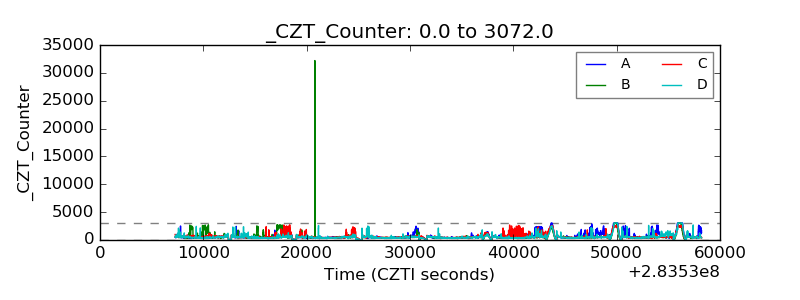 |
| +2.5 Volts monitor |  |
| +5 Volts monitor |  |
| _ROLL_ROT | 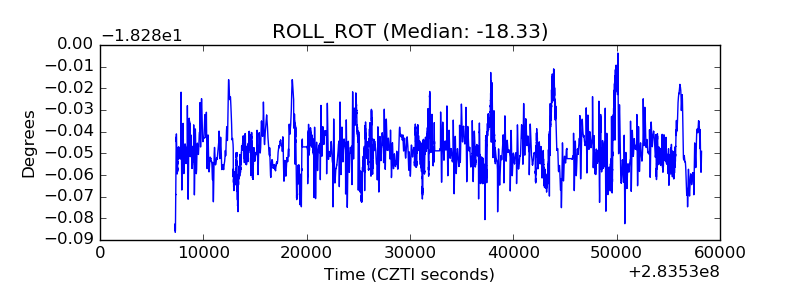 |
| _Roll_DEC | 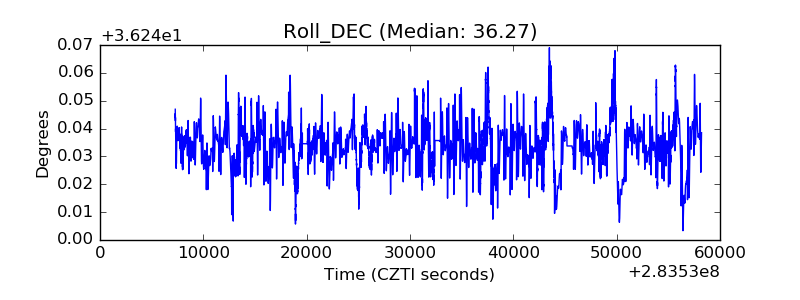 |
| _Roll_RA | 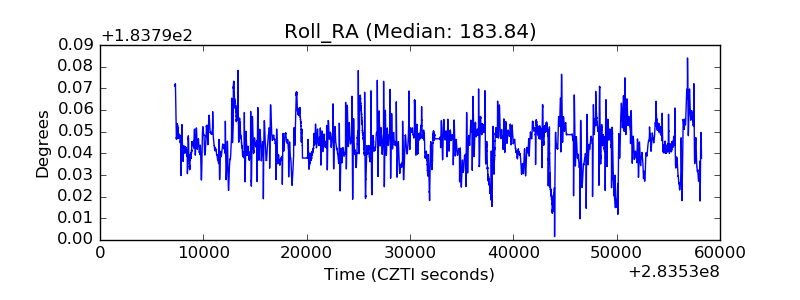 |
| Veto Counter | 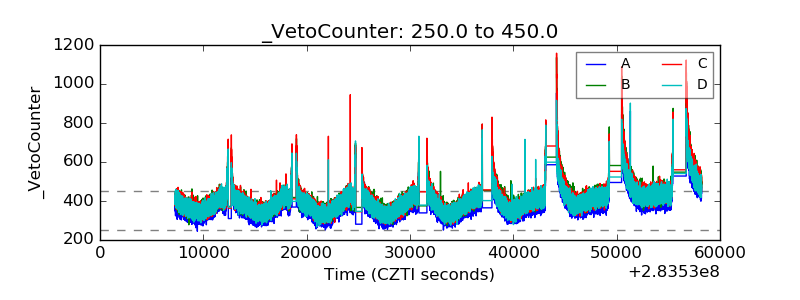 |