| Param | Original file | Final file |
|---|---|---|
| Filename | modeM0/AS1T03_066T01_9000002600_17557cztM0_level2.evt | modeM0/AS1T03_066T01_9000002600_17557cztM0_level2_quad_clean.evt |
| Size (bytes) | 547,064,640 | 88,796,160 |
| Size | 521.7 MB | 84.7 MB |
| Events in quadrant A | 6,669,213 | 555,097 |
| Events in quadrant B | 3,017,021 | 597,453 |
| Events in quadrant C | 3,062,482 | 567,705 |
| Events in quadrant D | 3,413,752 | 551,040 |
| Mode M9 | |||
|---|---|---|---|
| Quadrant | BADHDUFLAG | Total packets | Discarded packets |
| A | 0 | 13 | 0 |
| B | 0 | 13 | 0 |
| C | 0 | 13 | 0 |
| D | 0 | 13 | 0 |
| Mode SS | |||
|---|---|---|---|
| Quadrant | BADHDUFLAG | Total packets | Discarded packets |
| A | 0 | 122 | 0 |
| B | 0 | 122 | 0 |
| C | 0 | 122 | 0 |
| D | 0 | 122 | 0 |
| Mode M0 | |||
|---|---|---|---|
| Quadrant | BADHDUFLAG | Total packets | Discarded packets |
| A | 0 | 23604 | 1 |
| B | 0 | 12431 | 1 |
| C | 0 | 12453 | 1 |
| D | 0 | 13874 | 1 |
| Quadrant | Total seconds | Saturated seconds | Saturation percentage |
|---|---|---|---|
| A | 5978 | 1356 | 22.683172% |
| B | 5977 | 58 | 0.970386% |
| C | 5977 | 60 | 1.003848% |
| D | 5977 | 119 | 1.990965% |
Noise dominated data is calculated using 1-second bins in cleaned event files. If a bin has >2000 counts, and if more than 50% of those come from <1% of pixels, then it is considered to be noise-dominated and hence unusable.
| Quadrant | # 1 sec bins | Bins with >0 counts | Bins with >2000 counts | High rate bins dominated by noise | Noise dominated (total time) | Noise dominated (detector-on time) | Marked lightcurve |
|---|---|---|---|---|---|---|---|
| A | 7288 | 5979 | 1142 | 1142 | 15.67% | 19.10% | 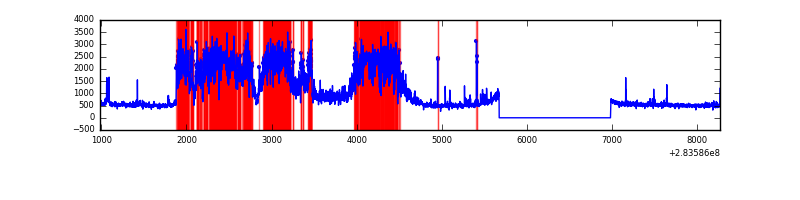 |
| B | 7287 | 5978 | 0 | 0 | 0.00% | 0.00% | 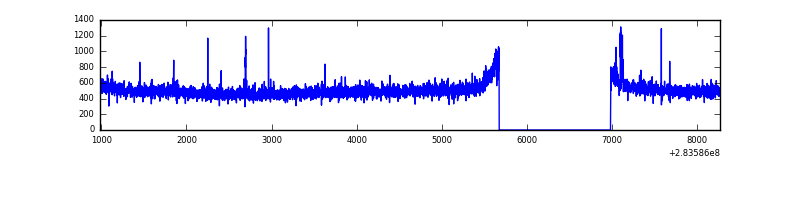 |
| C | 7287 | 5978 | 0 | 0 | 0.00% | 0.00% | 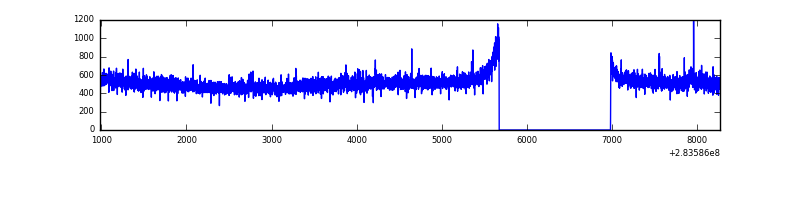 |
| D | 7287 | 5978 | 72 | 72 | 0.99% | 1.20% | 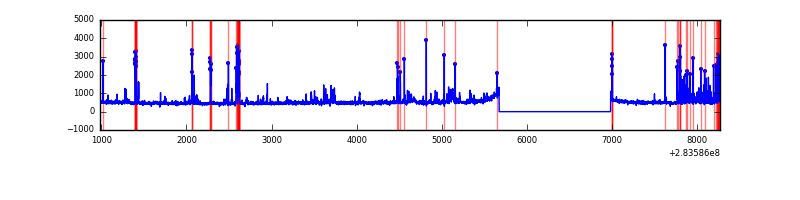 |
Top three noisy pixels from each quadrant. If the there are fewer than three noisy pixels in the level2.evt file, extra rows are filled as -1
| Pixel properties | Quadrant properties | ||||||
|---|---|---|---|---|---|---|---|
| Quadrant | DetID | PixID | Counts | Sigma | Mean | Median | Sigma |
| A | 14 | 237 | 3888103 | 27099.23 | 718 | 704 | 143.5 |
| A | 15 | 174 | 18822 | 126.3 | 718 | 704 | 143.5 |
| A | 0 | 226 | 6283 | 38.89 | 718 | 704 | 143.5 |
| B | 15 | 222 | 20730 | 138.42 | 764 | 745 | 144.4 |
| B | 12 | 111 | 16437 | 108.69 | 764 | 745 | 144.4 |
| B | 11 | 111 | 14483 | 95.15 | 764 | 745 | 144.4 |
| C | 14 | 238 | 115369 | 675.45 | 735 | 741 | 169.7 |
| C | 3 | 233 | 72079 | 420.36 | 735 | 741 | 169.7 |
| C | 0 | 207 | 9453 | 51.34 | 735 | 741 | 169.7 |
| D | 5 | 222 | 304996 | 1689.77 | 745 | 722 | 180.1 |
| D | 13 | 189 | 156699 | 866.21 | 745 | 722 | 180.1 |
| D | 13 | 104 | 71282 | 391.85 | 745 | 722 | 180.1 |
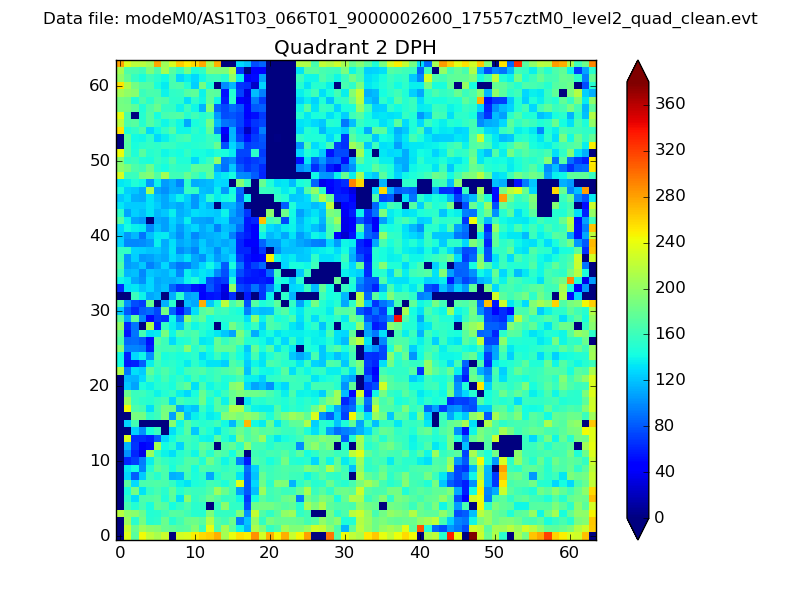
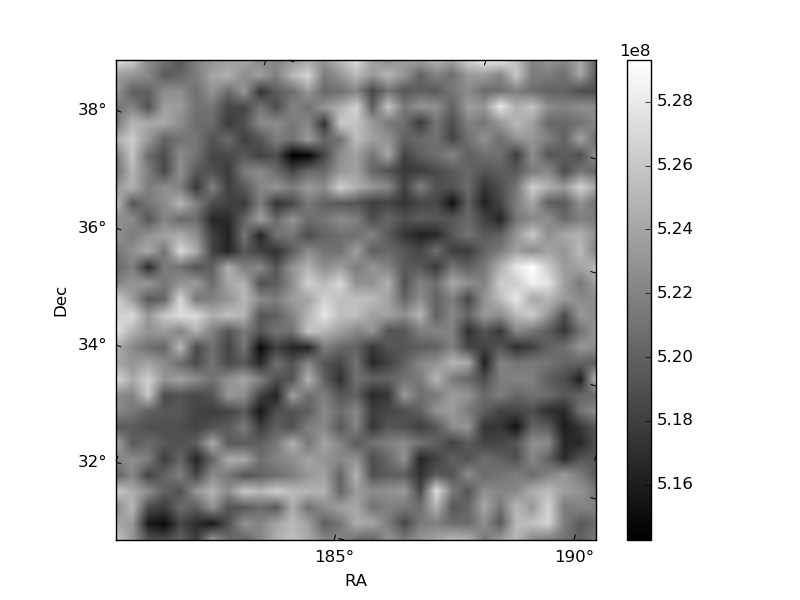
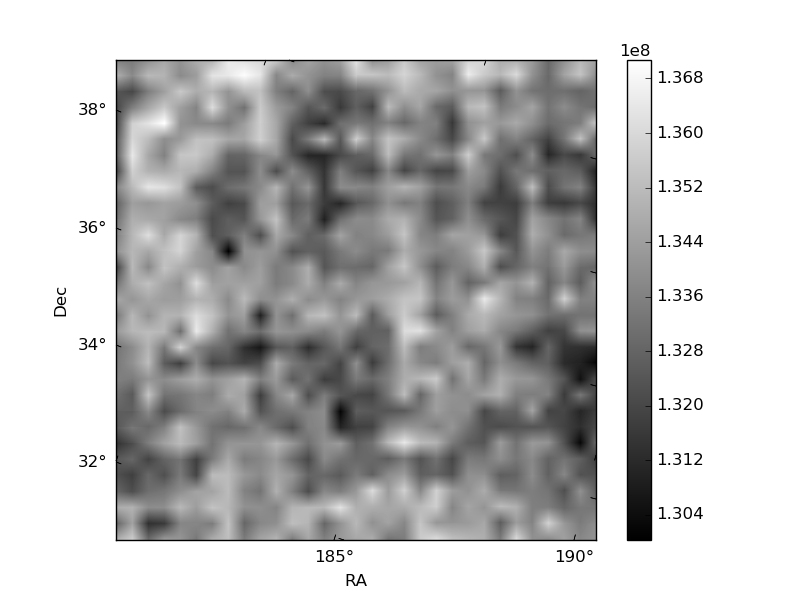
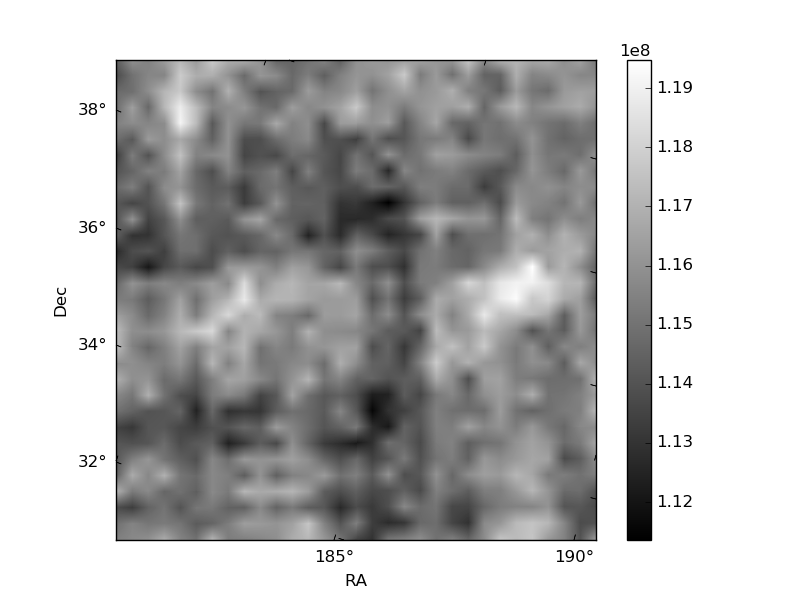
Histogram calculated using DETX and DETY for each event in the final _common_clean file
| Quadrant A | 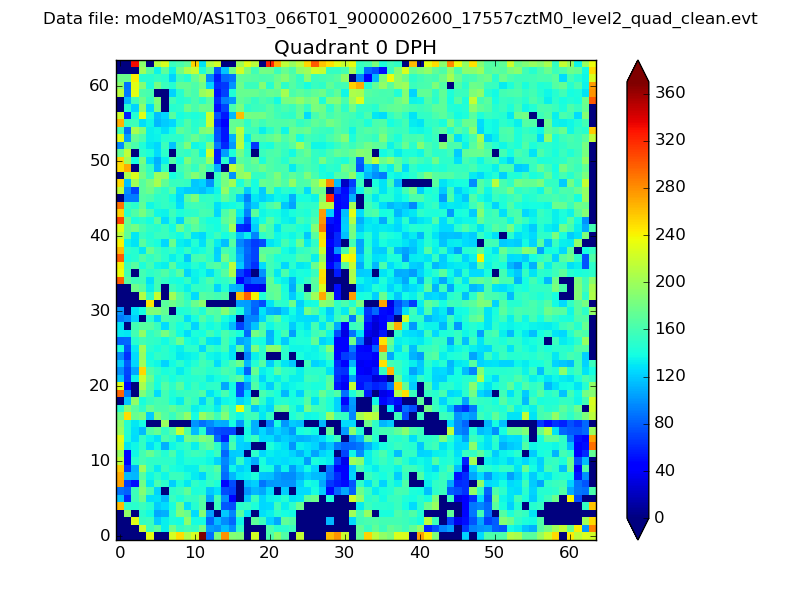 |
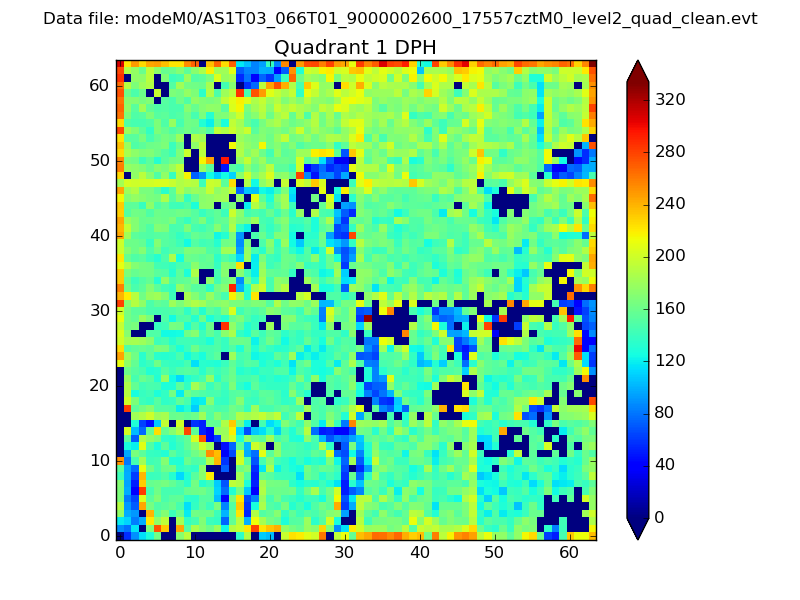 |
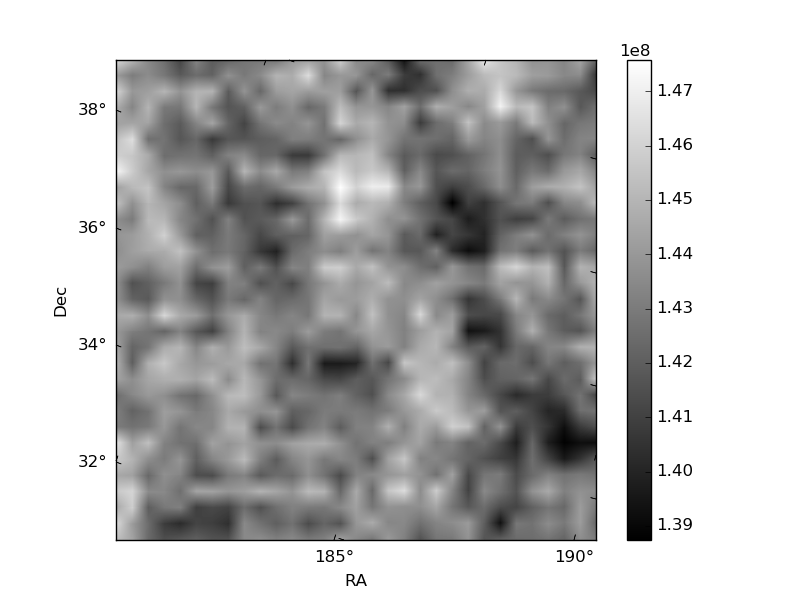
Quadrant B |
|---|---|---|---|
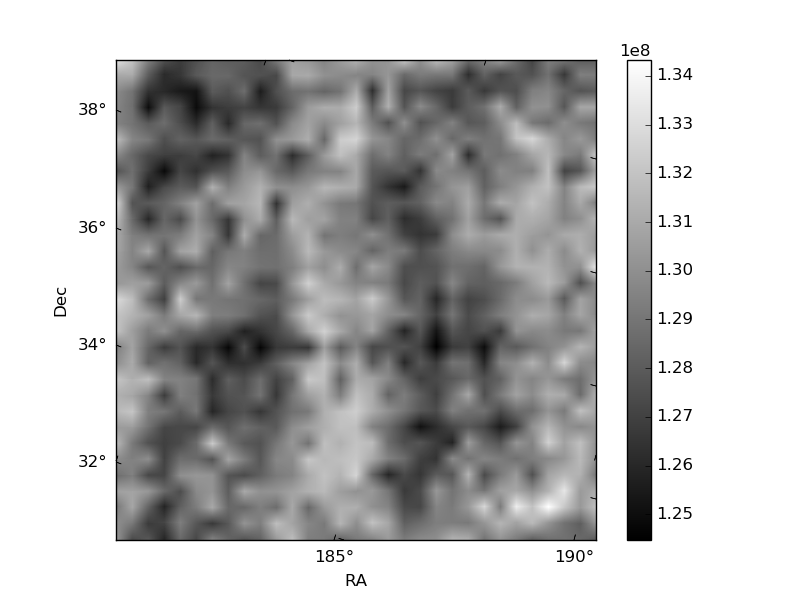
| Quadrant D | 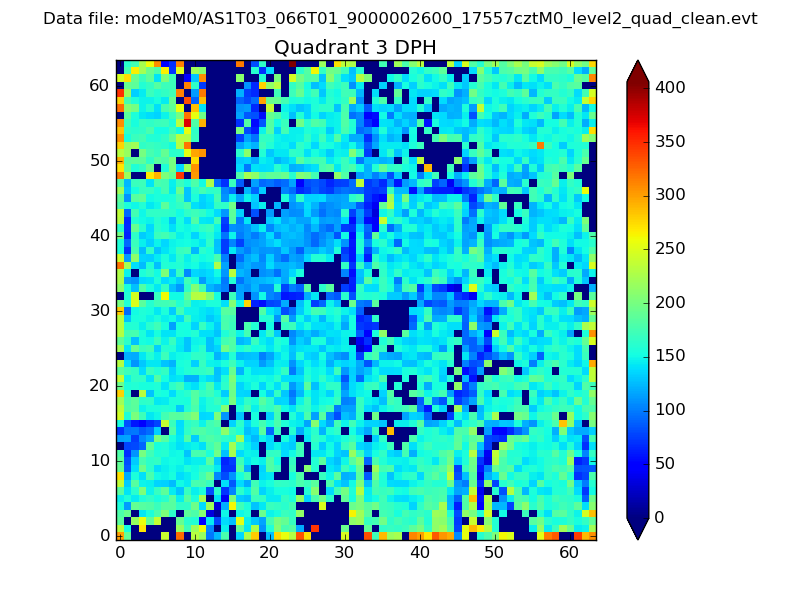 |
 |
Quadrant C |
| Plot type | Count rate plots | Images |
|---|---|---|
| Comparison with Poisson distribution Blue bars denote a histogram of data divided into 1 sec bins. Red curve is a Poisson curve with rate = median count rate of data. |
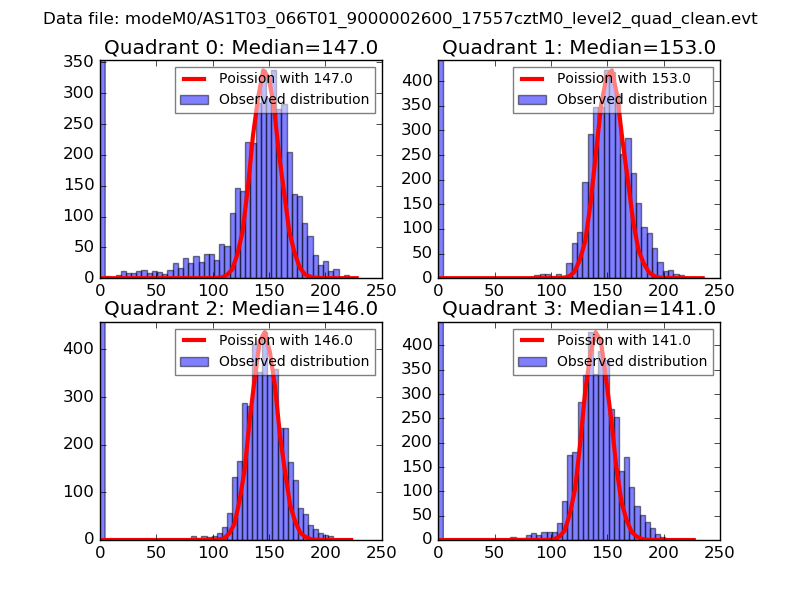 |
 |
| Quadrant-wise count rates Data is divided into 100 sec bins |
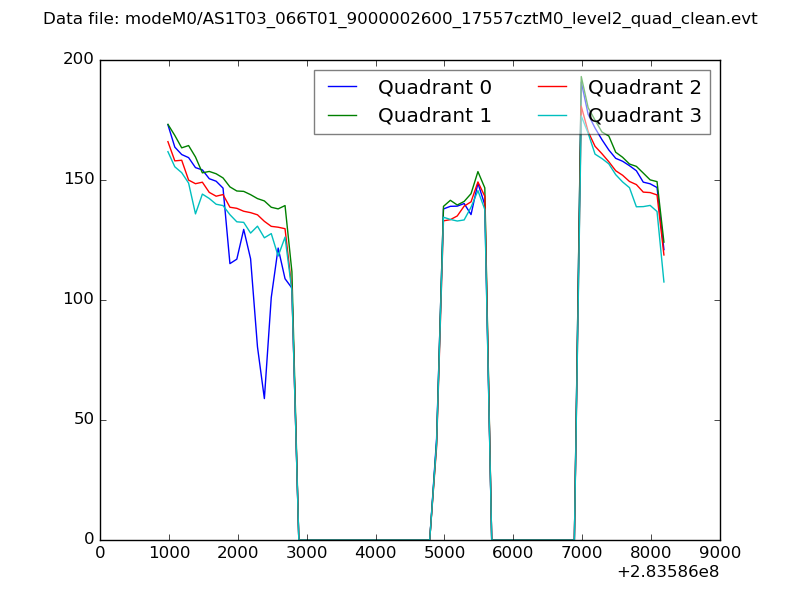 |
|
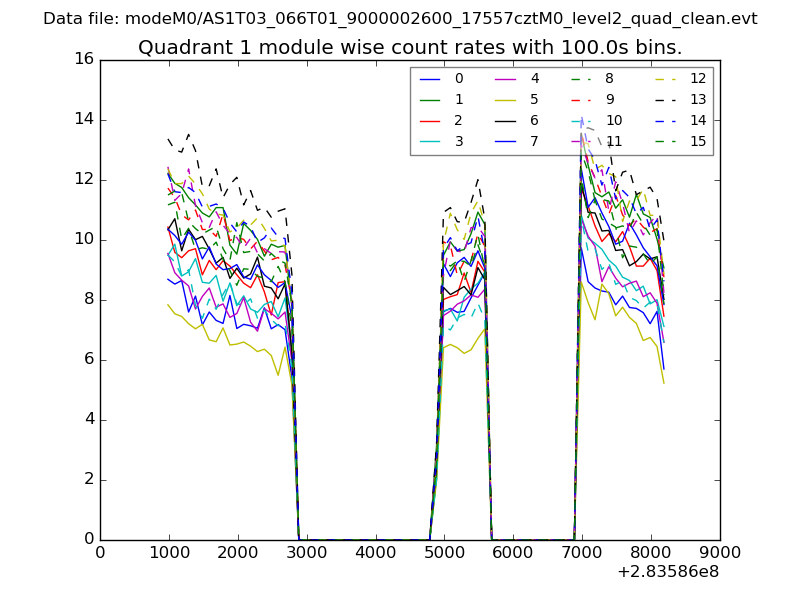
| Module-wise count rates for Quadrant A Data is divided into 100 sec bins |
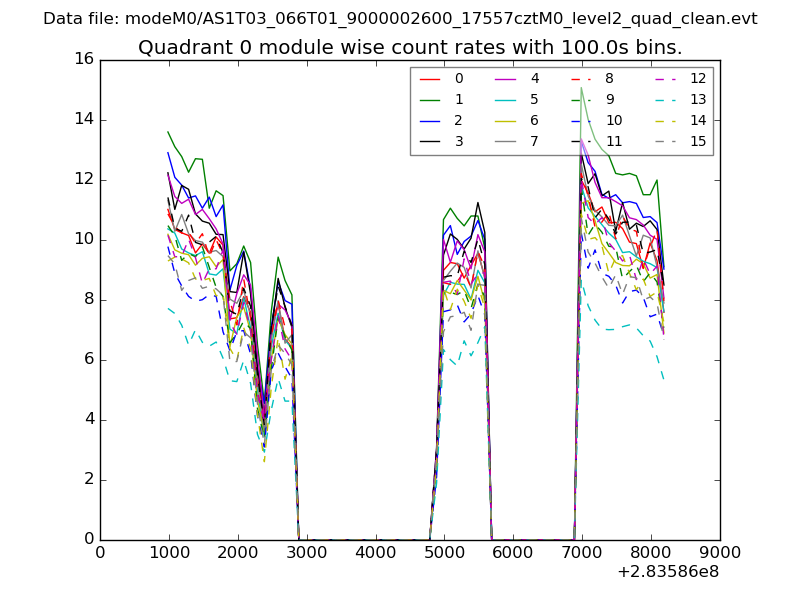 |
 |
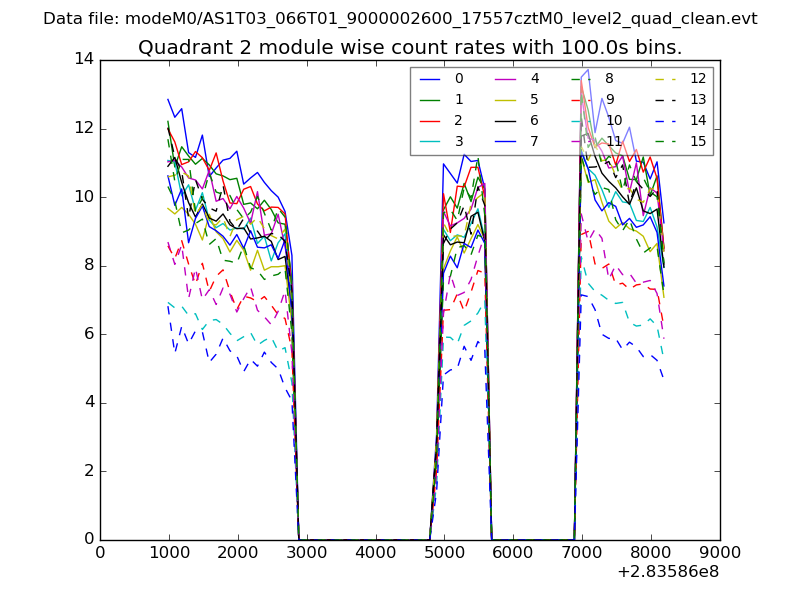
| Module-wise count rates for Quadrant B Data is divided into 100 sec bins |
 |
 |
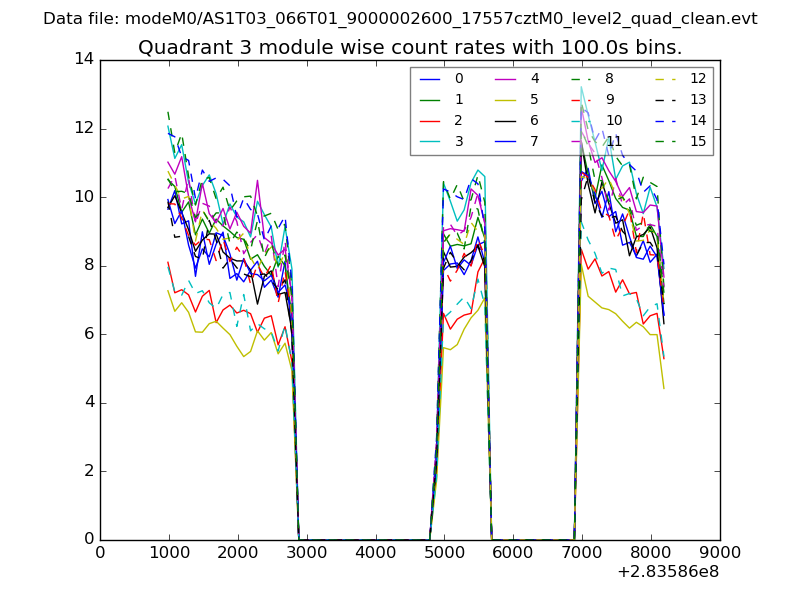
| Module-wise count rates for Quadrant C Data is divided into 100 sec bins |
 |
 |
| Module-wise count rates for Quadrant D Data is divided into 100 sec bins |
 |
 |
| Parameter | Plot |
|---|---|
| CZT HV Monitor | 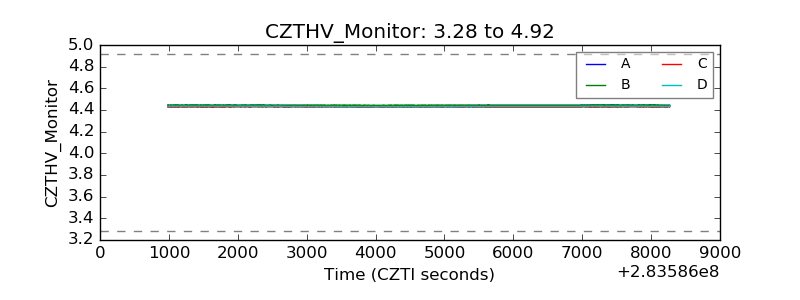 |
| D_VDD | 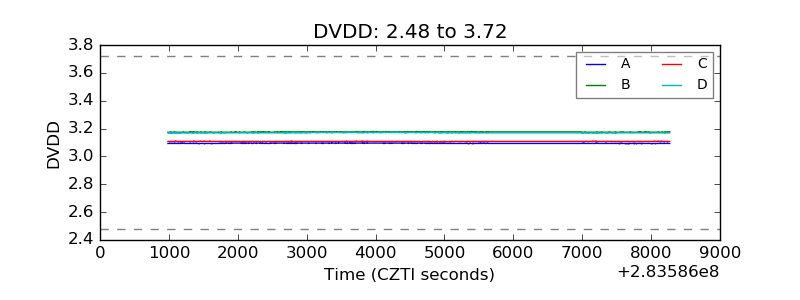 |
| Temperature 1 |  |
| Veto HV Monitor | 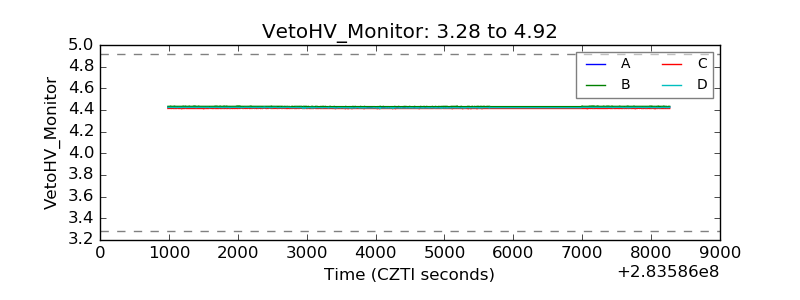 |
| Veto LLD | 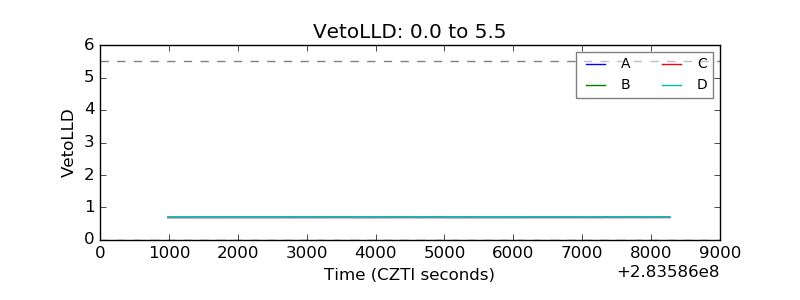 |
| Alpha Counter | 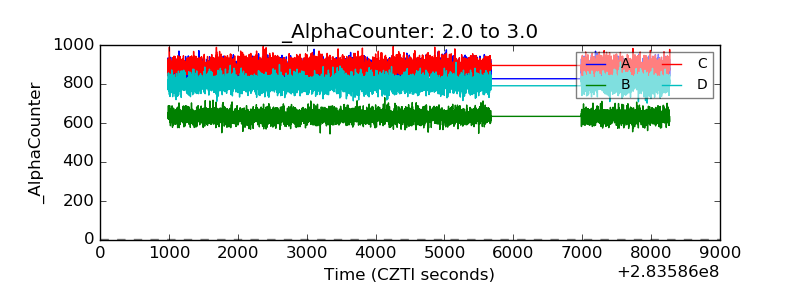 |
| _CPM_Rate | 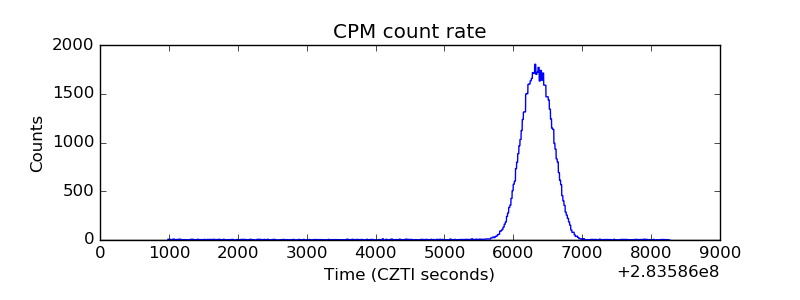 |
| CZT Counter | 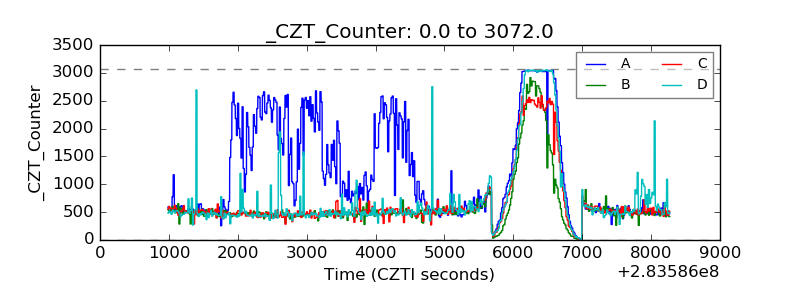 |
| +2.5 Volts monitor |  |
| +5 Volts monitor |  |
| _ROLL_ROT |  |
| _Roll_DEC | 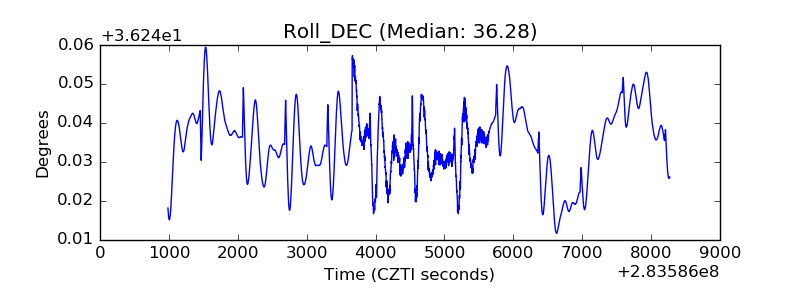 |
| _Roll_RA | 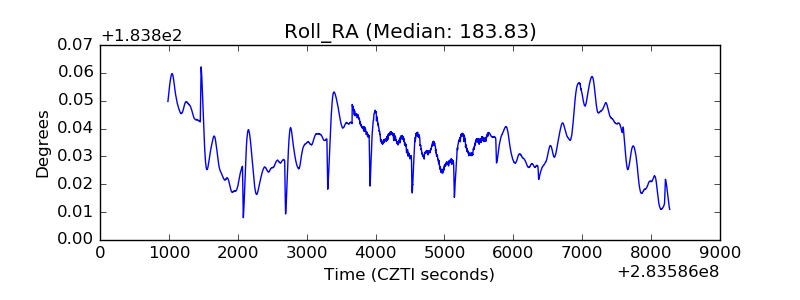 |
| Veto Counter | 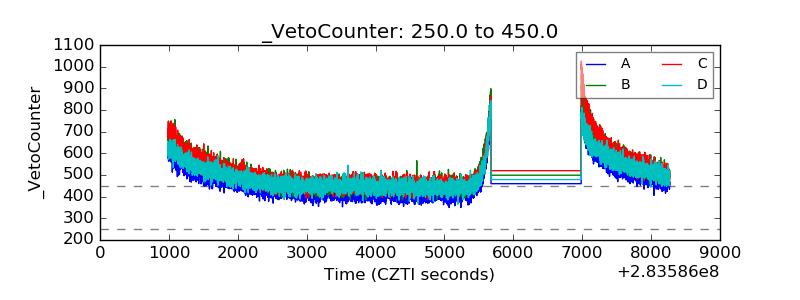 |