| Param | Original file | Final file |
|---|---|---|
| Filename | modeM0/AS1T03_066T01_9000002600_17559cztM0_level2.evt | modeM0/AS1T03_066T01_9000002600_17559cztM0_level2_quad_clean.evt |
| Size (bytes) | 298,163,520 | 36,581,760 |
| Size | 284.4 MB | 34.9 MB |
| Events in quadrant A | 3,459,779 | 210,280 |
| Events in quadrant B | 1,738,285 | 220,153 |
| Events in quadrant C | 1,784,694 | 211,098 |
| Events in quadrant D | 1,799,738 | 209,129 |
| Mode SS | |||
|---|---|---|---|
| Quadrant | BADHDUFLAG | Total packets | Discarded packets |
| A | 0 | 72 | 0 |
| B | 0 | 72 | 0 |
| C | 0 | 72 | 0 |
| D | 0 | 72 | 0 |
| Mode M0 | |||
|---|---|---|---|
| Quadrant | BADHDUFLAG | Total packets | Discarded packets |
| A | 0 | 12663 | 0 |
| B | 0 | 7341 | 0 |
| C | 0 | 7407 | 0 |
| D | 0 | 7644 | 0 |
| Quadrant | Total seconds | Saturated seconds | Saturation percentage |
|---|---|---|---|
| A | 3625 | 440 | 12.137931% |
| B | 3626 | 7 | 0.193050% |
| C | 3626 | 17 | 0.468836% |
| D | 3626 | 24 | 0.661886% |
Noise dominated data is calculated using 1-second bins in cleaned event files. If a bin has >2000 counts, and if more than 50% of those come from <1% of pixels, then it is considered to be noise-dominated and hence unusable.
| Quadrant | # 1 sec bins | Bins with >0 counts | Bins with >2000 counts | High rate bins dominated by noise | Noise dominated (total time) | Noise dominated (detector-on time) | Marked lightcurve |
|---|---|---|---|---|---|---|---|
| A | 3625 | 3625 | 357 | 357 | 9.85% | 9.85% | 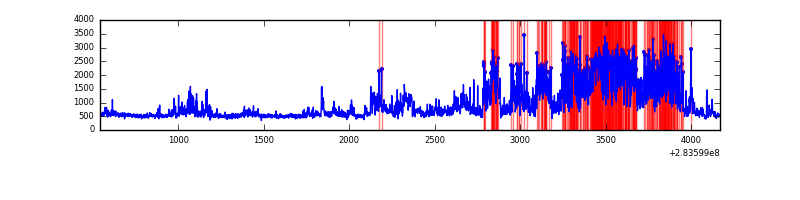 |
| B | 3626 | 3626 | 1 | 1 | 0.03% | 0.03% | 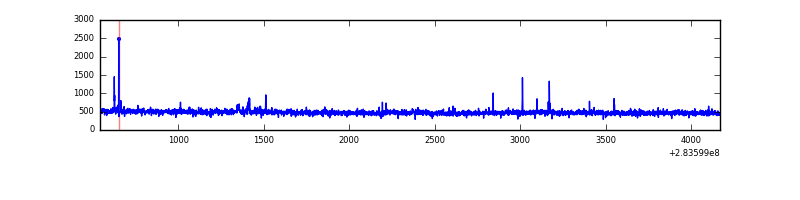 |
| C | 3626 | 3626 | 7 | 7 | 0.19% | 0.19% | 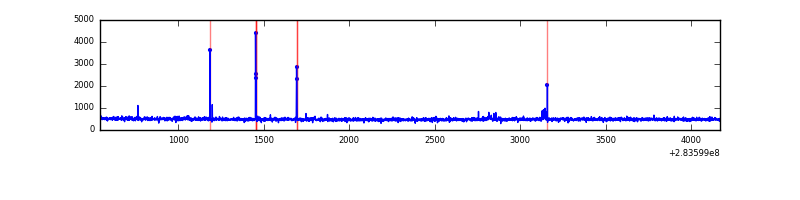 |
| D | 3626 | 3626 | 18 | 18 | 0.50% | 0.50% | 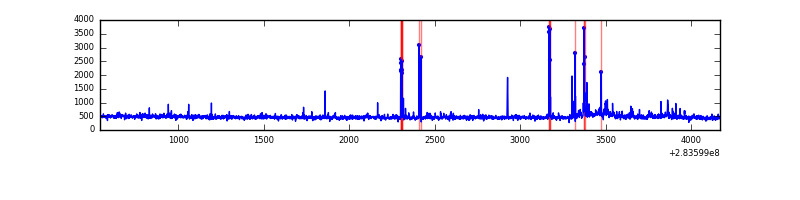 |
Top three noisy pixels from each quadrant. If the there are fewer than three noisy pixels in the level2.evt file, extra rows are filled as -1
| Pixel properties | Quadrant properties | ||||||
|---|---|---|---|---|---|---|---|
| Quadrant | DetID | PixID | Counts | Sigma | Mean | Median | Sigma |
| A | 14 | 237 | 1797169 | 20693.55 | 429 | 421 | 86.8 |
| A | 11 | 47 | 7487 | 81.38 | 429 | 421 | 86.8 |
| A | 0 | 226 | 3799 | 38.91 | 429 | 421 | 86.8 |
| B | 0 | 230 | 10928 | 125.09 | 439 | 429 | 83.9 |
| B | 12 | 111 | 9207 | 104.58 | 439 | 429 | 83.9 |
| B | 11 | 111 | 8269 | 93.41 | 439 | 429 | 83.9 |
| C | 14 | 238 | 67830 | 676.64 | 425 | 429 | 99.6 |
| C | 0 | 207 | 36775 | 364.88 | 425 | 429 | 99.6 |
| C | 3 | 233 | 21170 | 208.22 | 425 | 429 | 99.6 |
| D | 13 | 189 | 68704 | 642.06 | 435 | 423 | 106.3 |
| D | 10 | 70 | 60581 | 565.68 | 435 | 423 | 106.3 |
| D | 2 | 234 | 16946 | 155.37 | 435 | 423 | 106.3 |
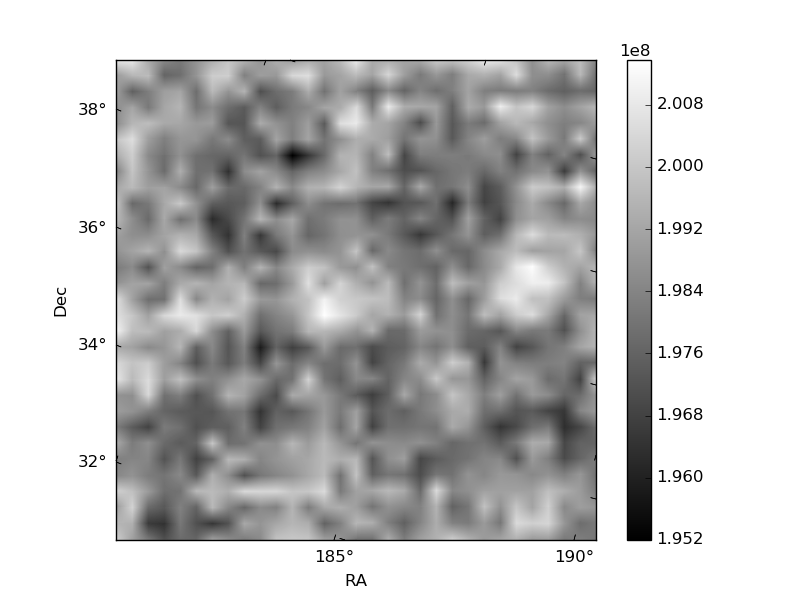
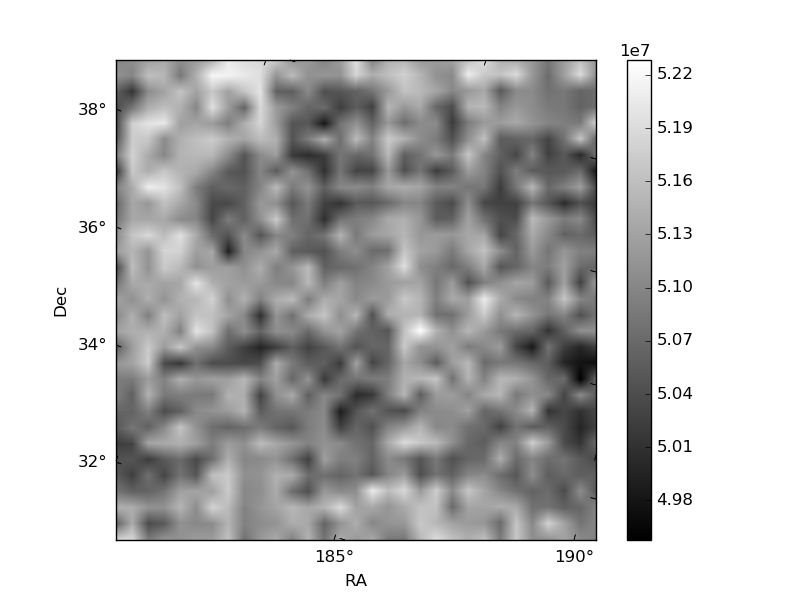
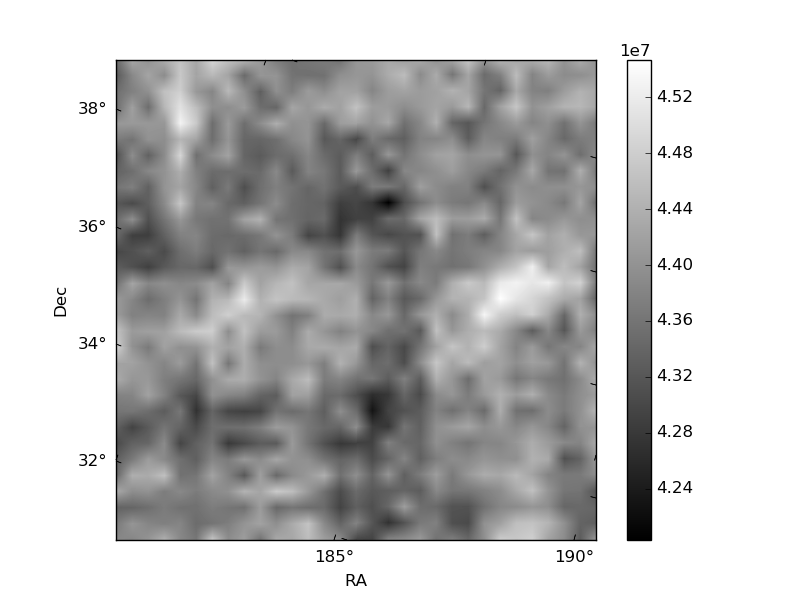
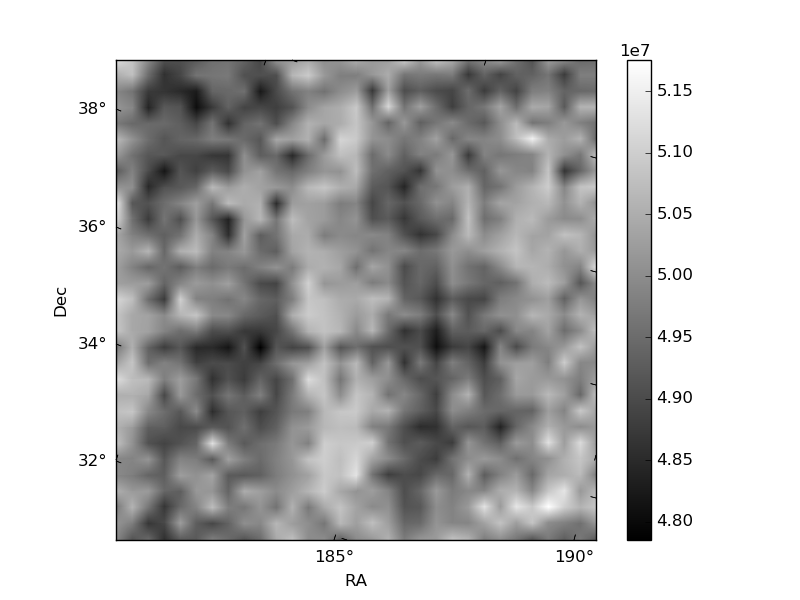
Histogram calculated using DETX and DETY for each event in the final _common_clean file
| Quadrant A | 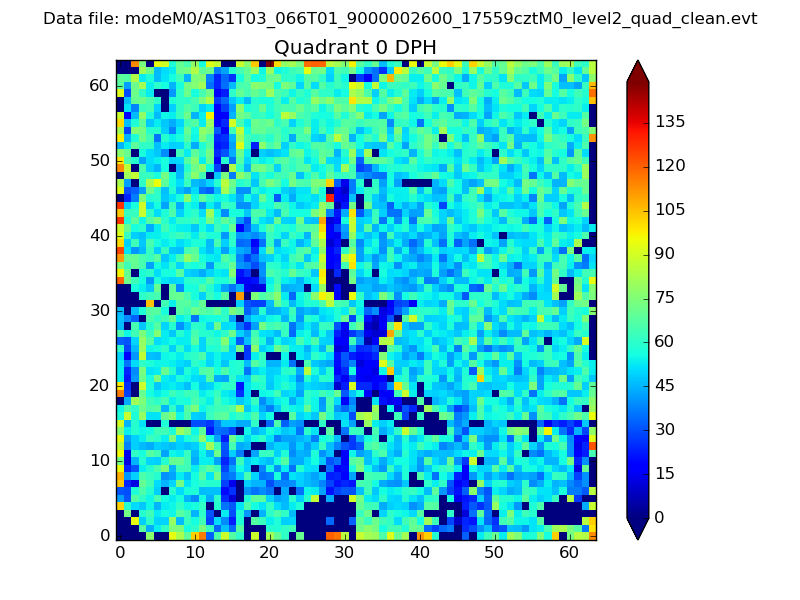 |
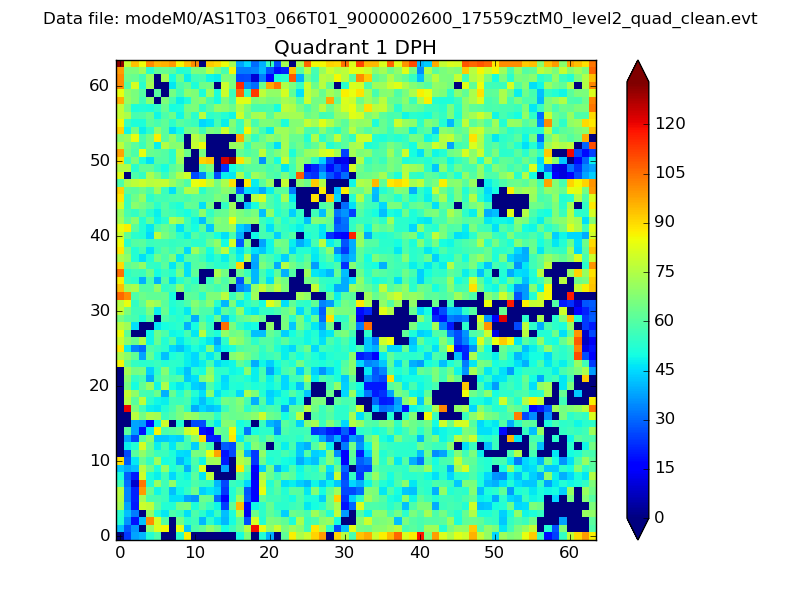 |
Quadrant B |
|---|---|---|---|
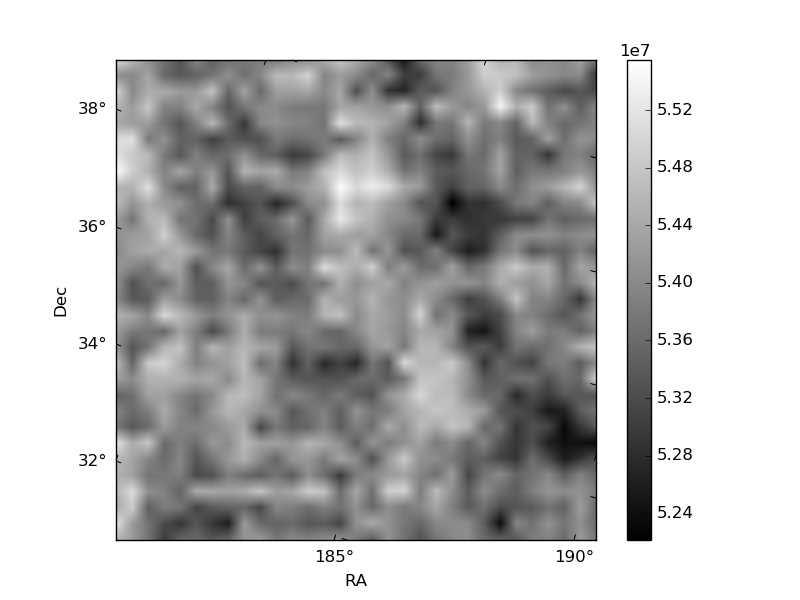
| Quadrant D | 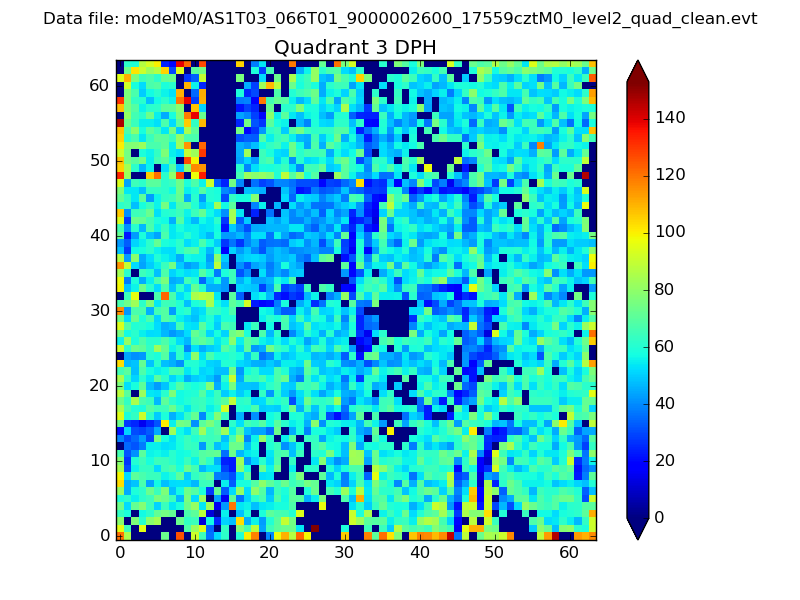 |
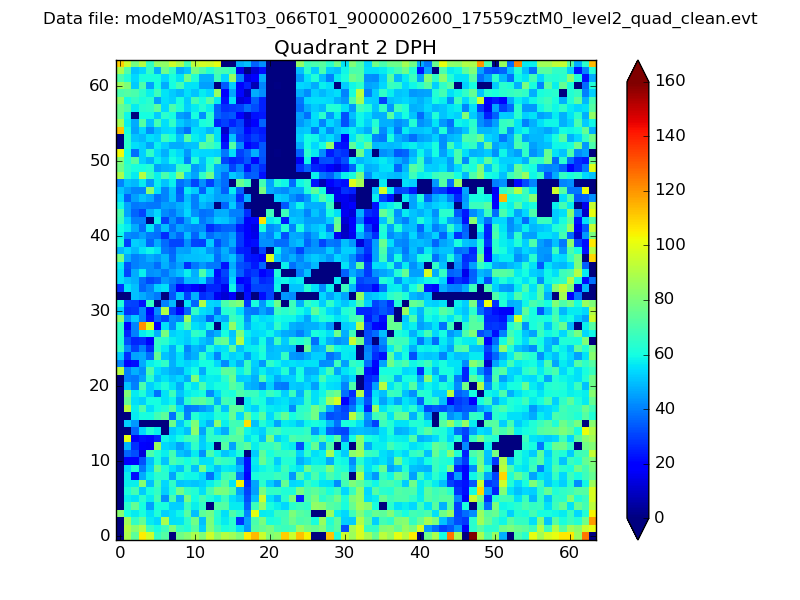 |
Quadrant C |
| Plot type | Count rate plots | Images |
|---|---|---|
| Comparison with Poisson distribution Blue bars denote a histogram of data divided into 1 sec bins. Red curve is a Poisson curve with rate = median count rate of data. |
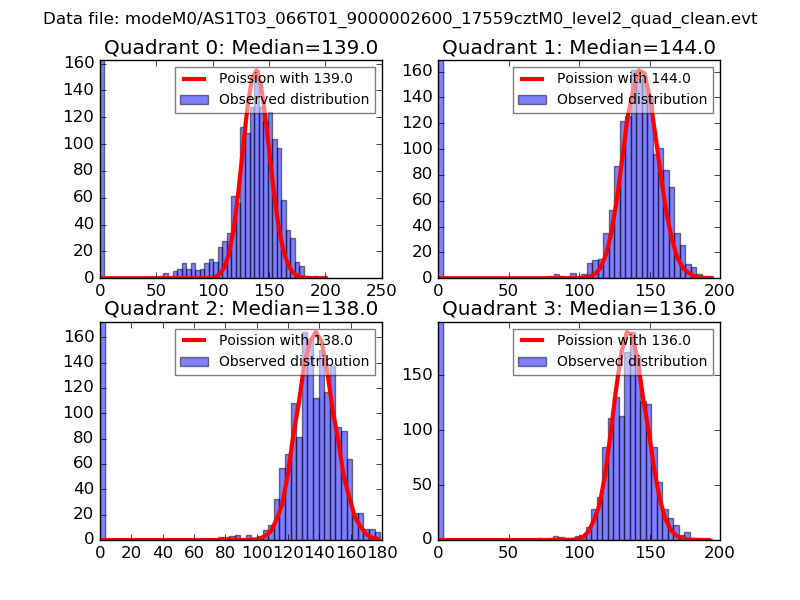 |
 |
| Quadrant-wise count rates Data is divided into 100 sec bins |
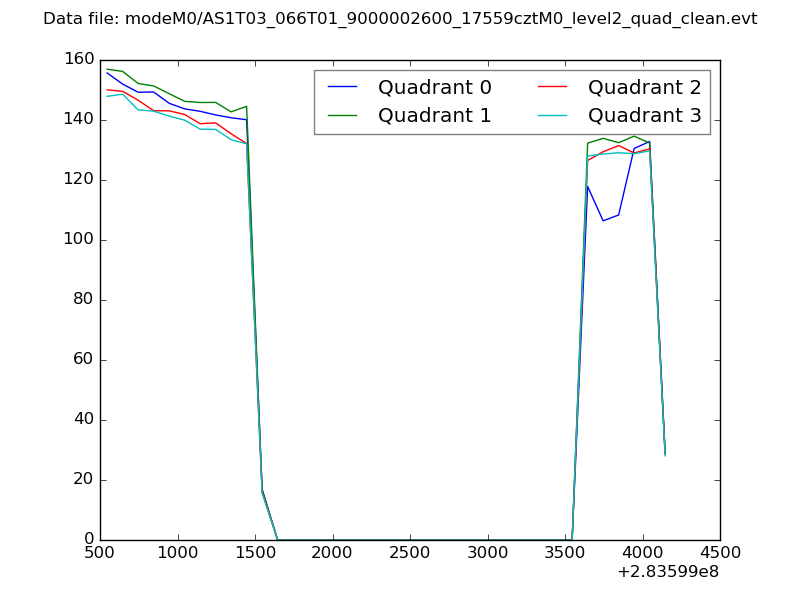 |
|
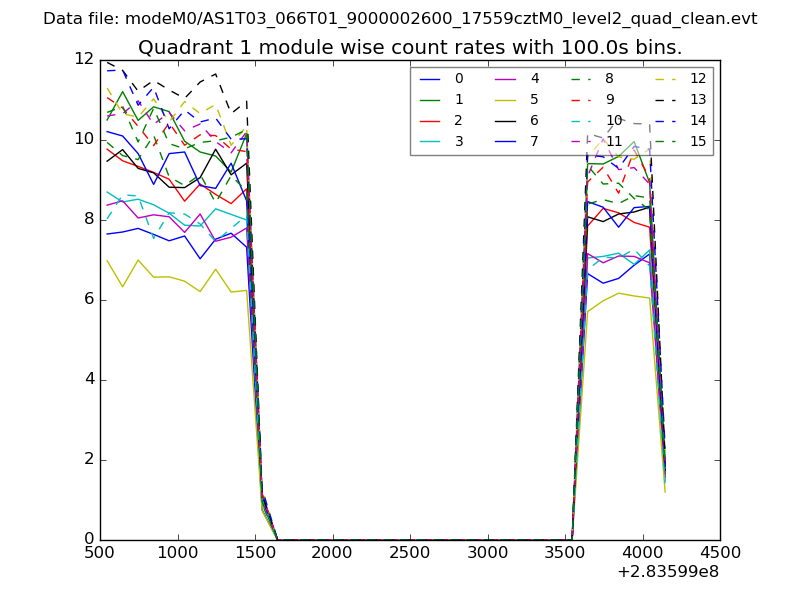
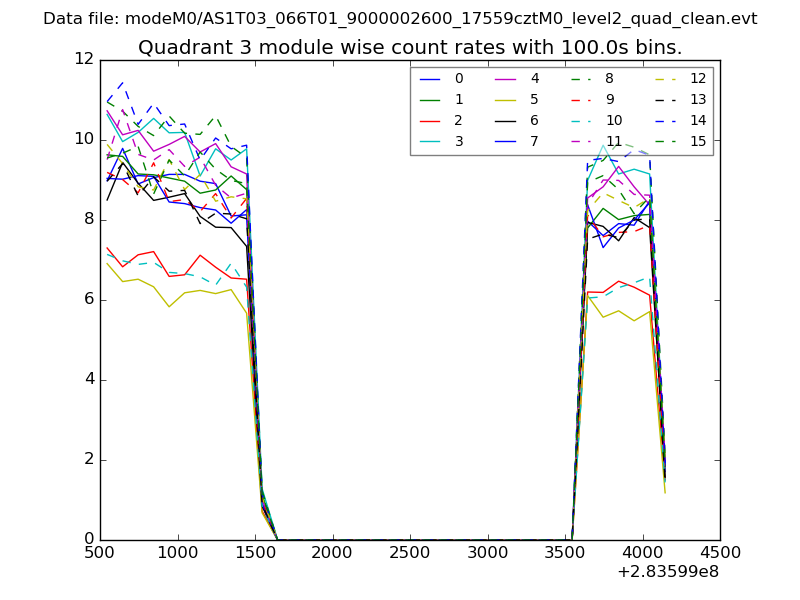
| Module-wise count rates for Quadrant A Data is divided into 100 sec bins |
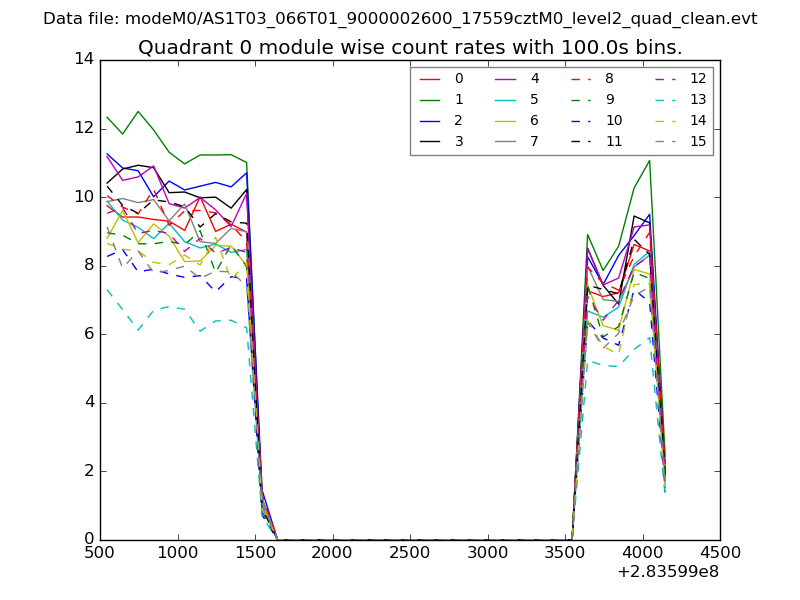 |
 |
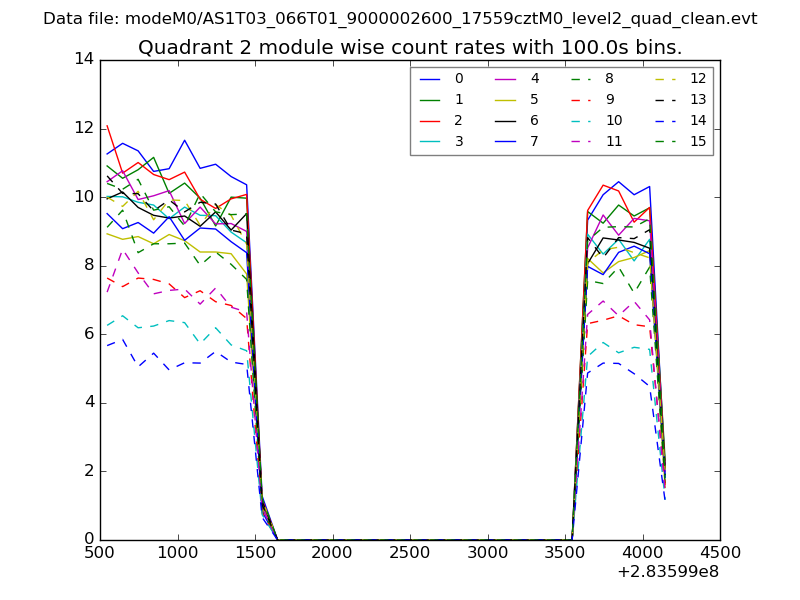
| Module-wise count rates for Quadrant B Data is divided into 100 sec bins |
 |
 |
| Module-wise count rates for Quadrant C Data is divided into 100 sec bins |
 |
 |
| Module-wise count rates for Quadrant D Data is divided into 100 sec bins |
 |
 |
| Parameter | Plot |
|---|---|
| CZT HV Monitor | 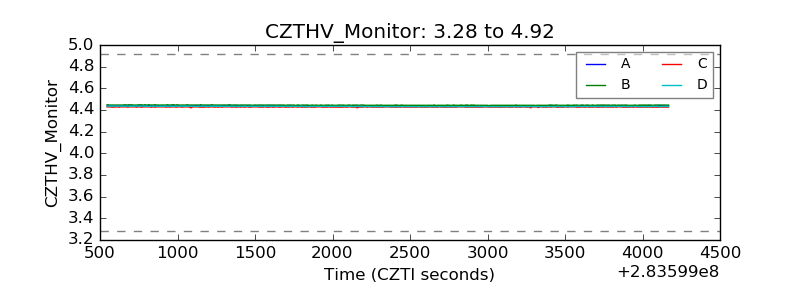 |
| D_VDD | 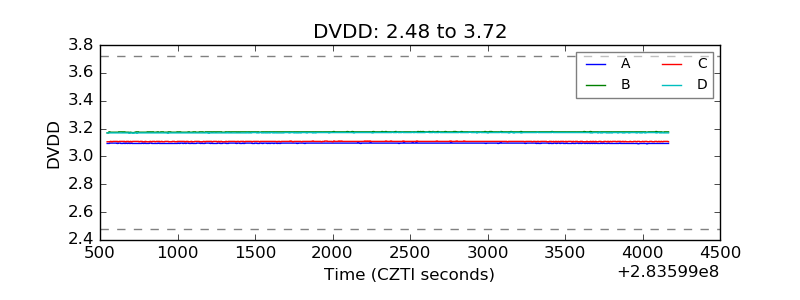 |
| Temperature 1 | 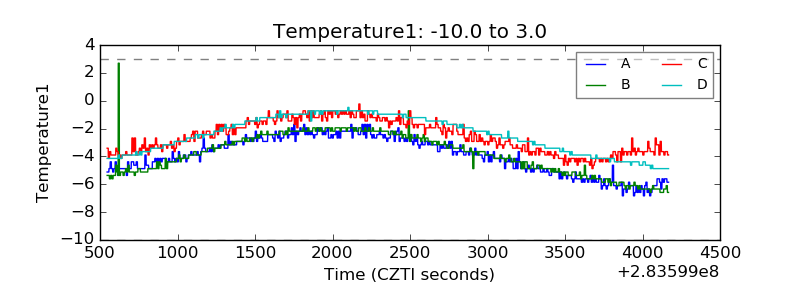 |
| Veto HV Monitor | 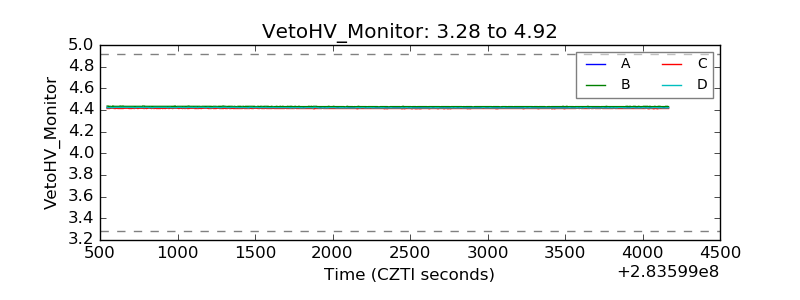 |
| Veto LLD | 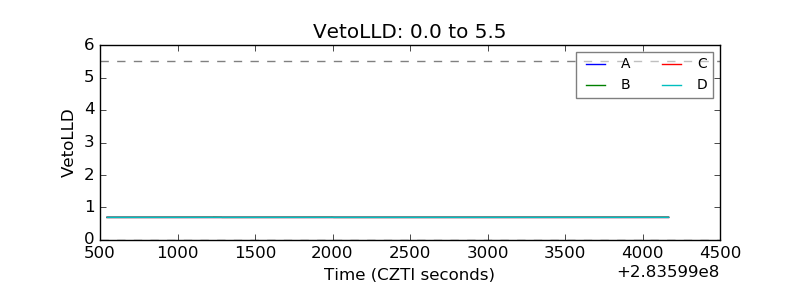 |
| Alpha Counter | 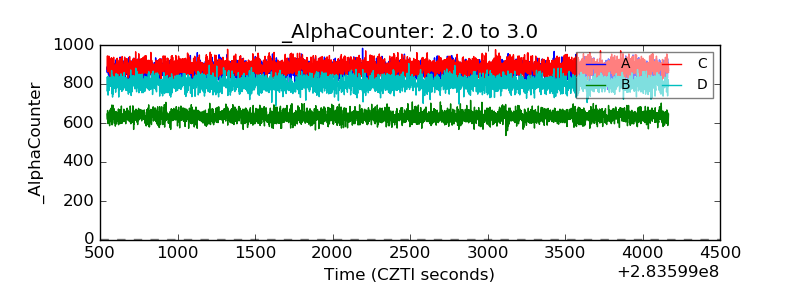 |
| _CPM_Rate | 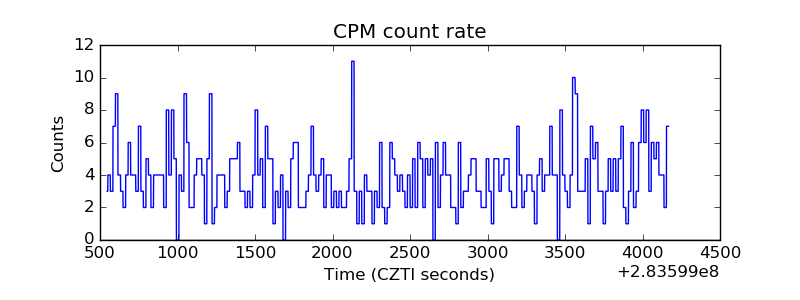 |
| CZT Counter | 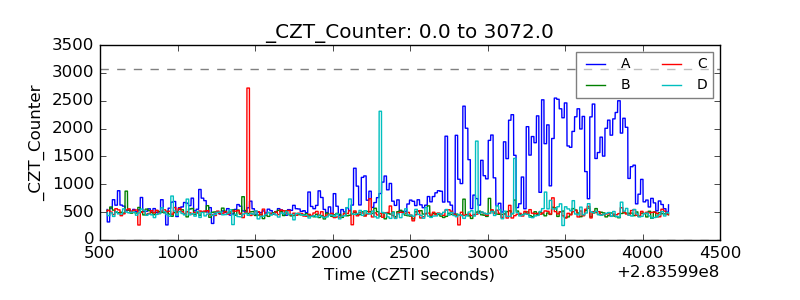 |
| +2.5 Volts monitor |  |
| +5 Volts monitor | 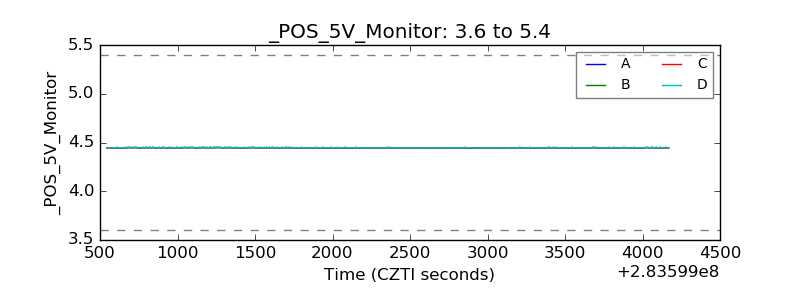 |
| _ROLL_ROT | 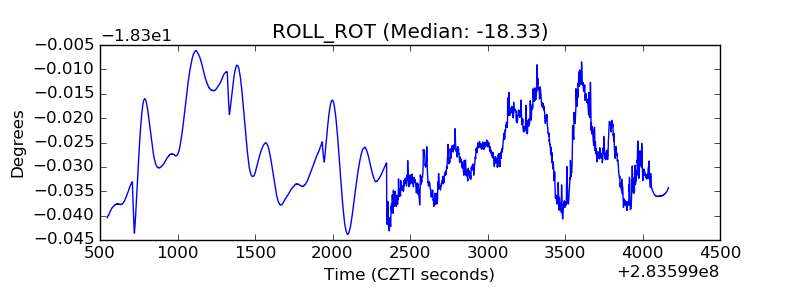 |
| _Roll_DEC | 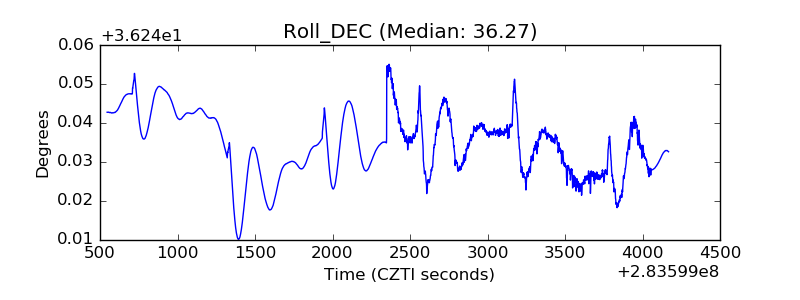 |
| _Roll_RA | 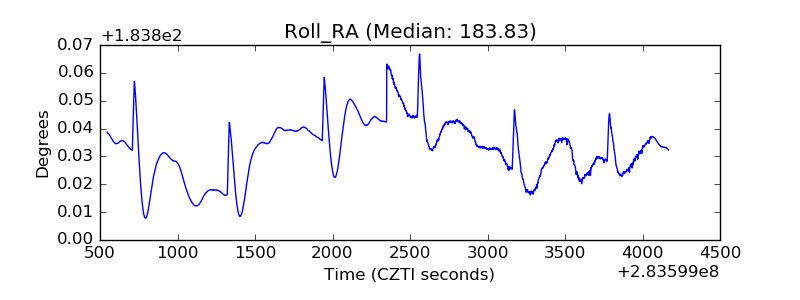 |
| Veto Counter | 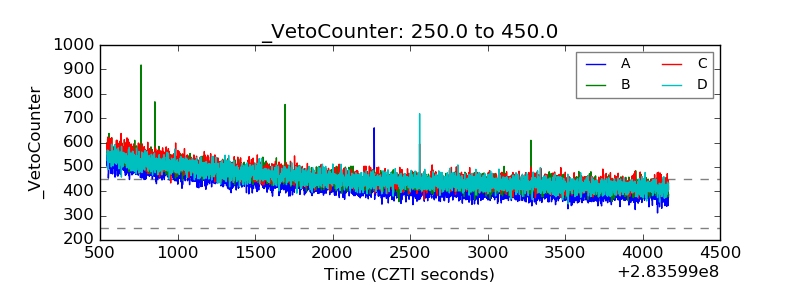 |