| Param | Original file | Final file |
|---|---|---|
| Filename | modeM0/AS1A05_012T02_9000002602cztM0_level2.fits | modeM0/AS1A05_012T02_9000002602cztM0_level2_quad_clean.evt |
| Size (bytes) | 660,925,440 | 638,349,120 |
| Size | 630.3 MB | 608.8 MB |
| Events in quadrant A | 3,888,810 | 3,690,430 |
| Events in quadrant B | 3,911,748 | 3,835,018 |
| Events in quadrant C | 3,952,450 | 3,653,544 |
| Events in quadrant D | 3,473,400 | 3,366,668 |
| Mode M0 | |||
|---|---|---|---|
| Quadrant | BADHDUFLAG | Total packets | Discarded packets |
| A | 0 | 198179 | 0 |
| B | 0 | 146788 | 0 |
| C | 0 | 145673 | 0 |
| D | 0 | 158187 | 0 |
| Mode M9 | |||
|---|---|---|---|
| Quadrant | BADHDUFLAG | Total packets | Discarded packets |
| A | 0 | 113 | 0 |
| B | 0 | 113 | 0 |
| C | 0 | 113 | 0 |
| D | 0 | 113 | 0 |
| Mode SS | |||
|---|---|---|---|
| Quadrant | BADHDUFLAG | Total packets | Discarded packets |
| A | 0 | 1422 | 0 |
| B | 0 | 1422 | 0 |
| C | 0 | 1422 | 0 |
| D | 0 | 1422 | 0 |
| Quadrant | Total seconds | Saturated seconds | Saturation percentage |
|---|---|---|---|
| A | 69803 | 6559 | 9.396444% |
| B | 69803 | 781 | 1.118863% |
| C | 69803 | 918 | 1.315130% |
| D | 69803 | 1601 | 2.293598% |
Noise dominated data is calculated using 1-second bins in cleaned event files. If a bin has >2000 counts, and if more than 50% of those come from <1% of pixels, then it is considered to be noise-dominated and hence unusable.
| Quadrant | # 1 sec bins | Bins with >0 counts | Bins with >2000 counts | High rate bins dominated by noise | Noise dominated (total time) | Noise dominated (detector-on time) | Marked lightcurve |
|---|---|---|---|---|---|---|---|
| A | 81133 | 69646 | 0 | 0 | 0.00% | 0.00% |  |
| B | 81133 | 69796 | 0 | 0 | 0.00% | 0.00% |  |
| C | 81133 | 69800 | 0 | 0 | 0.00% | 0.00% |  |
| D | 81133 | 69789 | 0 | 0 | 0.00% | 0.00% |  |
Top three noisy pixels from each quadrant. If the there are fewer than three noisy pixels in the level2.evt file, extra rows are filled as -1
| Pixel properties | Quadrant properties | ||||||
|---|---|---|---|---|---|---|---|
| Quadrant | DetID | PixID | Counts | Sigma | Mean | Median | Sigma |
| A | 0 | 29 | 3334 | 9.5 | 1013 | 951 | 250.7 |
| A | 7 | 110 | 3084 | 8.51 | 1013 | 951 | 250.7 |
| A | 9 | 19 | 2942 | 7.94 | 1013 | 951 | 250.7 |
| B | 2 | 9 | 3167 | 10.75 | 1034 | 988 | 202.6 |
| B | 3 | 17 | 2662 | 8.26 | 1034 | 988 | 202.6 |
| B | 2 | 8 | 2644 | 8.17 | 1034 | 988 | 202.6 |
| C | 12 | 241 | 2771 | 6.74 | 1045 | 976 | 266.4 |
| C | 9 | 233 | 2649 | 6.28 | 1045 | 976 | 266.4 |
| C | 3 | 126 | 2622 | 6.18 | 1045 | 976 | 266.4 |
| D | 6 | 231 | 2563 | 6.33 | 990 | 902 | 262.3 |
| D | 3 | 14 | 2500 | 6.09 | 990 | 902 | 262.3 |
| D | 3 | 31 | 2419 | 5.78 | 990 | 902 | 262.3 |
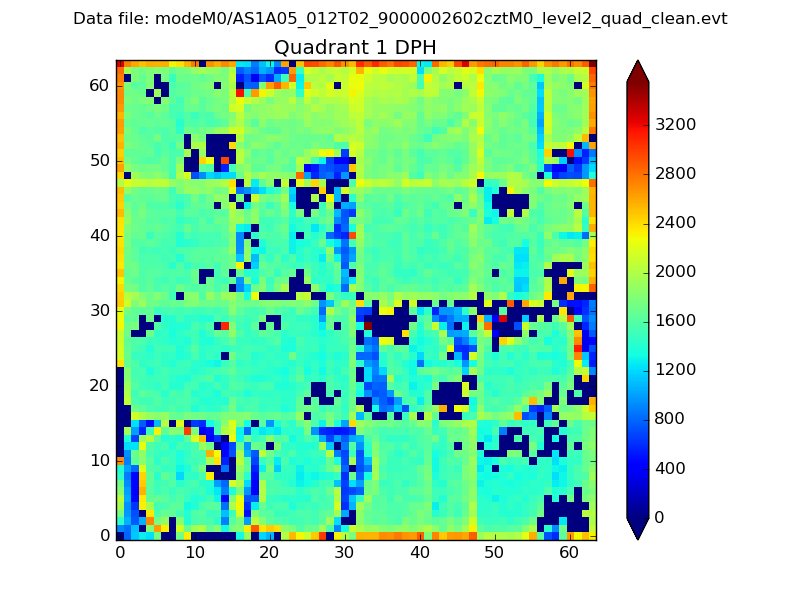
Histogram calculated using DETX and DETY for each event in the final _common_clean file
| Quadrant A |  |
 |
Quadrant B |
|---|---|---|---|
| Quadrant D |  |
 |
Quadrant C |
| Plot type | Count rate plots | Images |
|---|---|---|
| Comparison with Poisson distribution Blue bars denote a histogram of data divided into 1 sec bins. Red curve is a Poisson curve with rate = median count rate of data. |
 |
 |
| Quadrant-wise count rates Data is divided into 100 sec bins |
 |
|
| Module-wise count rates for Quadrant A Data is divided into 100 sec bins |
 |
 |
| Module-wise count rates for Quadrant B Data is divided into 100 sec bins |
 |
 |
| Module-wise count rates for Quadrant C Data is divided into 100 sec bins |
 |
 |
| Module-wise count rates for Quadrant D Data is divided into 100 sec bins |
 |
 |
| Parameter | Plot |
|---|---|
| CZT HV Monitor |  |
| D_VDD | 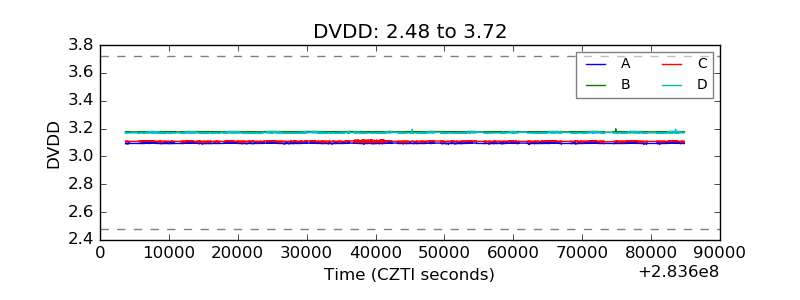 |
| Temperature 1 |  |
| Veto HV Monitor |  |
| Veto LLD |  |
| Alpha Counter |  |
| _CPM_Rate | 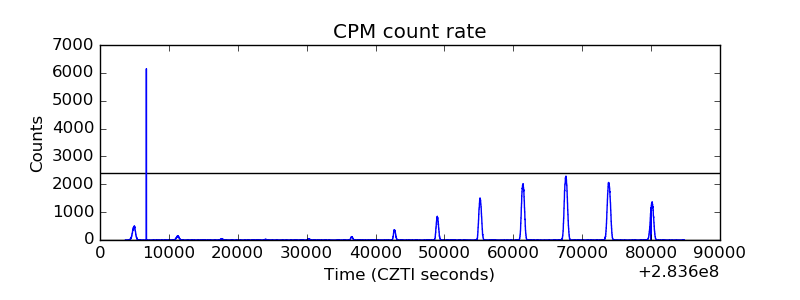 |
| CZT Counter |  |
| +2.5 Volts monitor |  |
| +5 Volts monitor |  |
| _ROLL_ROT |  |
| _Roll_DEC |  |
| _Roll_RA | 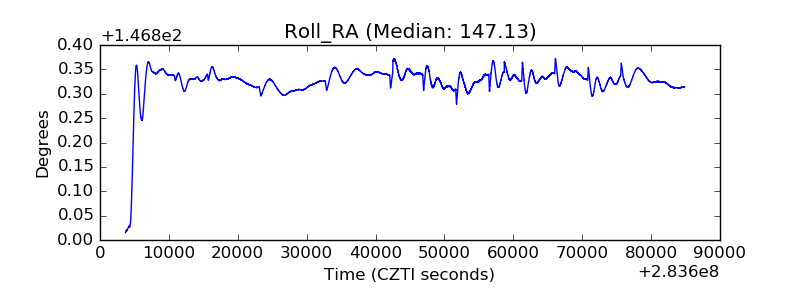 |
| Veto Counter | 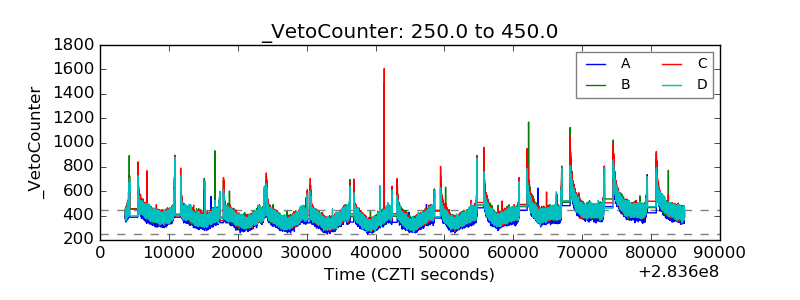 |