| Param | Original file | Final file |
|---|---|---|
| Filename | modeM0/AS1A05_012T02_9000002602_17559cztM0_level2.evt | modeM0/AS1A05_012T02_9000002602_17559cztM0_level2_quad_clean.evt |
| Size (bytes) | 165,087,360 | 25,341,120 |
| Size | 157.4 MB | 24.2 MB |
| Events in quadrant A | 1,154,264 | 156,403 |
| Events in quadrant B | 1,125,754 | 157,535 |
| Events in quadrant C | 1,164,995 | 151,075 |
| Events in quadrant D | 1,406,097 | 145,853 |
| Mode M0 | |||
|---|---|---|---|
| Quadrant | BADHDUFLAG | Total packets | Discarded packets |
| A | 0 | 4671 | 1 |
| B | 0 | 4606 | 1 |
| C | 0 | 4677 | 1 |
| D | 0 | 5562 | 1 |
| Mode M9 | |||
|---|---|---|---|
| Quadrant | BADHDUFLAG | Total packets | Discarded packets |
| A | 0 | 11 | 0 |
| B | 0 | 11 | 0 |
| C | 0 | 11 | 0 |
| D | 0 | 11 | 0 |
| Mode SS | |||
|---|---|---|---|
| Quadrant | BADHDUFLAG | Total packets | Discarded packets |
| A | 0 | 46 | 0 |
| B | 0 | 46 | 0 |
| C | 0 | 46 | 0 |
| D | 0 | 46 | 0 |
| Quadrant | Total seconds | Saturated seconds | Saturation percentage |
|---|---|---|---|
| A | 2149 | 69 | 3.210796% |
| B | 2149 | 80 | 3.722662% |
| C | 2149 | 83 | 3.862262% |
| D | 2149 | 127 | 5.909725% |
Noise dominated data is calculated using 1-second bins in cleaned event files. If a bin has >2000 counts, and if more than 50% of those come from <1% of pixels, then it is considered to be noise-dominated and hence unusable.
| Quadrant | # 1 sec bins | Bins with >0 counts | Bins with >2000 counts | High rate bins dominated by noise | Noise dominated (total time) | Noise dominated (detector-on time) | Marked lightcurve |
|---|---|---|---|---|---|---|---|
| A | 3339 | 2149 | 1 | 1 | 0.03% | 0.05% | 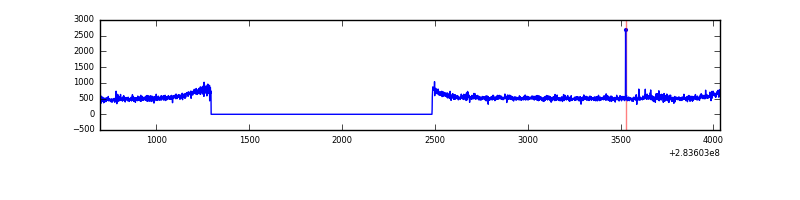 |
| B | 3339 | 2150 | 0 | 0 | 0.00% | 0.00% | 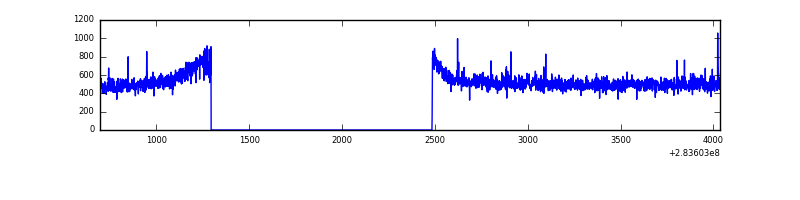 |
| C | 3339 | 2150 | 5 | 5 | 0.15% | 0.23% | 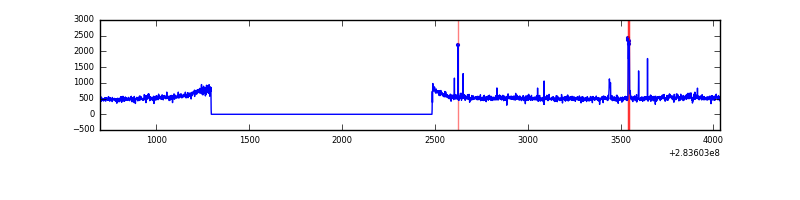 |
| D | 3339 | 2150 | 53 | 53 | 1.59% | 2.47% | 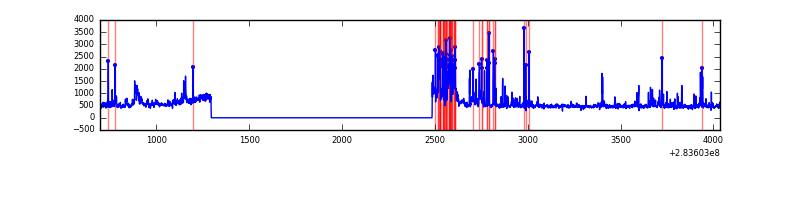 |
Top three noisy pixels from each quadrant. If the there are fewer than three noisy pixels in the level2.evt file, extra rows are filled as -1
| Pixel properties | Quadrant properties | ||||||
|---|---|---|---|---|---|---|---|
| Quadrant | DetID | PixID | Counts | Sigma | Mean | Median | Sigma |
| A | 14 | 237 | 41808 | 700.75 | 288 | 282 | 59.3 |
| A | 11 | 47 | 2911 | 44.36 | 288 | 282 | 59.3 |
| A | 0 | 226 | 2564 | 38.51 | 288 | 282 | 59.3 |
| B | 12 | 111 | 6388 | 108.67 | 283 | 276 | 56.2 |
| B | 11 | 111 | 5755 | 97.42 | 283 | 276 | 56.2 |
| B | 14 | 111 | 4718 | 78.98 | 283 | 276 | 56.2 |
| C | 14 | 238 | 41166 | 631.58 | 270 | 271 | 64.7 |
| C | 3 | 233 | 35959 | 551.17 | 270 | 271 | 64.7 |
| C | 5 | 112 | 24300 | 371.1 | 270 | 271 | 64.7 |
| D | 7 | 238 | 126455 | 1847.28 | 275 | 266 | 68.3 |
| D | 13 | 189 | 117486 | 1715.98 | 275 | 266 | 68.3 |
| D | 10 | 70 | 60243 | 878.0 | 275 | 266 | 68.3 |
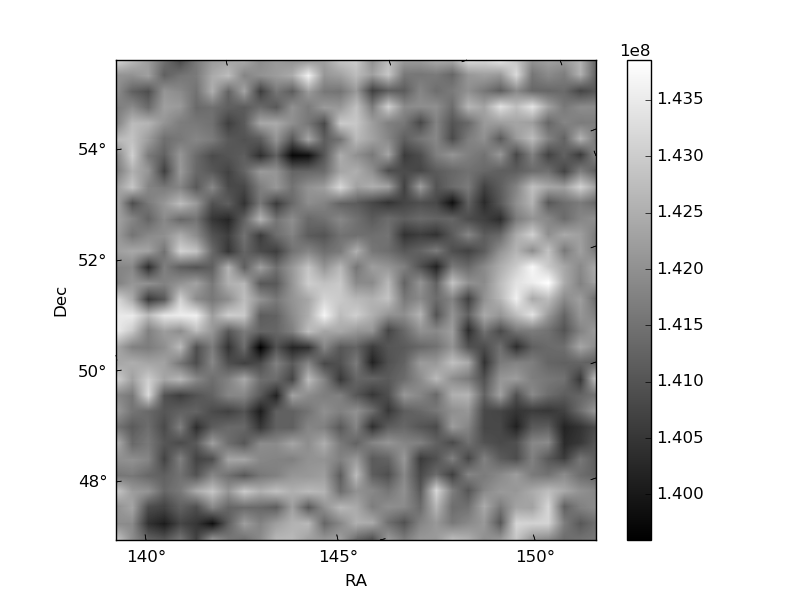
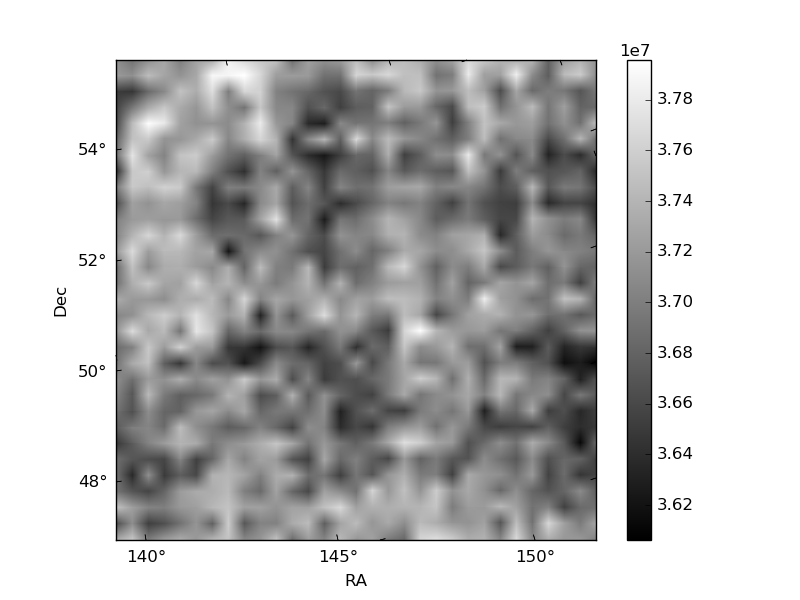
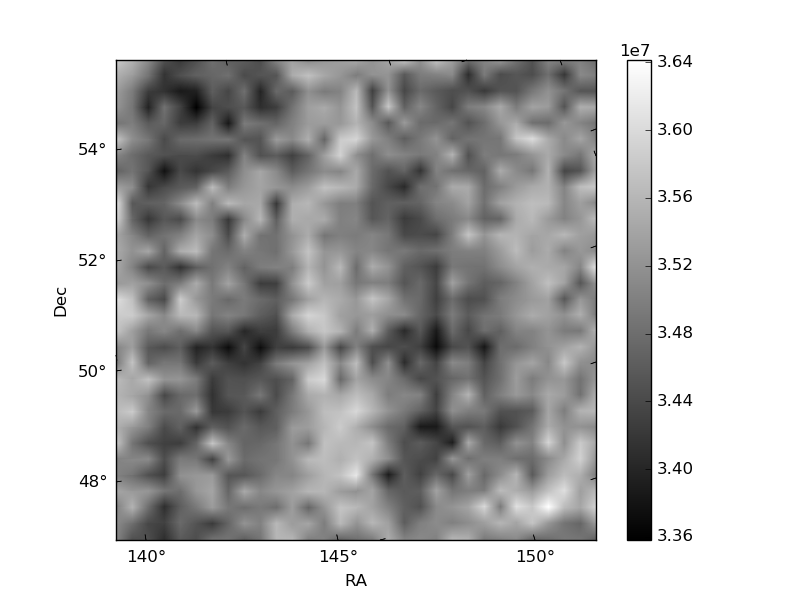
Histogram calculated using DETX and DETY for each event in the final _common_clean file
| Quadrant A | 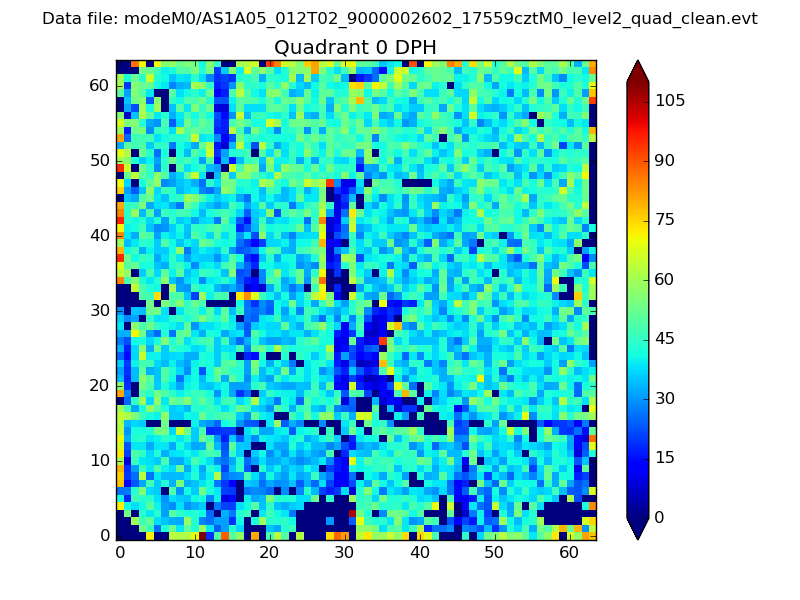 |
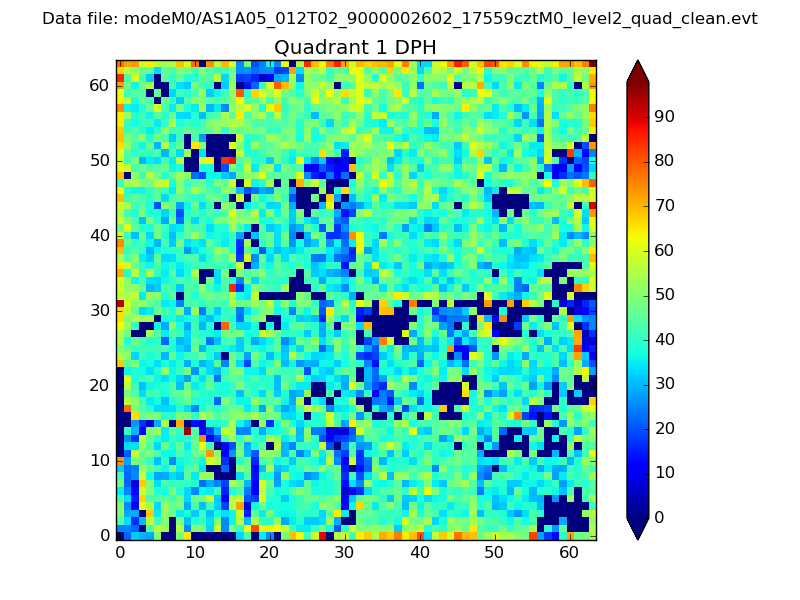 |
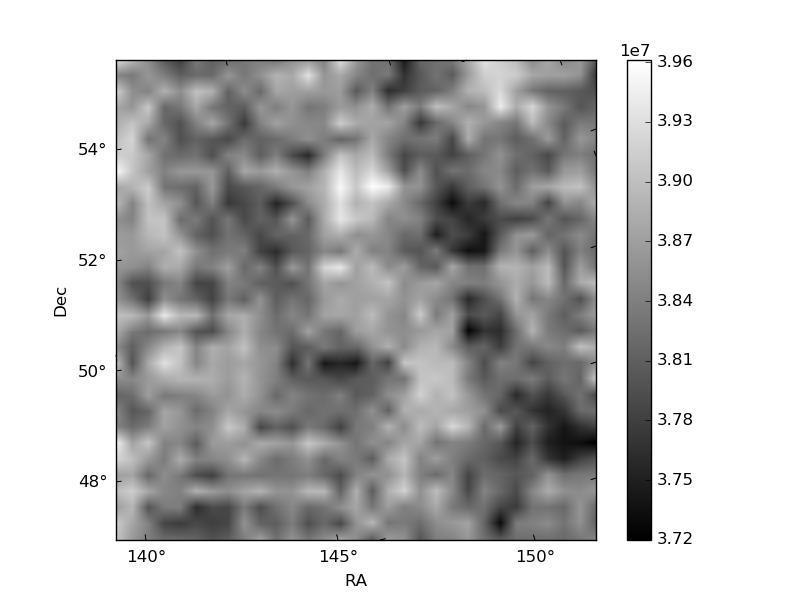
Quadrant B |
|---|---|---|---|
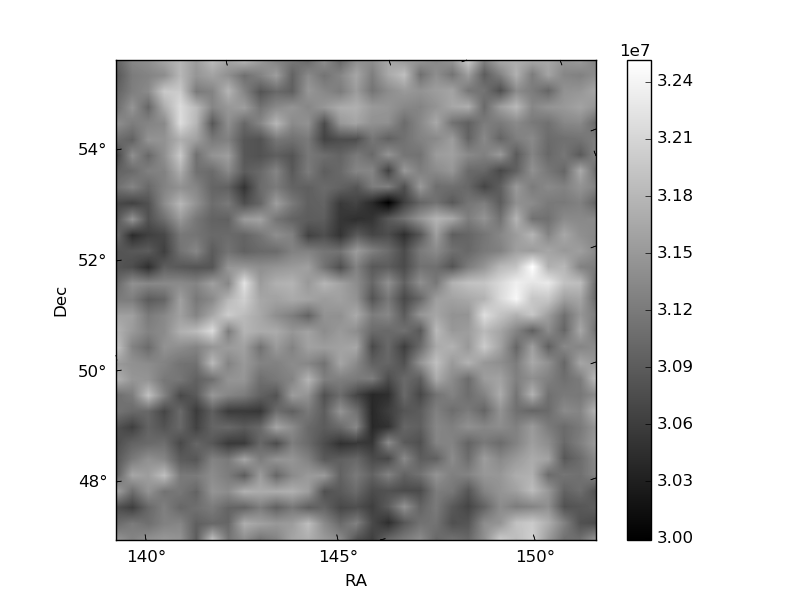
| Quadrant D | 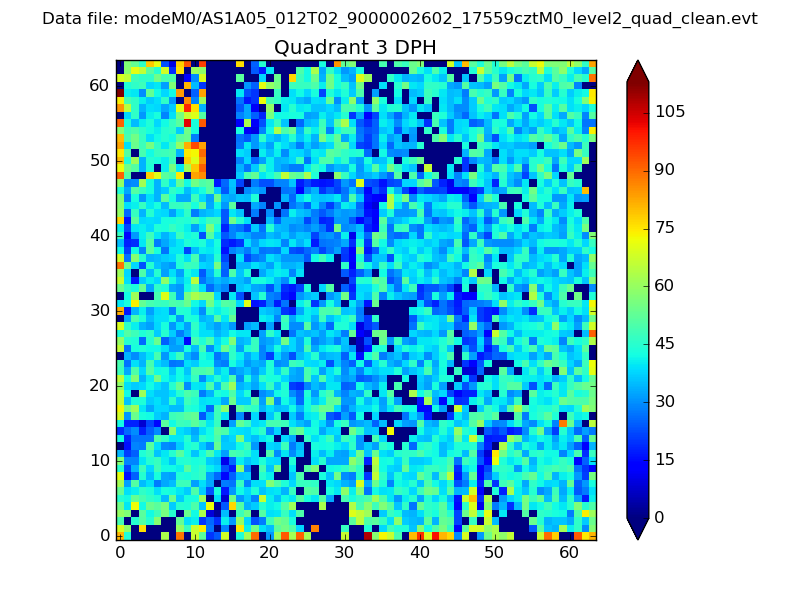 |
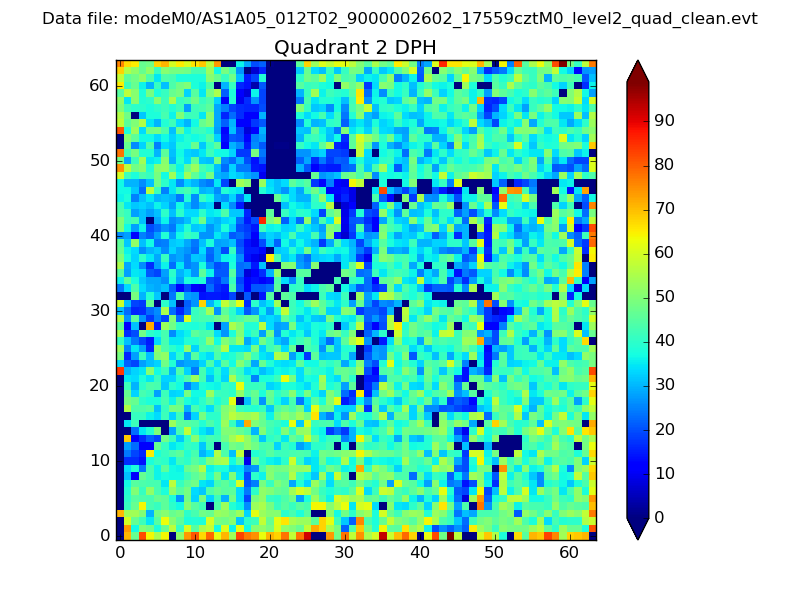 |
Quadrant C |
| Plot type | Count rate plots | Images |
|---|---|---|
| Comparison with Poisson distribution Blue bars denote a histogram of data divided into 1 sec bins. Red curve is a Poisson curve with rate = median count rate of data. |
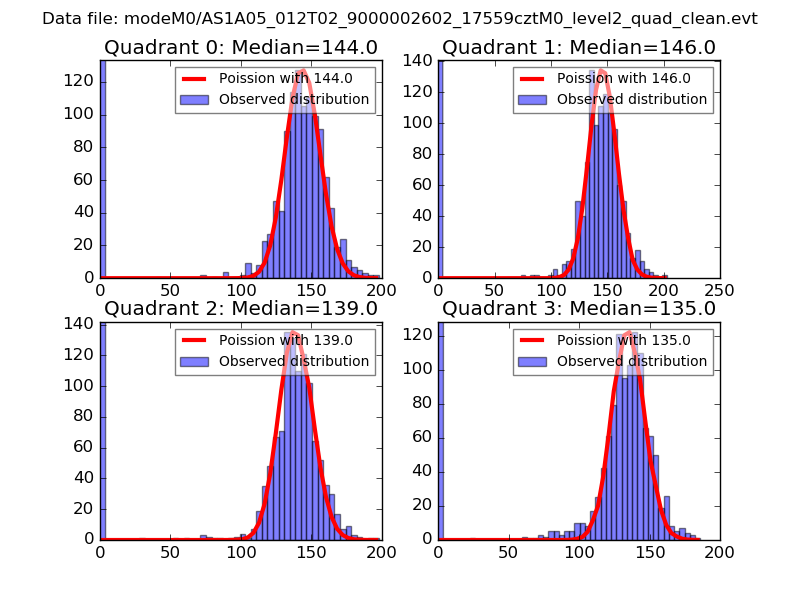 |
 |
| Quadrant-wise count rates Data is divided into 100 sec bins |
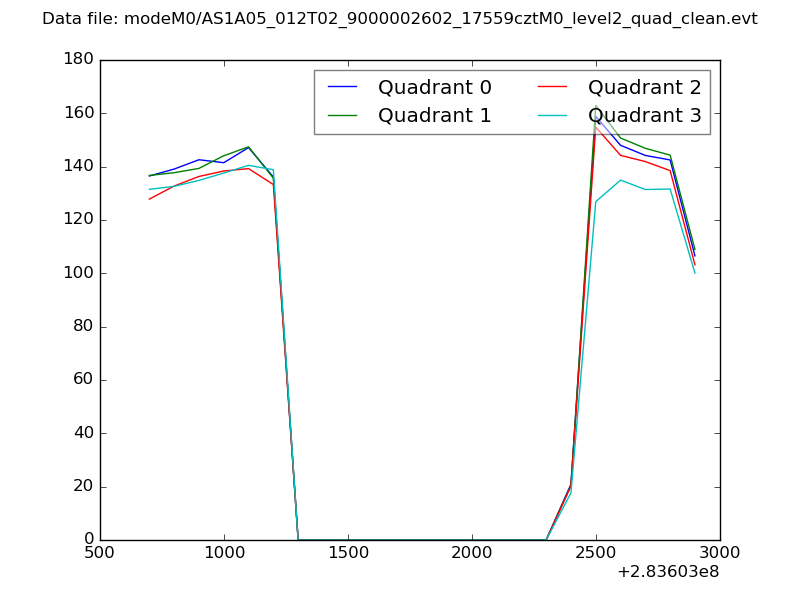 |
|
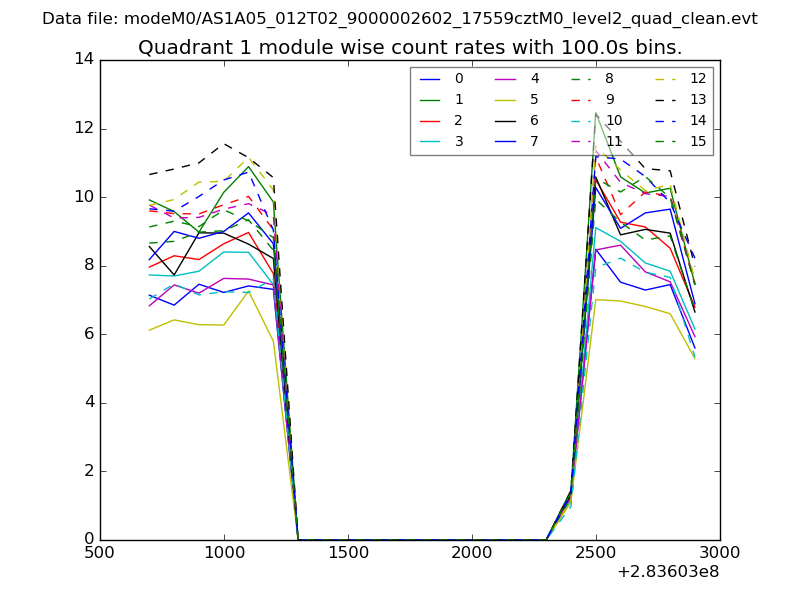
| Module-wise count rates for Quadrant A Data is divided into 100 sec bins |
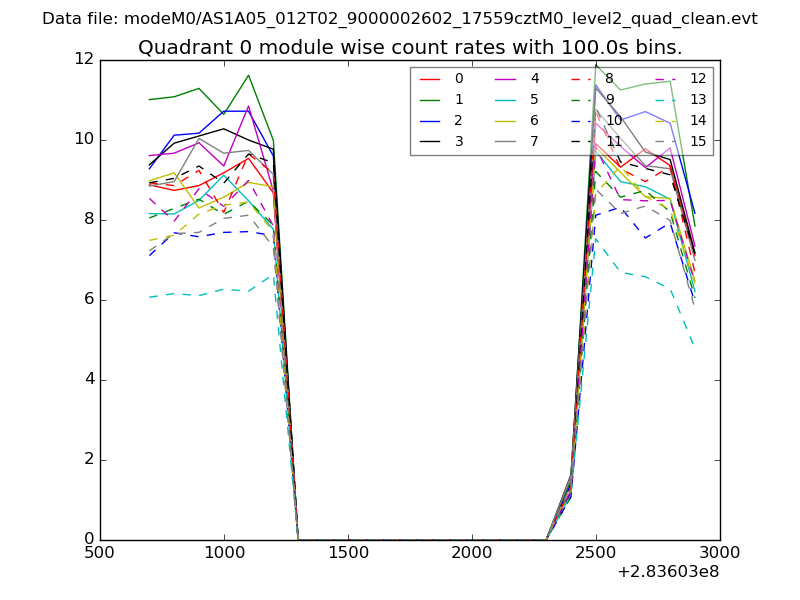 |
 |
| Module-wise count rates for Quadrant B Data is divided into 100 sec bins |
 |
 |
| Module-wise count rates for Quadrant C Data is divided into 100 sec bins |
 |
 |
| Module-wise count rates for Quadrant D Data is divided into 100 sec bins |
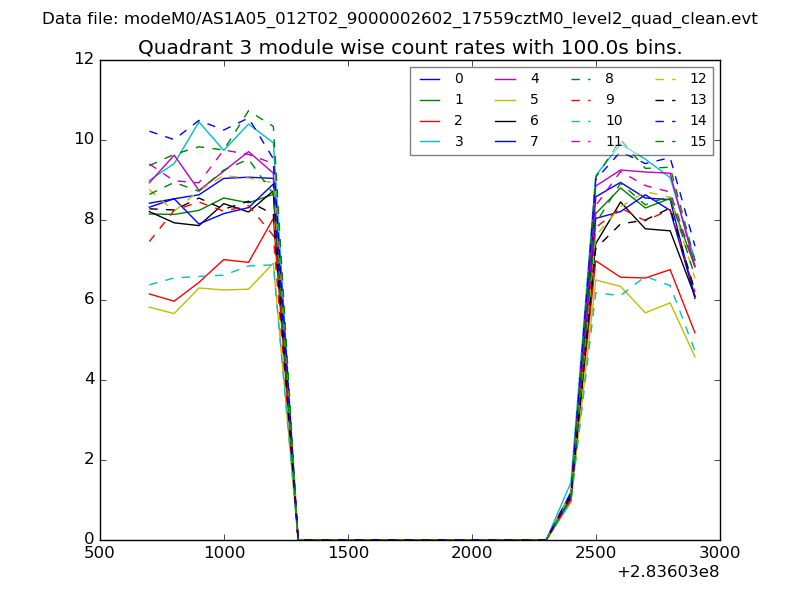 |
 |
| Parameter | Plot |
|---|---|
| CZT HV Monitor | 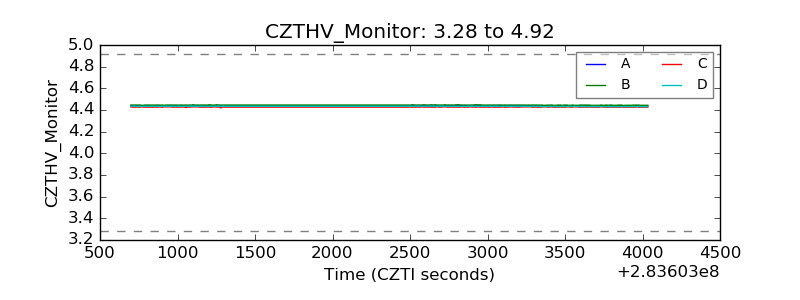 |
| D_VDD | 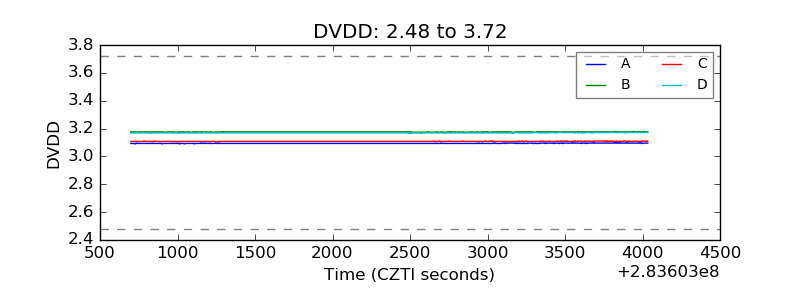 |
| Temperature 1 | 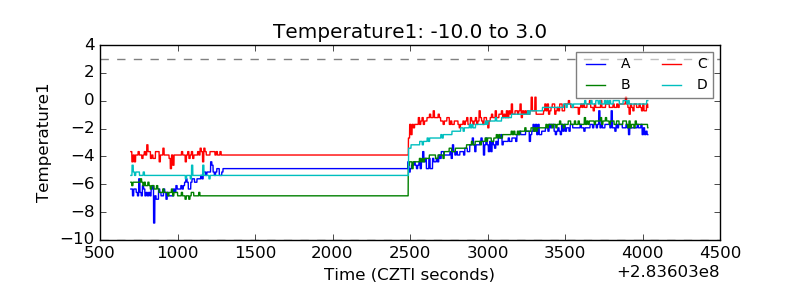 |
| Veto HV Monitor | 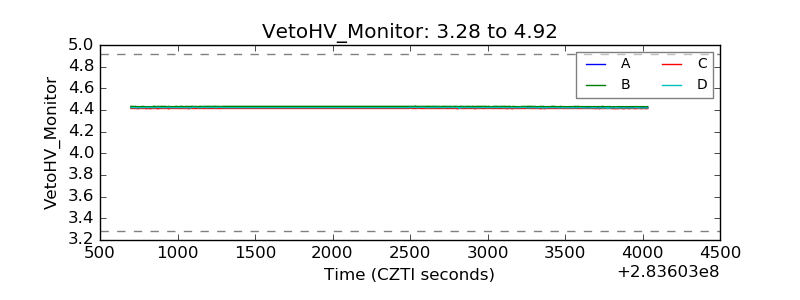 |
| Veto LLD |  |
| Alpha Counter | 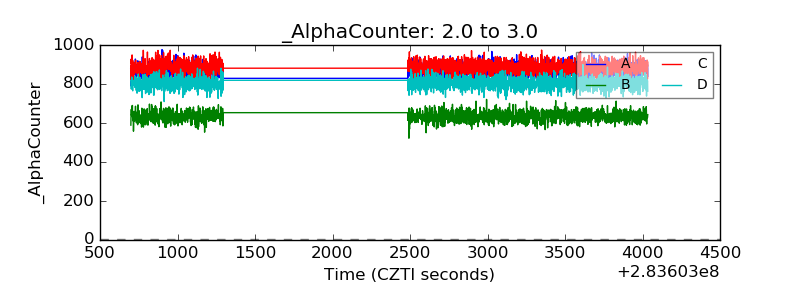 |
| _CPM_Rate | 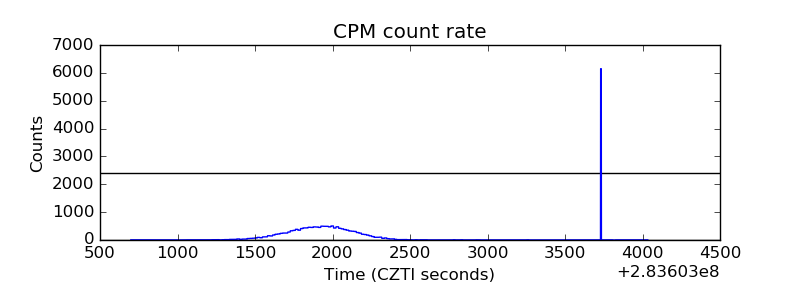 |
| CZT Counter | 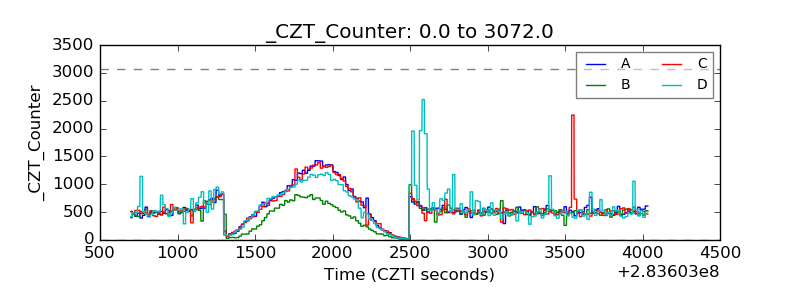 |
| +2.5 Volts monitor |  |
| +5 Volts monitor |  |
| _ROLL_ROT | 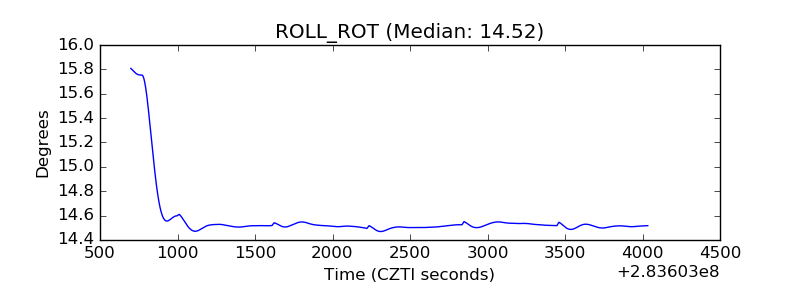 |
| _Roll_DEC | 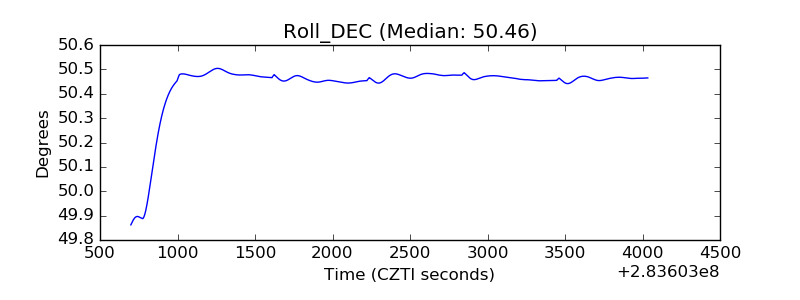 |
| _Roll_RA | 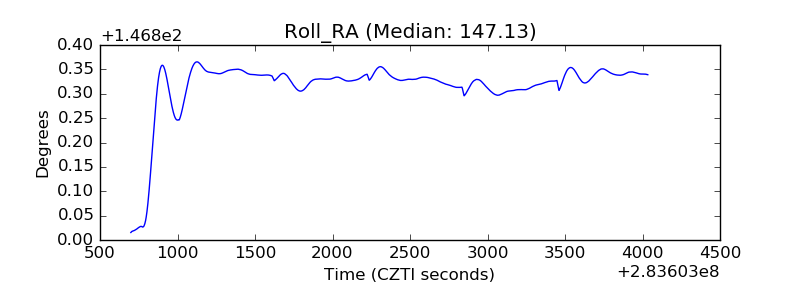 |
| Veto Counter | 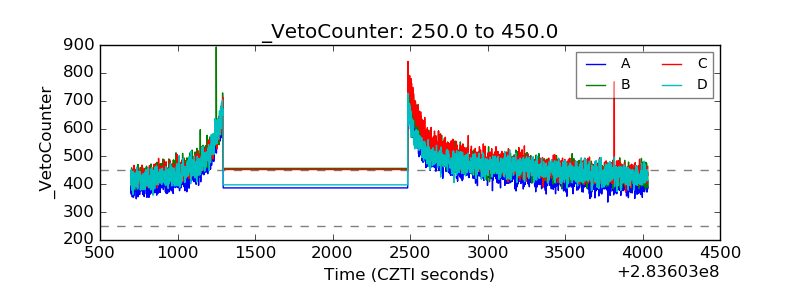 |