| Param | Original file | Final file |
|---|---|---|
| Filename | modeM0/AS1A05_012T02_9000002602_17560cztM0_level2.evt | modeM0/AS1A05_012T02_9000002602_17560cztM0_level2_quad_clean.evt |
| Size (bytes) | 588,504,960 | 79,179,840 |
| Size | 561.2 MB | 75.5 MB |
| Events in quadrant A | 6,540,200 | 454,038 |
| Events in quadrant B | 3,468,186 | 501,077 |
| Events in quadrant C | 3,518,020 | 480,922 |
| Events in quadrant D | 3,824,709 | 476,494 |
| Mode M0 | |||
|---|---|---|---|
| Quadrant | BADHDUFLAG | Total packets | Discarded packets |
| A | 0 | 24079 | 2 |
| B | 0 | 14675 | 2 |
| C | 0 | 14567 | 2 |
| D | 0 | 15978 | 2 |
| Mode M9 | |||
|---|---|---|---|
| Quadrant | BADHDUFLAG | Total packets | Discarded packets |
| A | 0 | 9 | 0 |
| B | 0 | 9 | 0 |
| C | 0 | 9 | 0 |
| D | 0 | 9 | 0 |
| Mode SS | |||
|---|---|---|---|
| Quadrant | BADHDUFLAG | Total packets | Discarded packets |
| A | 0 | 140 | 0 |
| B | 0 | 140 | 0 |
| C | 0 | 140 | 0 |
| D | 0 | 140 | 0 |
| Quadrant | Total seconds | Saturated seconds | Saturation percentage |
|---|---|---|---|
| A | 6961 | 1191 | 17.109611% |
| B | 6962 | 123 | 1.766734% |
| C | 6962 | 152 | 2.183281% |
| D | 6962 | 208 | 2.987647% |
Noise dominated data is calculated using 1-second bins in cleaned event files. If a bin has >2000 counts, and if more than 50% of those come from <1% of pixels, then it is considered to be noise-dominated and hence unusable.
| Quadrant | # 1 sec bins | Bins with >0 counts | Bins with >2000 counts | High rate bins dominated by noise | Noise dominated (total time) | Noise dominated (detector-on time) | Marked lightcurve |
|---|---|---|---|---|---|---|---|
| A | 7796 | 6961 | 867 | 867 | 11.12% | 12.46% | 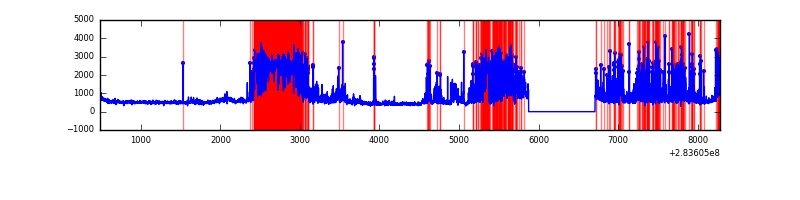 |
| B | 7797 | 6962 | 0 | 0 | 0.00% | 0.00% | 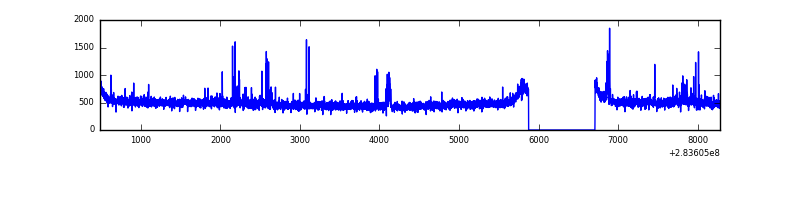 |
| C | 7797 | 6962 | 9 | 9 | 0.12% | 0.13% | 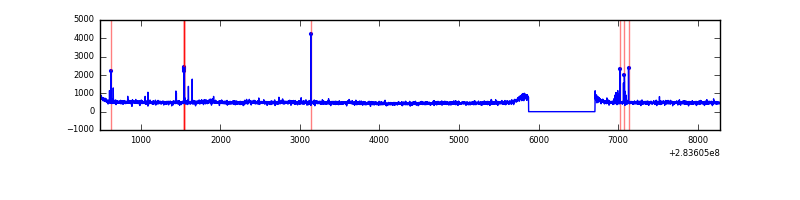 |
| D | 7797 | 6962 | 85 | 85 | 1.09% | 1.22% |  |
Top three noisy pixels from each quadrant. If the there are fewer than three noisy pixels in the level2.evt file, extra rows are filled as -1
| Pixel properties | Quadrant properties | ||||||
|---|---|---|---|---|---|---|---|
| Quadrant | DetID | PixID | Counts | Sigma | Mean | Median | Sigma |
| A | 14 | 237 | 3408184 | 21567.52 | 794 | 776 | 158.0 |
| A | 15 | 174 | 39373 | 244.3 | 794 | 776 | 158.0 |
| A | 11 | 47 | 31403 | 193.86 | 794 | 776 | 158.0 |
| B | 7 | 220 | 29718 | 178.32 | 851 | 831 | 162.0 |
| B | 0 | 230 | 23199 | 138.07 | 851 | 831 | 162.0 |
| B | 0 | 189 | 22968 | 136.65 | 851 | 831 | 162.0 |
| C | 3 | 233 | 143145 | 749.68 | 816 | 819 | 189.8 |
| C | 14 | 238 | 126562 | 662.33 | 816 | 819 | 189.8 |
| C | 0 | 207 | 40976 | 211.52 | 816 | 819 | 189.8 |
| D | 13 | 189 | 257867 | 1281.59 | 831 | 806 | 200.6 |
| D | 7 | 238 | 140776 | 697.83 | 831 | 806 | 200.6 |
| D | 5 | 222 | 83387 | 411.71 | 831 | 806 | 200.6 |
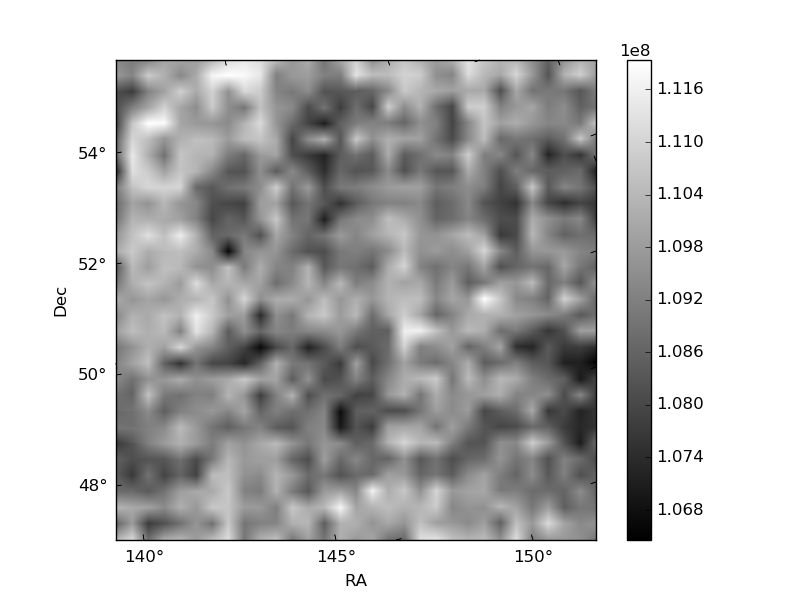
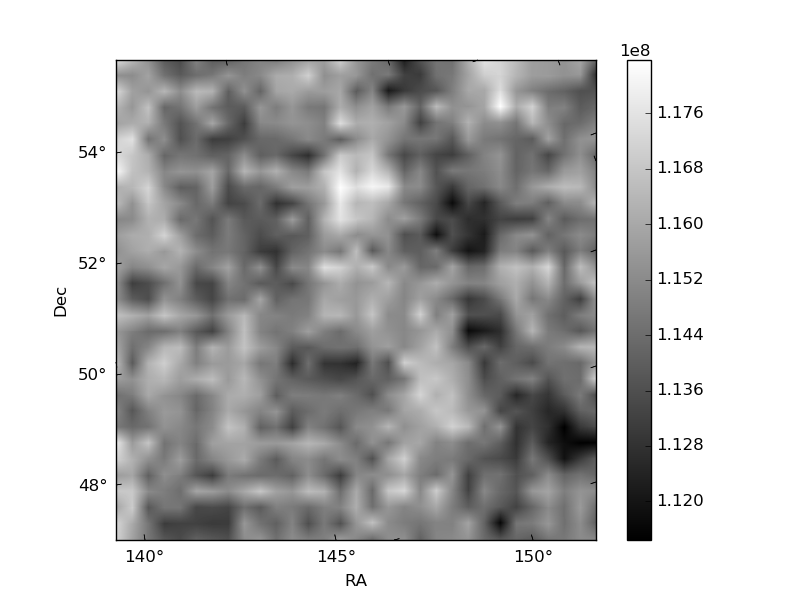
Histogram calculated using DETX and DETY for each event in the final _common_clean file
| Quadrant A |  |
 |
Quadrant B |
|---|---|---|---|
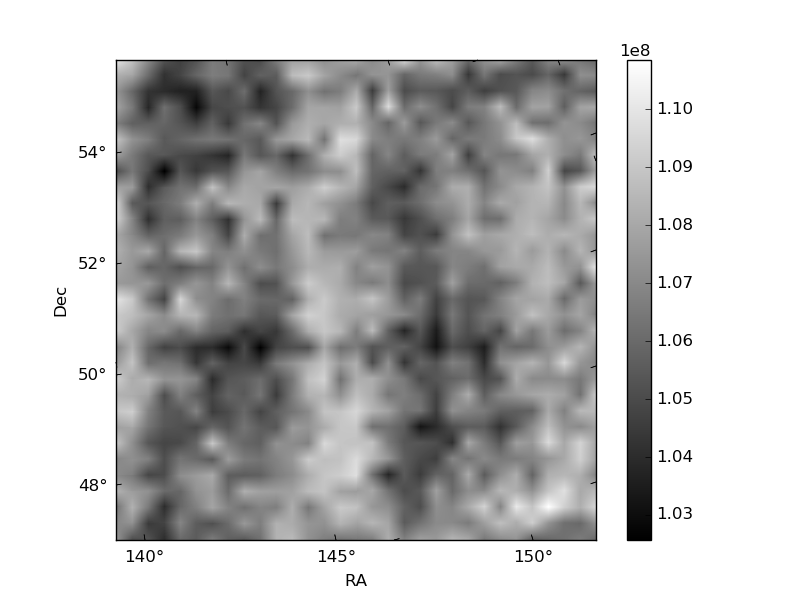
| Quadrant D | 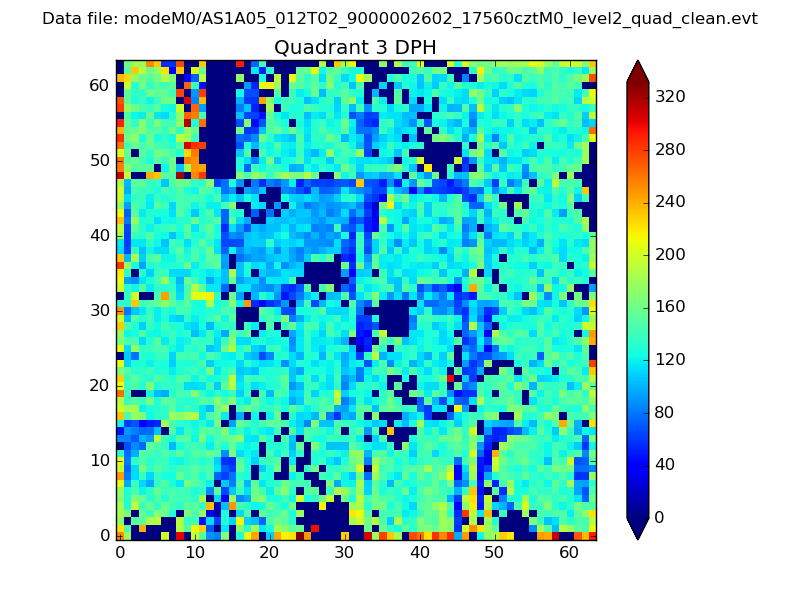 |
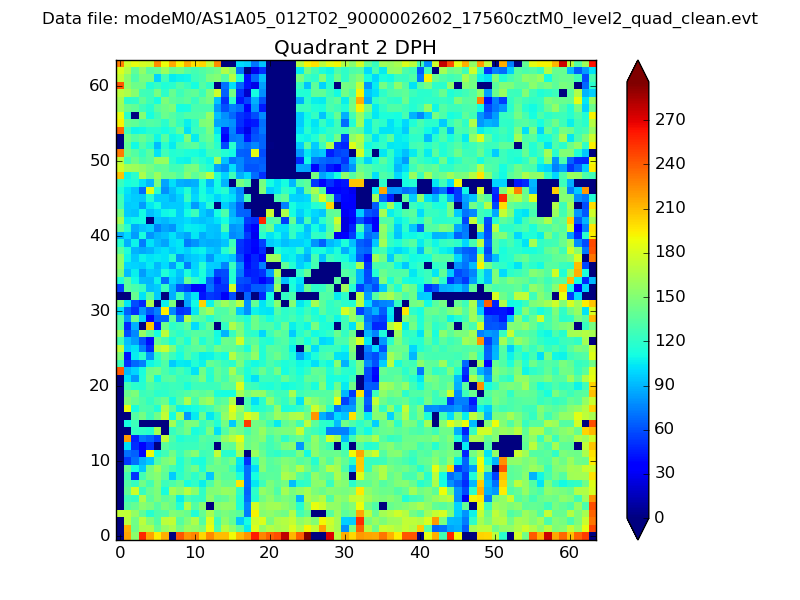 |
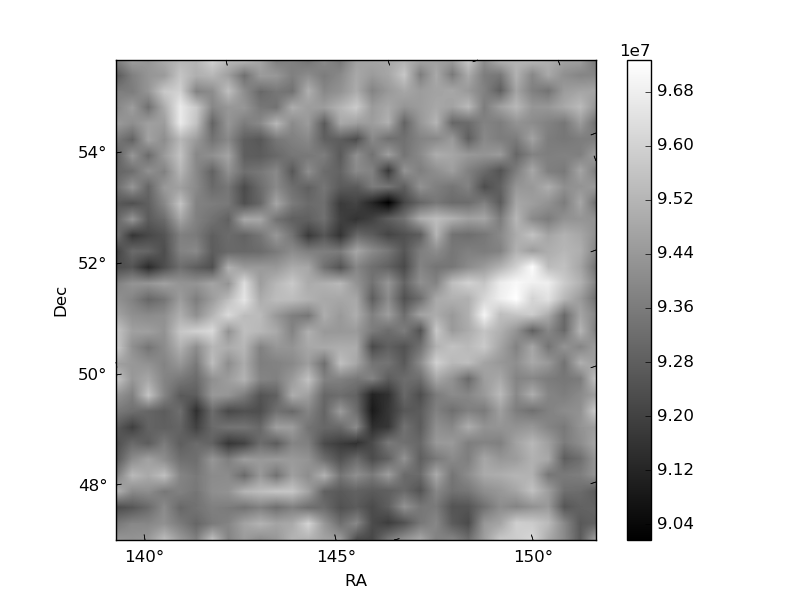
Quadrant C |
| Plot type | Count rate plots | Images |
|---|---|---|
| Comparison with Poisson distribution Blue bars denote a histogram of data divided into 1 sec bins. Red curve is a Poisson curve with rate = median count rate of data. |
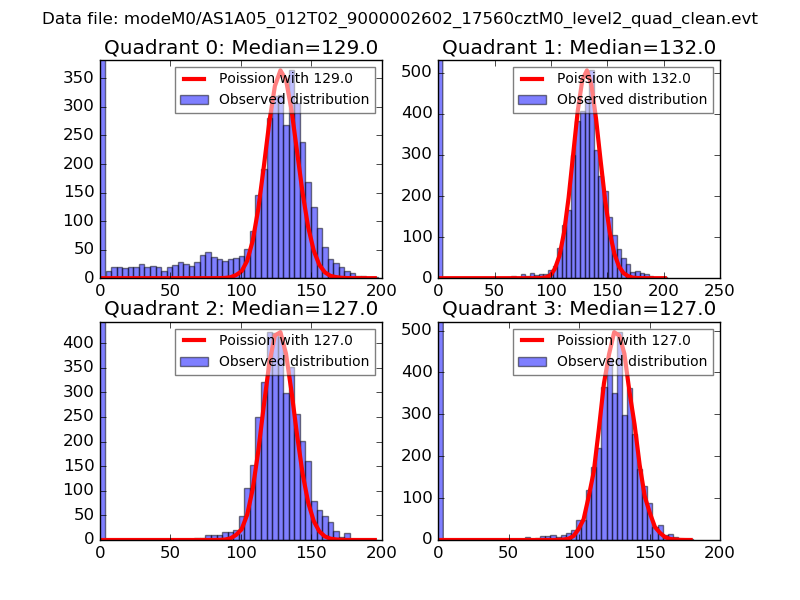 |
 |
| Quadrant-wise count rates Data is divided into 100 sec bins |
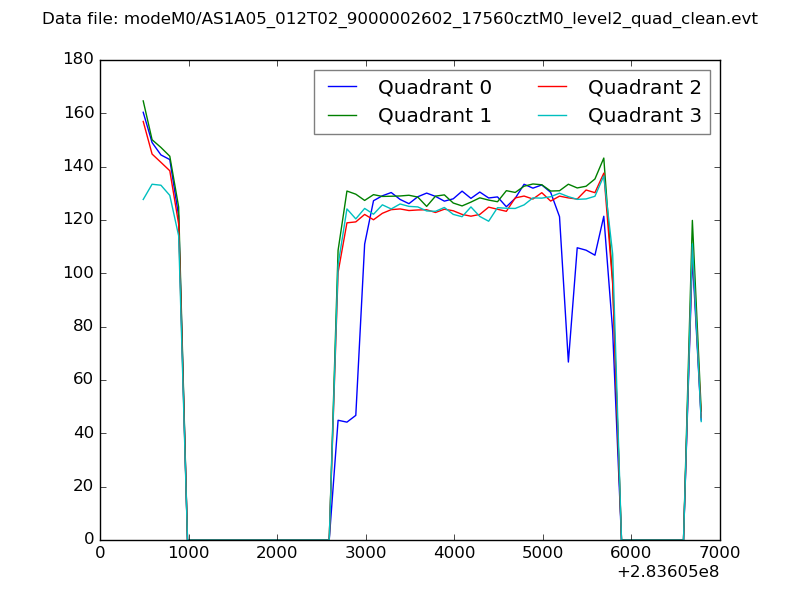 |
|
| Module-wise count rates for Quadrant A Data is divided into 100 sec bins |
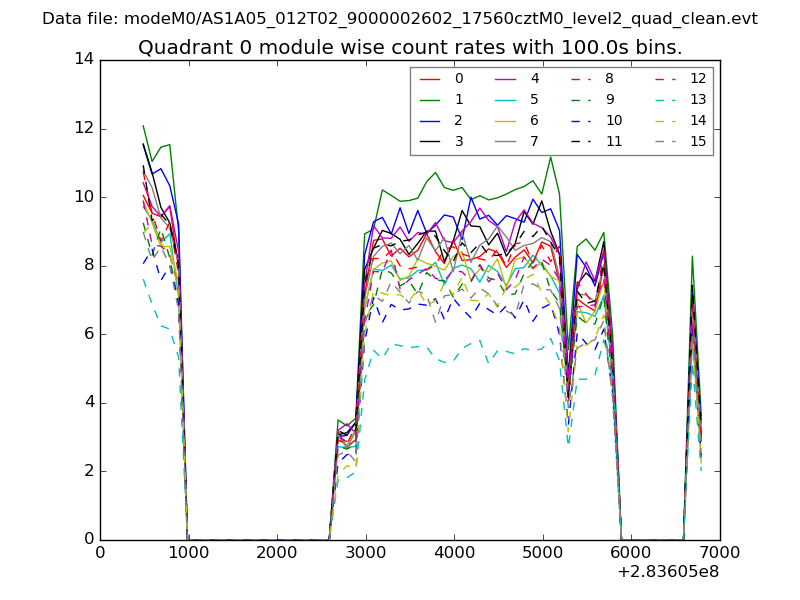 |
 |
| Module-wise count rates for Quadrant B Data is divided into 100 sec bins |
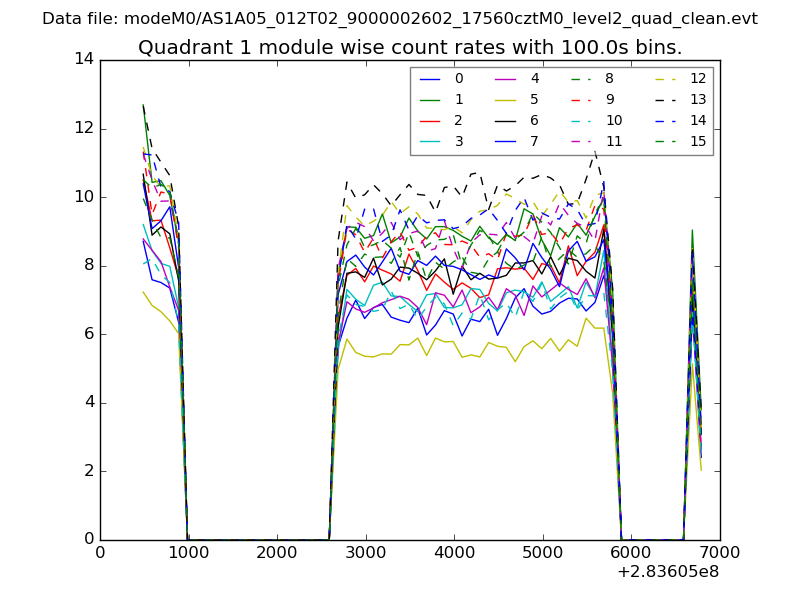 |
 |
| Module-wise count rates for Quadrant C Data is divided into 100 sec bins |
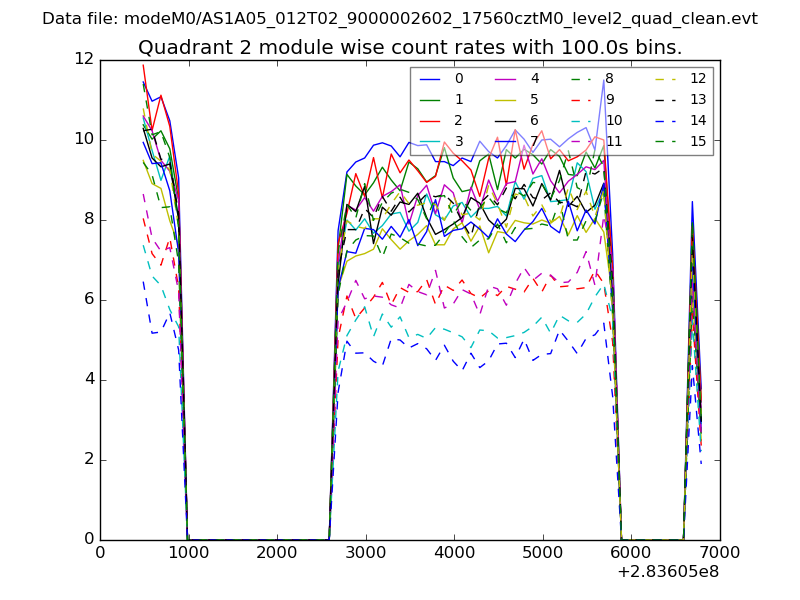 |
 |
| Module-wise count rates for Quadrant D Data is divided into 100 sec bins |
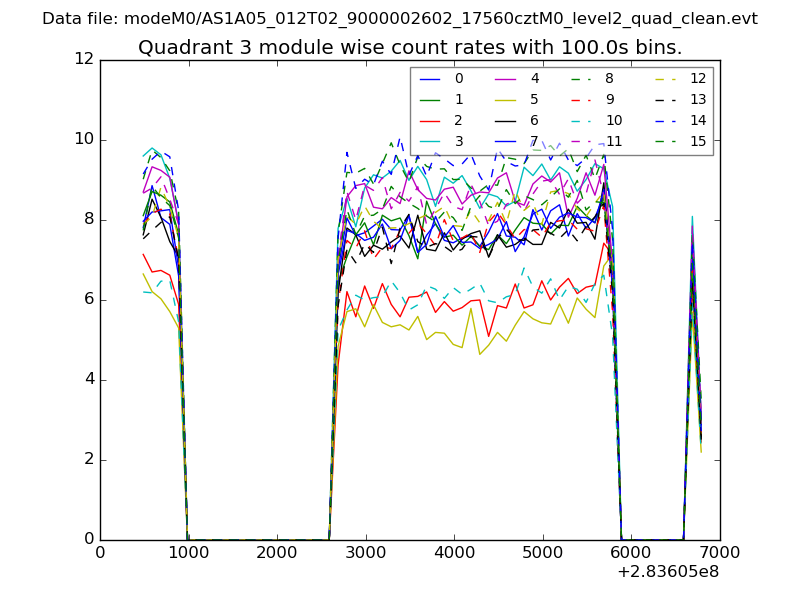 |
 |
| Parameter | Plot |
|---|---|
| CZT HV Monitor | 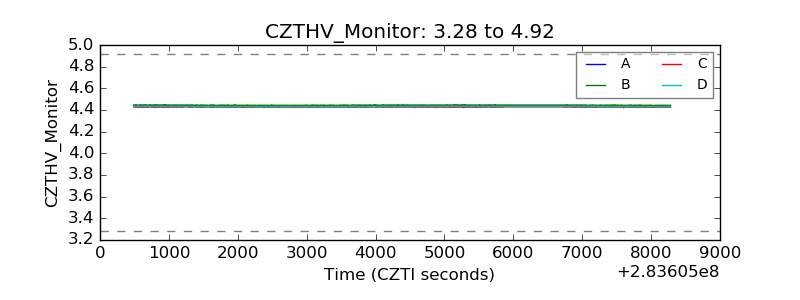 |
| D_VDD | 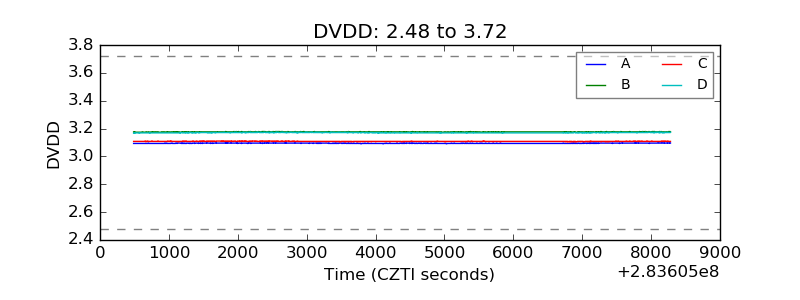 |
| Temperature 1 | 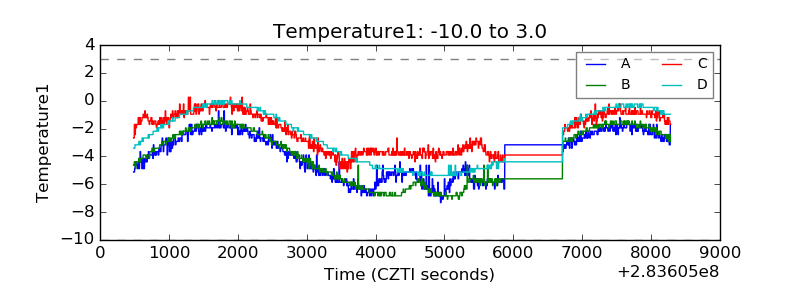 |
| Veto HV Monitor | 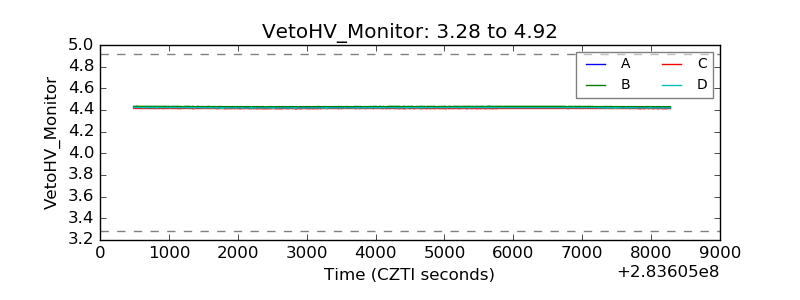 |
| Veto LLD | 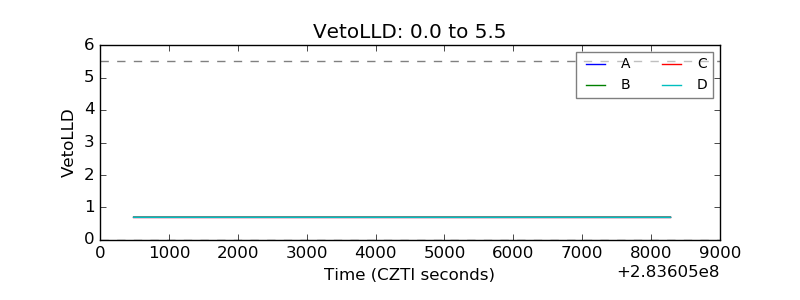 |
| Alpha Counter | 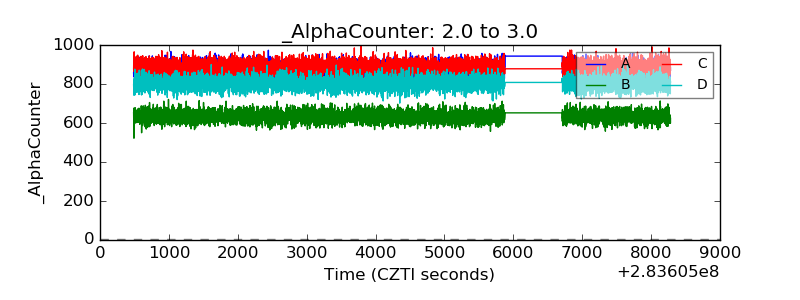 |
| _CPM_Rate | 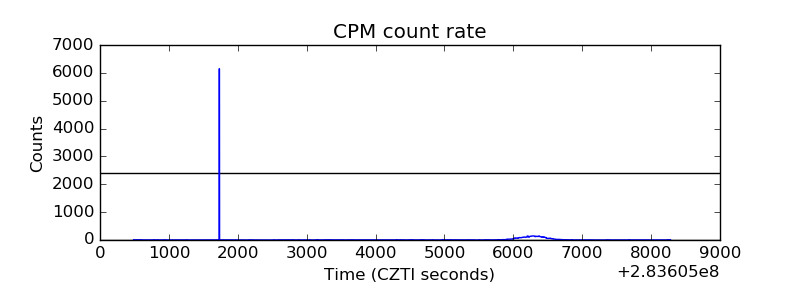 |
| CZT Counter | 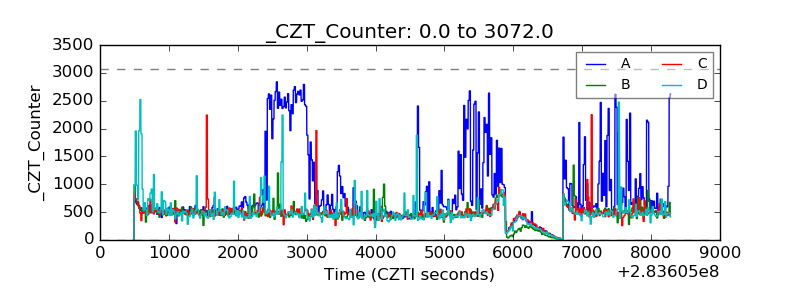 |
| +2.5 Volts monitor |  |
| +5 Volts monitor | 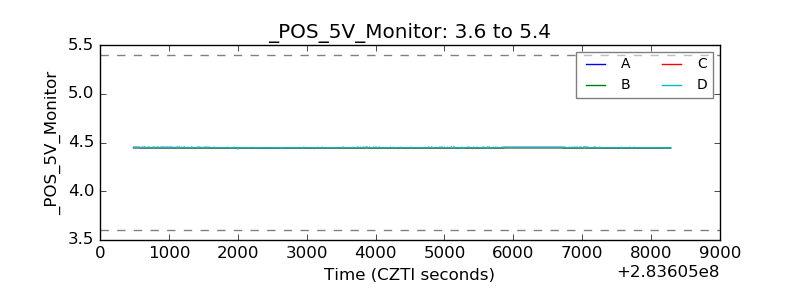 |
| _ROLL_ROT | 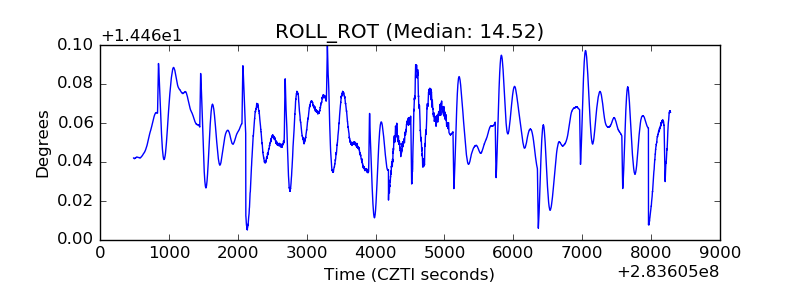 |
| _Roll_DEC | 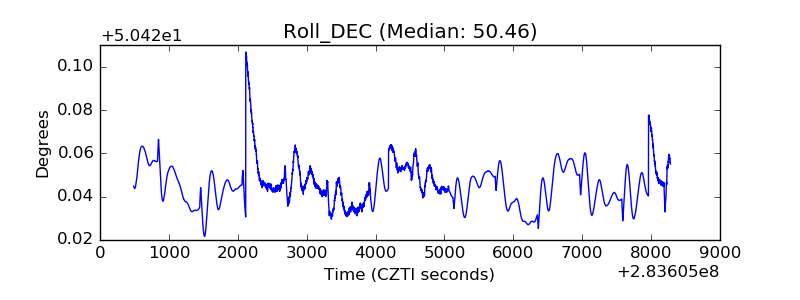 |
| _Roll_RA | 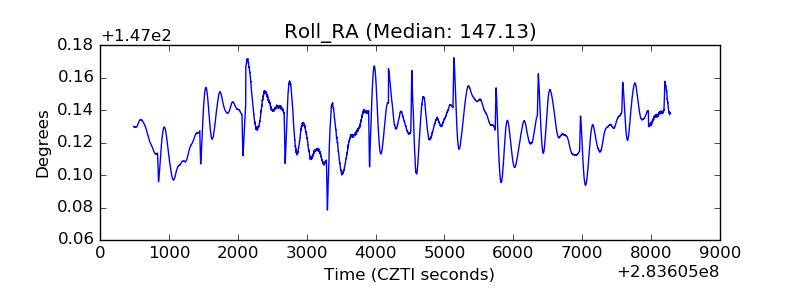 |
| Veto Counter | 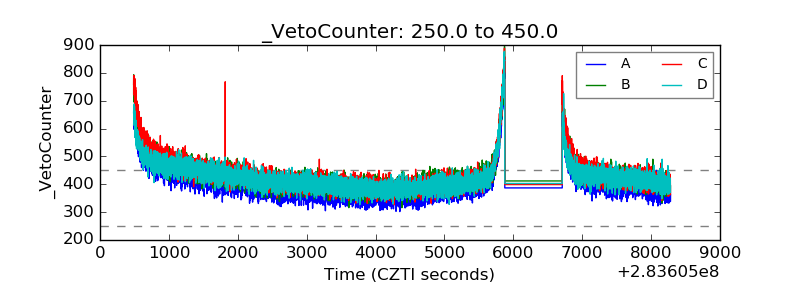 |