| Param | Original file | Final file |
|---|---|---|
| Filename | modeM0/AS1A05_012T02_9000002602_17562cztM0_level2.evt | modeM0/AS1A05_012T02_9000002602_17562cztM0_level2_quad_clean.evt |
| Size (bytes) | 667,172,160 | 91,909,440 |
| Size | 636.3 MB | 87.7 MB |
| Events in quadrant A | 7,813,592 | 527,980 |
| Events in quadrant B | 3,932,266 | 588,612 |
| Events in quadrant C | 3,987,742 | 564,557 |
| Events in quadrant D | 3,948,647 | 564,823 |
| Mode M0 | |||
|---|---|---|---|
| Quadrant | BADHDUFLAG | Total packets | Discarded packets |
| A | 0 | 28698 | 2 |
| B | 0 | 16818 | 2 |
| C | 0 | 16785 | 2 |
| D | 0 | 17081 | 2 |
| Mode M9 | |||
|---|---|---|---|
| Quadrant | BADHDUFLAG | Total packets | Discarded packets |
| A | 0 | 7 | 0 |
| B | 0 | 7 | 0 |
| C | 0 | 7 | 0 |
| D | 0 | 7 | 0 |
| Mode SS | |||
|---|---|---|---|
| Quadrant | BADHDUFLAG | Total packets | Discarded packets |
| A | 0 | 160 | 0 |
| B | 0 | 160 | 0 |
| C | 0 | 160 | 0 |
| D | 0 | 160 | 0 |
| Quadrant | Total seconds | Saturated seconds | Saturation percentage |
|---|---|---|---|
| A | 7715 | 1398 | 18.120544% |
| B | 7716 | 191 | 2.475376% |
| C | 7716 | 221 | 2.864178% |
| D | 7716 | 188 | 2.436496% |
Noise dominated data is calculated using 1-second bins in cleaned event files. If a bin has >2000 counts, and if more than 50% of those come from <1% of pixels, then it is considered to be noise-dominated and hence unusable.
| Quadrant | # 1 sec bins | Bins with >0 counts | Bins with >2000 counts | High rate bins dominated by noise | Noise dominated (total time) | Noise dominated (detector-on time) | Marked lightcurve |
|---|---|---|---|---|---|---|---|
| A | 8490 | 7717 | 942 | 942 | 11.10% | 12.21% | 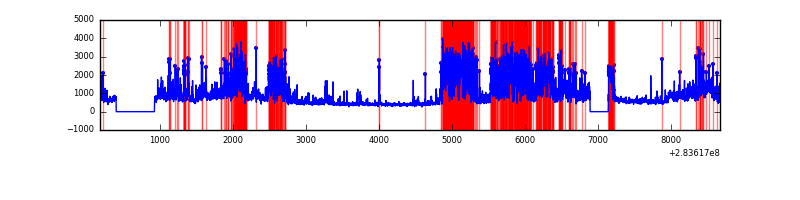 |
| B | 8491 | 7718 | 33 | 33 | 0.39% | 0.43% | 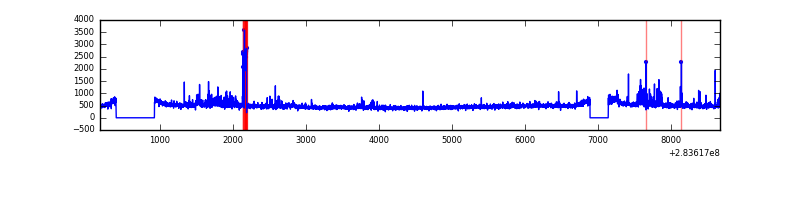 |
| C | 8491 | 7718 | 18 | 18 | 0.21% | 0.23% | 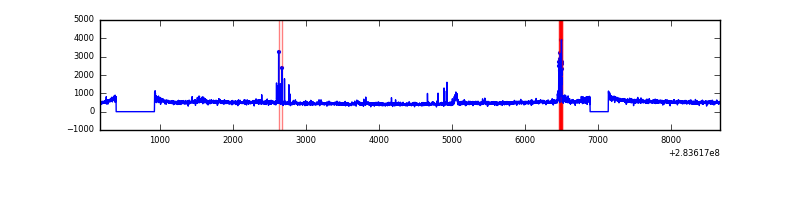 |
| D | 8491 | 7717 | 65 | 65 | 0.77% | 0.84% | 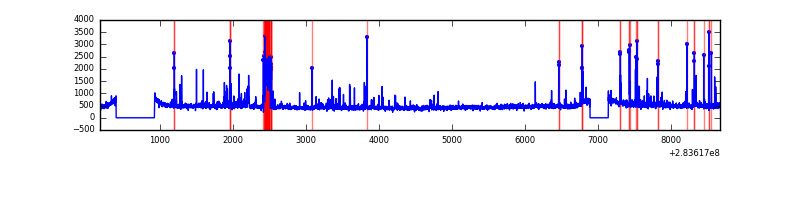 |
Top three noisy pixels from each quadrant. If the there are fewer than three noisy pixels in the level2.evt file, extra rows are filled as -1
| Pixel properties | Quadrant properties | ||||||
|---|---|---|---|---|---|---|---|
| Quadrant | DetID | PixID | Counts | Sigma | Mean | Median | Sigma |
| A | 14 | 237 | 4420987 | 25055.57 | 872 | 850 | 176.4 |
| A | 11 | 47 | 18691 | 101.13 | 872 | 850 | 176.4 |
| A | 15 | 174 | 16524 | 88.85 | 872 | 850 | 176.4 |
| B | 7 | 220 | 210873 | 1182.33 | 928 | 902 | 177.6 |
| B | 12 | 111 | 20497 | 110.34 | 928 | 902 | 177.6 |
| B | 0 | 198 | 18712 | 100.29 | 928 | 902 | 177.6 |
| C | 3 | 233 | 267972 | 1296.04 | 889 | 891 | 206.1 |
| C | 14 | 238 | 137707 | 663.91 | 889 | 891 | 206.1 |
| C | 0 | 207 | 107740 | 518.5 | 889 | 891 | 206.1 |
| D | 13 | 189 | 349253 | 1569.46 | 909 | 881 | 222.0 |
| D | 10 | 70 | 64679 | 287.42 | 909 | 881 | 222.0 |
| D | 2 | 234 | 37137 | 163.34 | 909 | 881 | 222.0 |
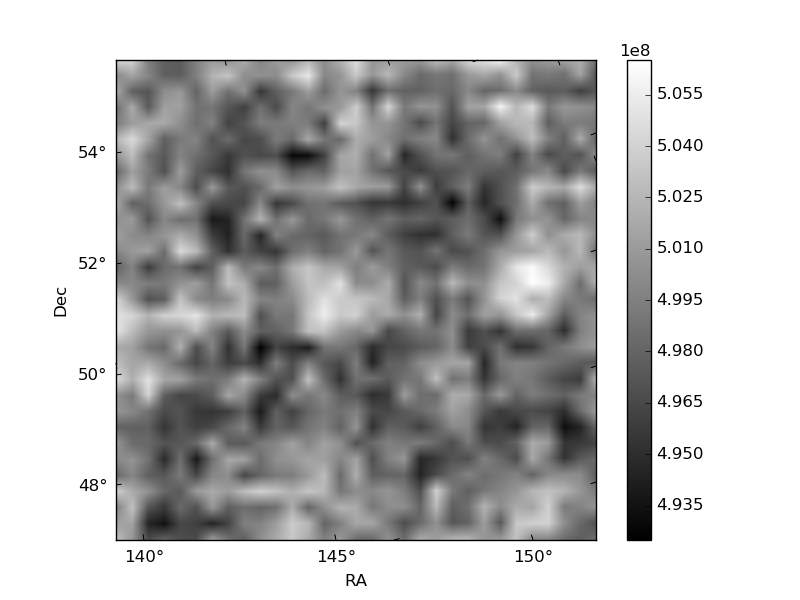
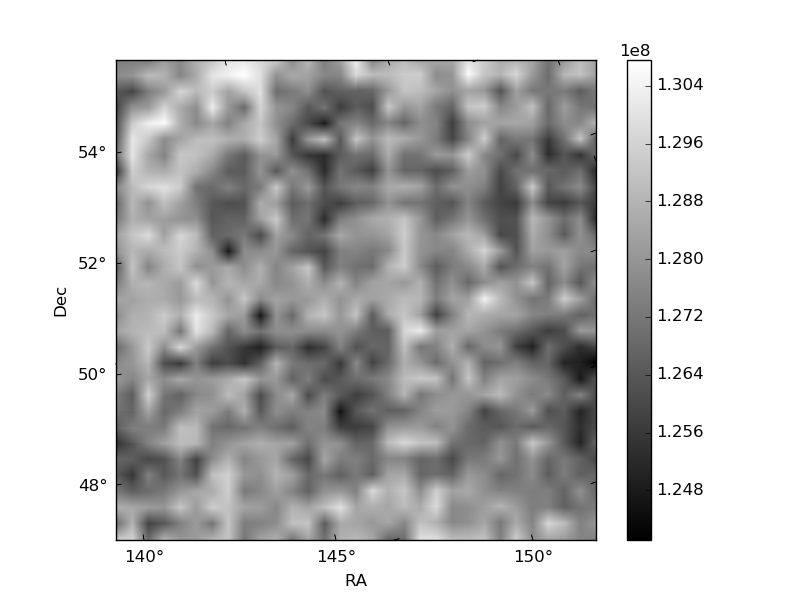
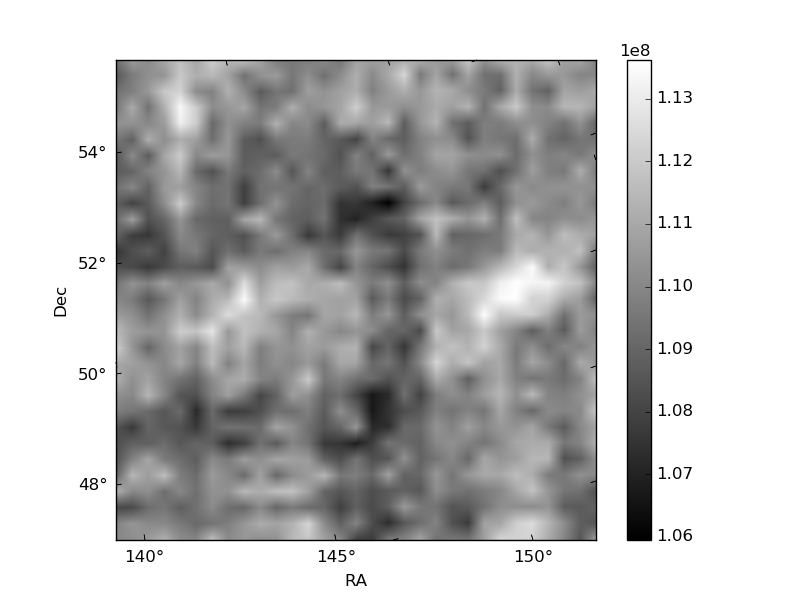
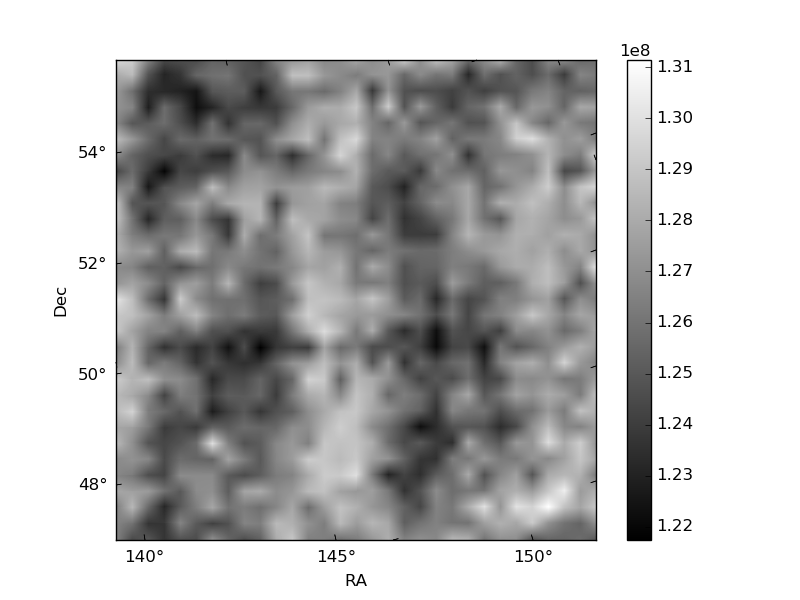
Histogram calculated using DETX and DETY for each event in the final _common_clean file
| Quadrant A | 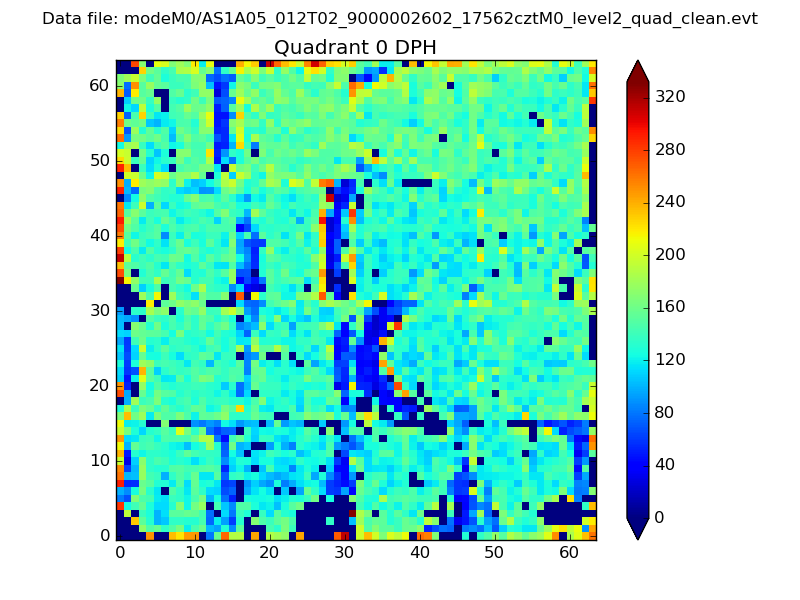 |
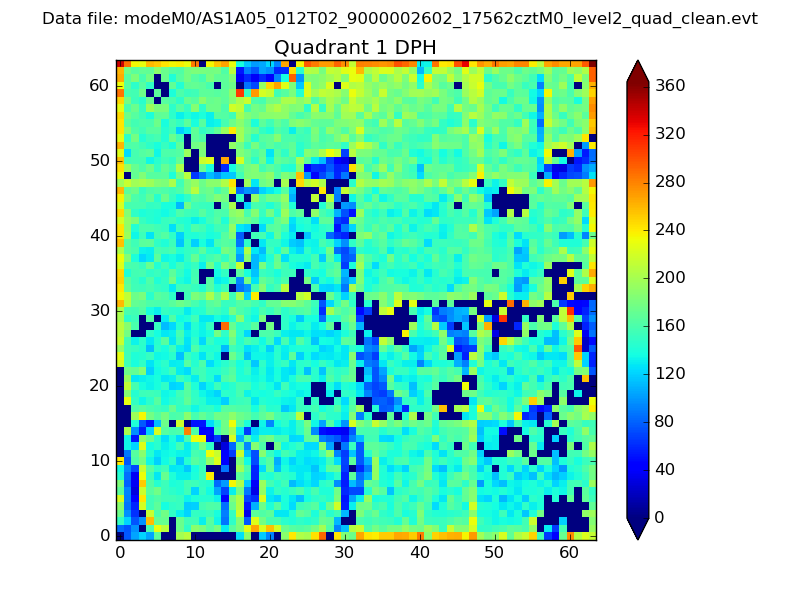 |
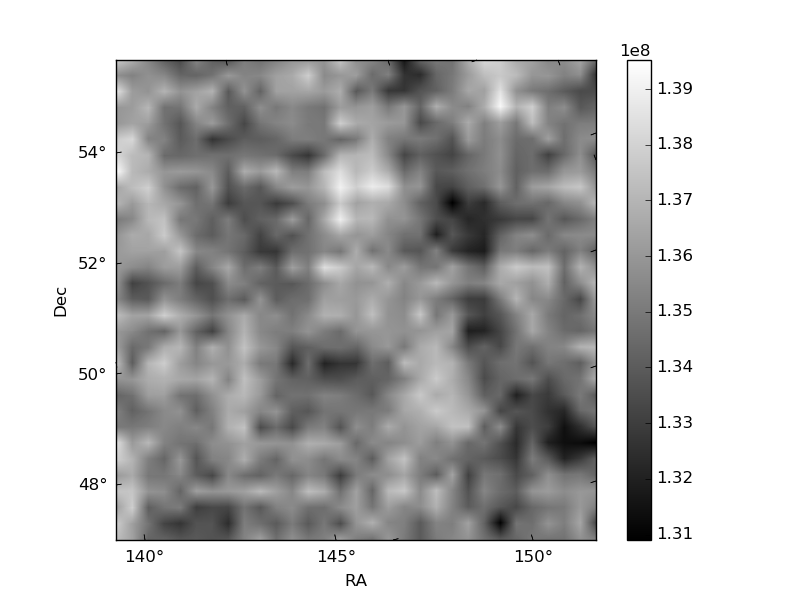
Quadrant B |
|---|---|---|---|
| Quadrant D | 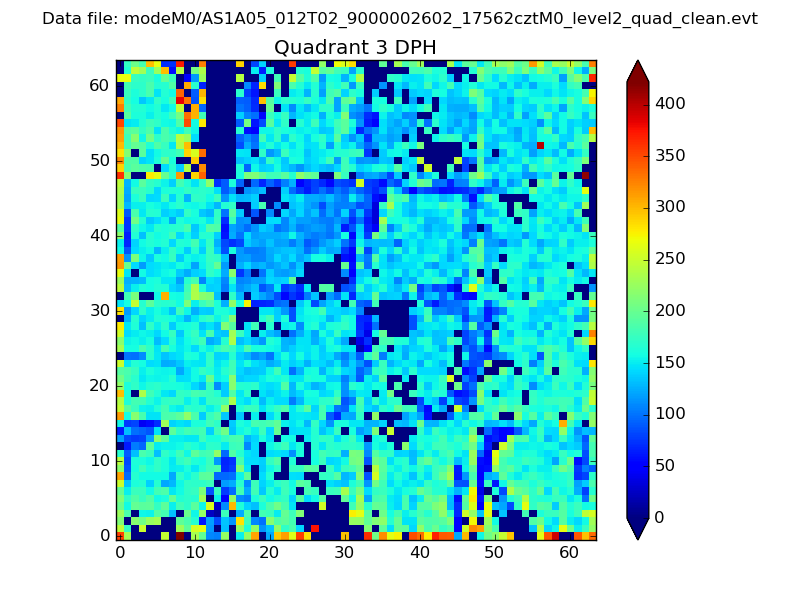 |
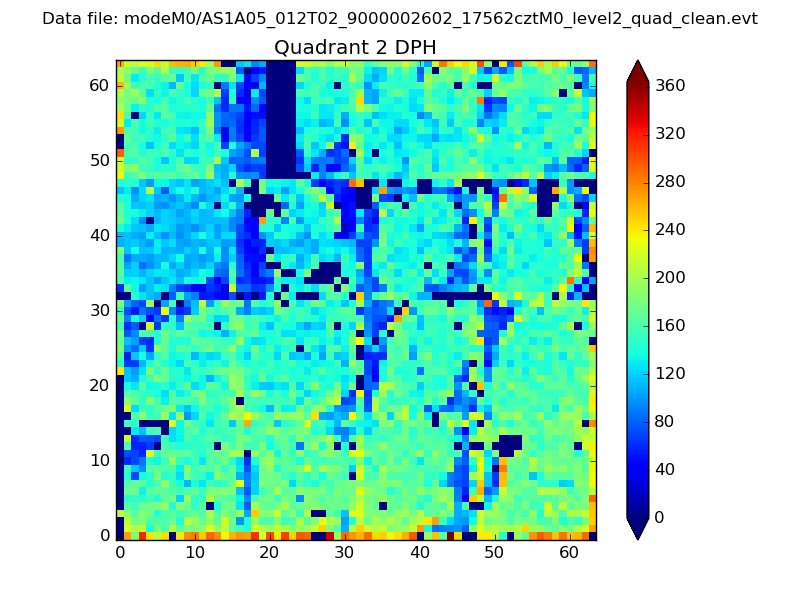 |
Quadrant C |
| Plot type | Count rate plots | Images |
|---|---|---|
| Comparison with Poisson distribution Blue bars denote a histogram of data divided into 1 sec bins. Red curve is a Poisson curve with rate = median count rate of data. |
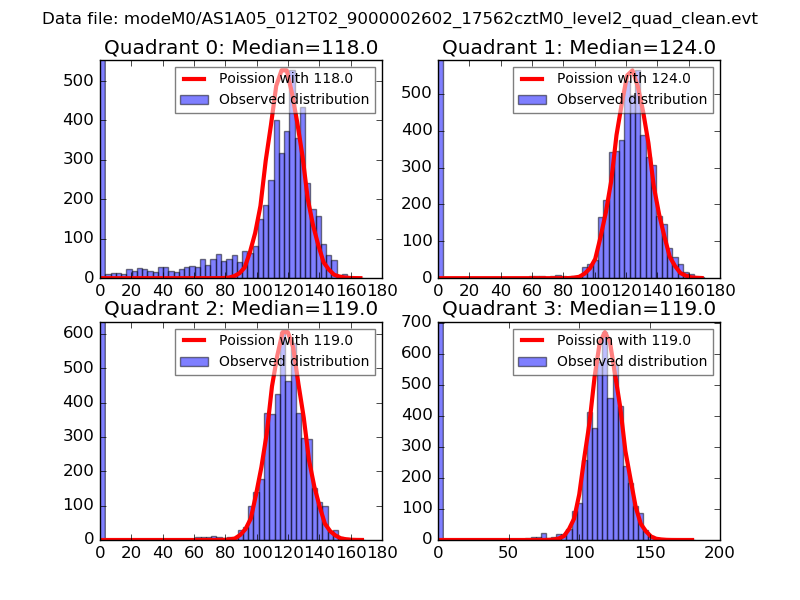 |
 |
| Quadrant-wise count rates Data is divided into 100 sec bins |
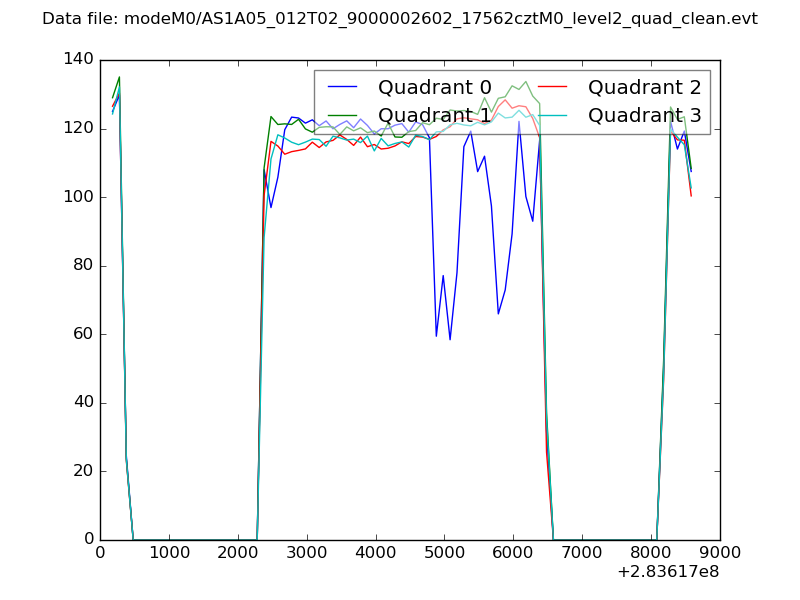 |
|
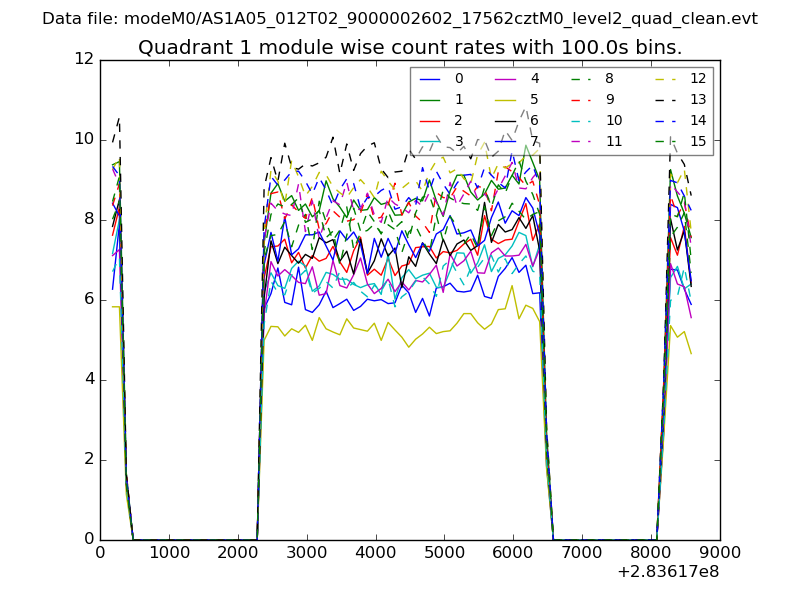
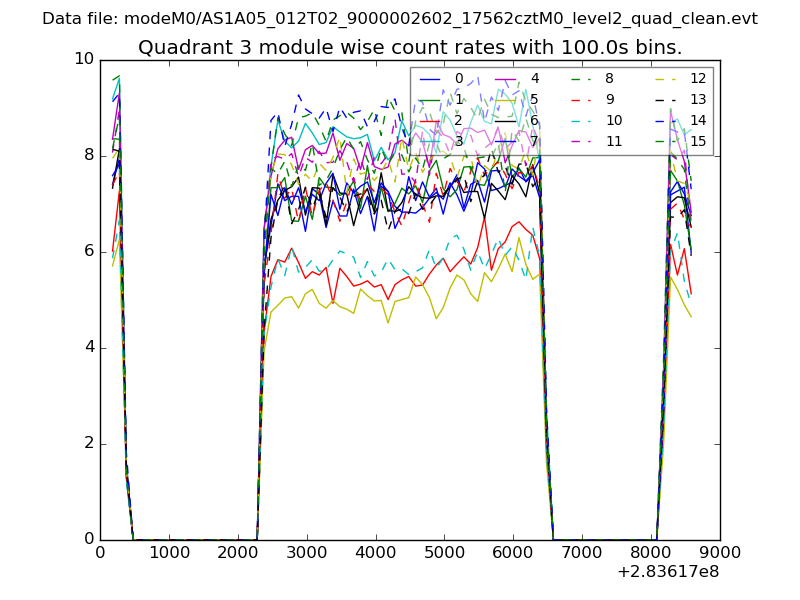
| Module-wise count rates for Quadrant A Data is divided into 100 sec bins |
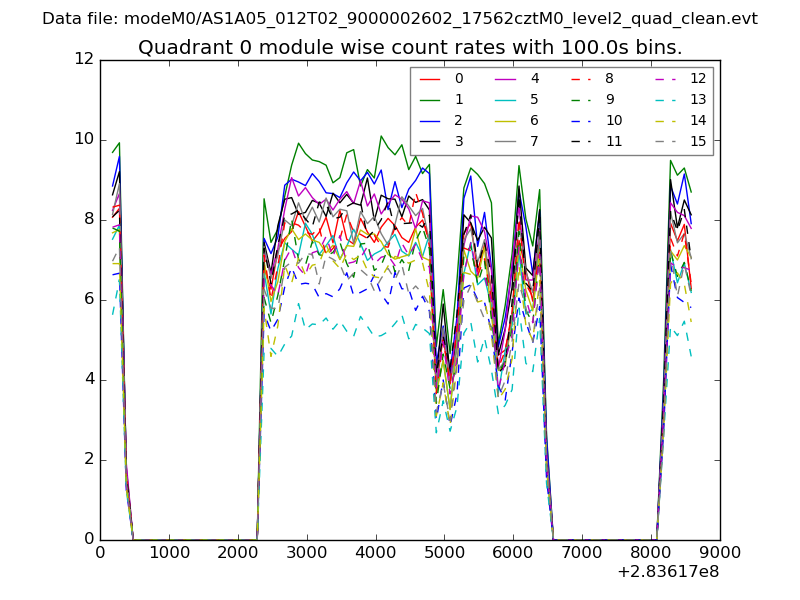 |
 |
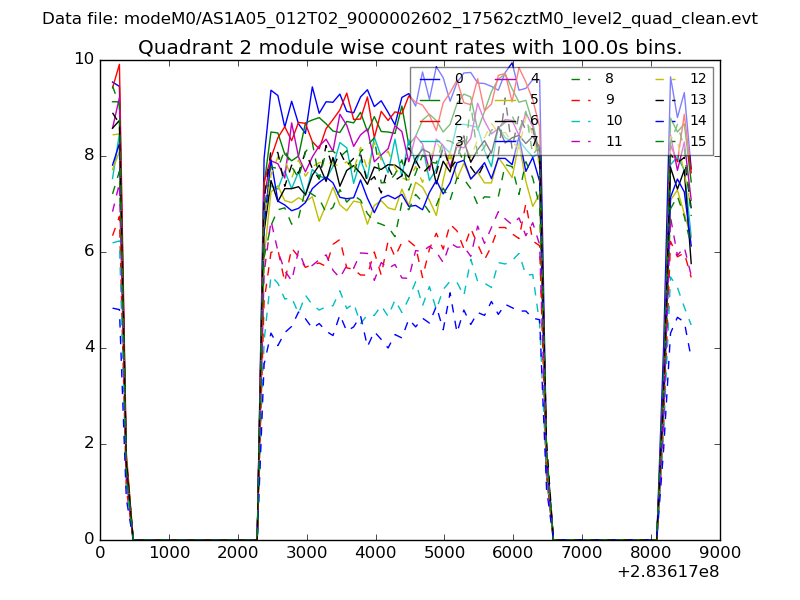
| Module-wise count rates for Quadrant B Data is divided into 100 sec bins |
 |
 |
| Module-wise count rates for Quadrant C Data is divided into 100 sec bins |
 |
 |
| Module-wise count rates for Quadrant D Data is divided into 100 sec bins |
 |
 |
| Parameter | Plot |
|---|---|
| CZT HV Monitor | 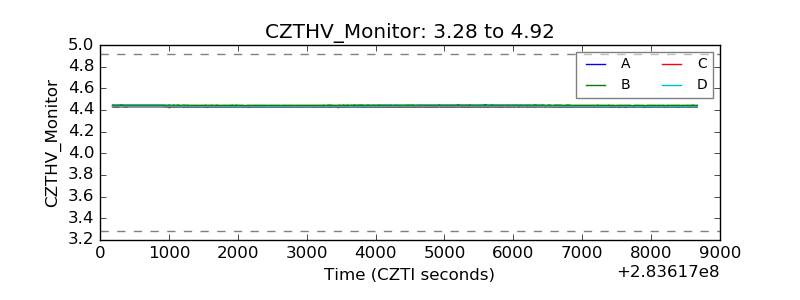 |
| D_VDD | 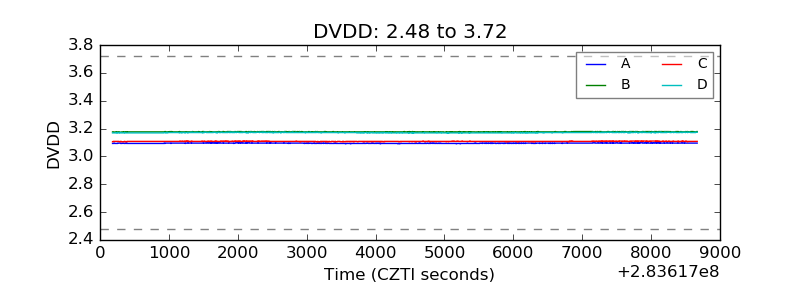 |
| Temperature 1 | 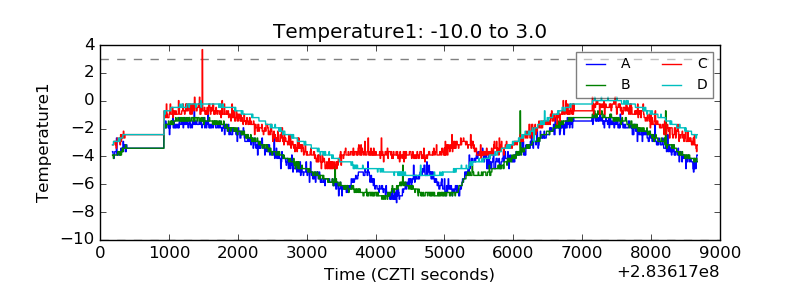 |
| Veto HV Monitor | 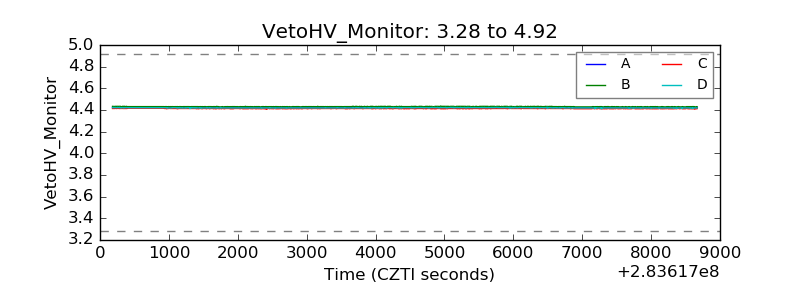 |
| Veto LLD |  |
| Alpha Counter | 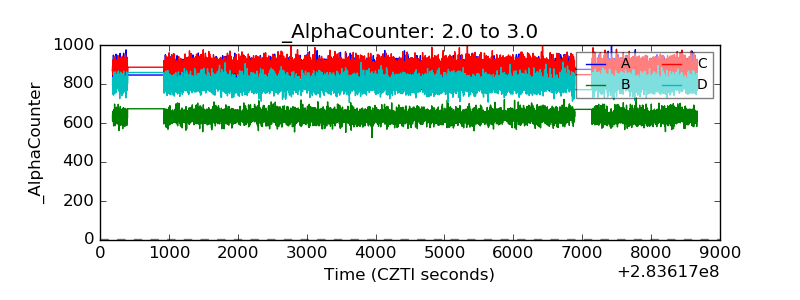 |
| _CPM_Rate | 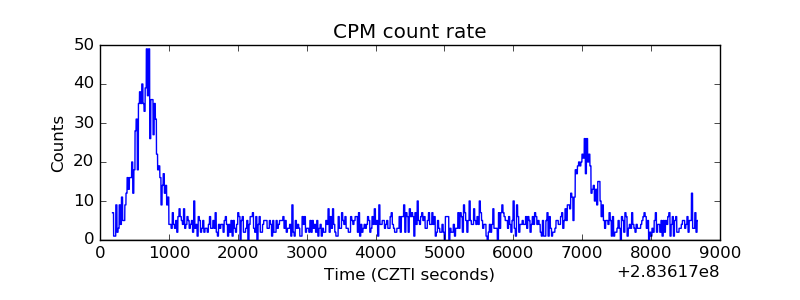 |
| CZT Counter | 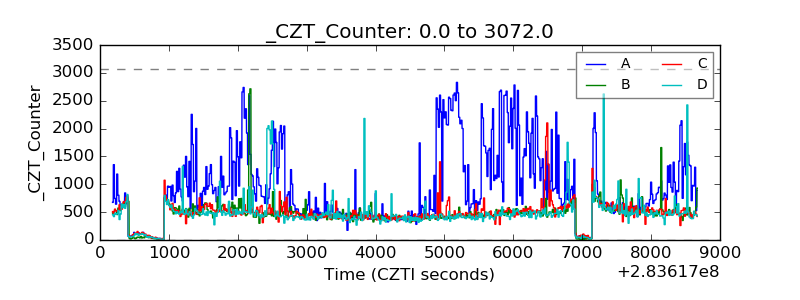 |
| +2.5 Volts monitor |  |
| +5 Volts monitor |  |
| _ROLL_ROT | 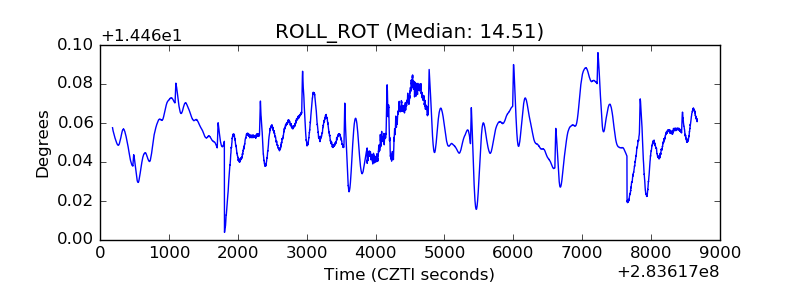 |
| _Roll_DEC | 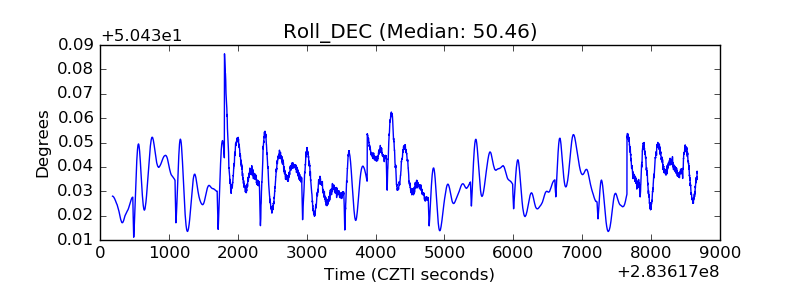 |
| _Roll_RA | 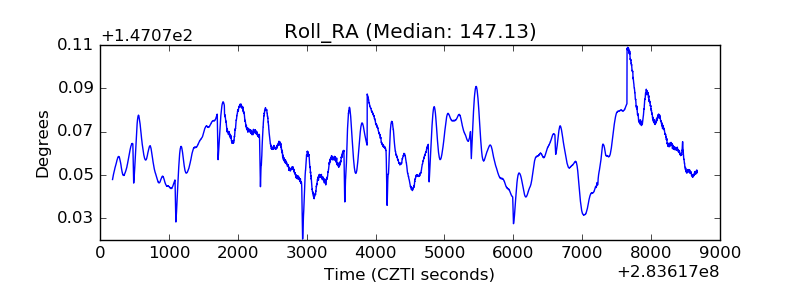 |
| Veto Counter | 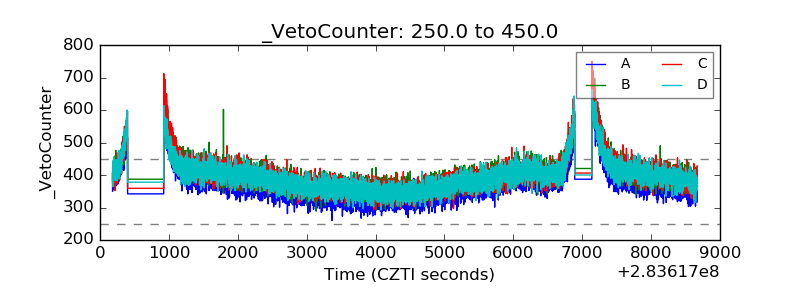 |