| Param | Original file | Final file |
|---|---|---|
| Filename | modeM0/AS1A05_012T02_9000002602_17565cztM0_level2.evt | modeM0/AS1A05_012T02_9000002602_17565cztM0_level2_quad_clean.evt |
| Size (bytes) | 873,054,720 | 182,934,720 |
| Size | 832.6 MB | 174.5 MB |
| Events in quadrant A | 6,878,442 | 1,185,541 |
| Events in quadrant B | 6,216,812 | 1,183,490 |
| Events in quadrant C | 6,235,240 | 1,142,709 |
| Events in quadrant D | 6,234,191 | 1,135,283 |
| Mode M0 | |||
|---|---|---|---|
| Quadrant | BADHDUFLAG | Total packets | Discarded packets |
| A | 0 | 29473 | 3 |
| B | 0 | 27309 | 3 |
| C | 0 | 27258 | 4 |
| D | 0 | 27973 | 3 |
| Mode M9 | |||
|---|---|---|---|
| Quadrant | BADHDUFLAG | Total packets | Discarded packets |
| A | 0 | 17 | 0 |
| B | 0 | 17 | 0 |
| C | 0 | 17 | 0 |
| D | 0 | 17 | 0 |
| Mode SS | |||
|---|---|---|---|
| Quadrant | BADHDUFLAG | Total packets | Discarded packets |
| A | 0 | 266 | 0 |
| B | 0 | 266 | 0 |
| C | 0 | 266 | 0 |
| D | 0 | 266 | 0 |
| Quadrant | Total seconds | Saturated seconds | Saturation percentage |
|---|---|---|---|
| A | 12929 | 99 | 0.765720% |
| B | 12929 | 87 | 0.672906% |
| C | 12929 | 145 | 1.121510% |
| D | 12929 | 161 | 1.245263% |
Noise dominated data is calculated using 1-second bins in cleaned event files. If a bin has >2000 counts, and if more than 50% of those come from <1% of pixels, then it is considered to be noise-dominated and hence unusable.
| Quadrant | # 1 sec bins | Bins with >0 counts | Bins with >2000 counts | High rate bins dominated by noise | Noise dominated (total time) | Noise dominated (detector-on time) | Marked lightcurve |
|---|---|---|---|---|---|---|---|
| A | 14619 | 12932 | 22 | 22 | 0.15% | 0.17% | 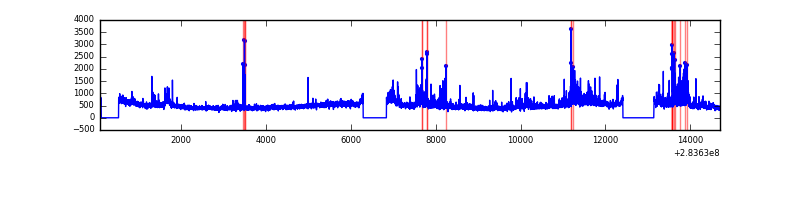 |
| B | 14619 | 12932 | 21 | 21 | 0.14% | 0.16% | 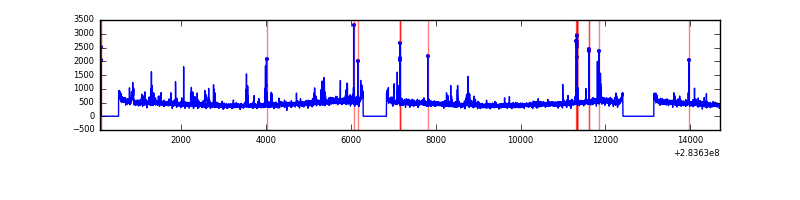 |
| C | 14619 | 12931 | 0 | 0 | 0.00% | 0.00% | 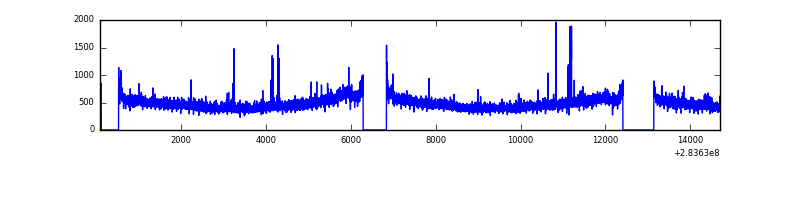 |
| D | 14619 | 12931 | 86 | 86 | 0.59% | 0.67% | 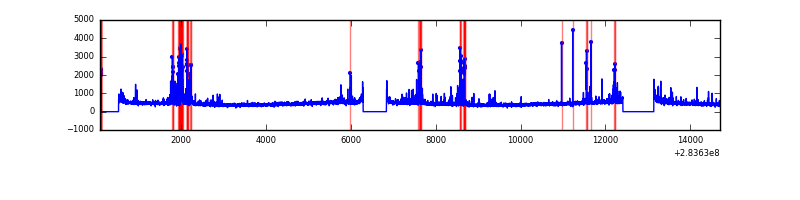 |
Top three noisy pixels from each quadrant. If the there are fewer than three noisy pixels in the level2.evt file, extra rows are filled as -1
| Pixel properties | Quadrant properties | ||||||
|---|---|---|---|---|---|---|---|
| Quadrant | DetID | PixID | Counts | Sigma | Mean | Median | Sigma |
| A | 14 | 237 | 977624 | 3221.01 | 1505 | 1474 | 303.1 |
| A | 15 | 174 | 96064 | 312.12 | 1505 | 1474 | 303.1 |
| A | 0 | 13 | 21637 | 66.53 | 1505 | 1474 | 303.1 |
| B | 4 | 80 | 69585 | 235.38 | 1507 | 1464 | 289.4 |
| B | 0 | 229 | 48394 | 162.16 | 1507 | 1464 | 289.4 |
| B | 7 | 220 | 47756 | 159.96 | 1507 | 1464 | 289.4 |
| C | 3 | 233 | 265950 | 784.92 | 1443 | 1448 | 337.0 |
| C | 14 | 238 | 222661 | 656.45 | 1443 | 1448 | 337.0 |
| C | 0 | 79 | 36575 | 104.24 | 1443 | 1448 | 337.0 |
| D | 13 | 189 | 399907 | 1126.27 | 1458 | 1414 | 353.8 |
| D | 10 | 70 | 169134 | 474.03 | 1458 | 1414 | 353.8 |
| D | 2 | 234 | 60580 | 167.22 | 1458 | 1414 | 353.8 |
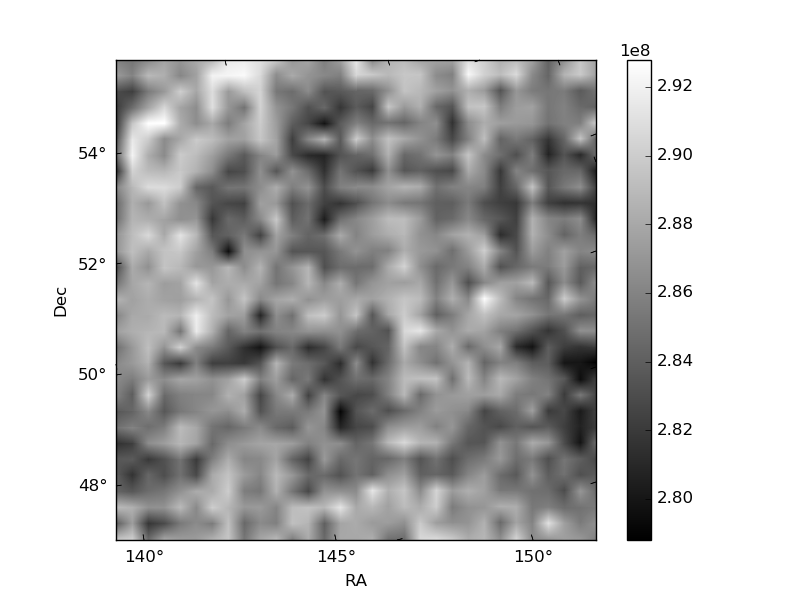
Histogram calculated using DETX and DETY for each event in the final _common_clean file
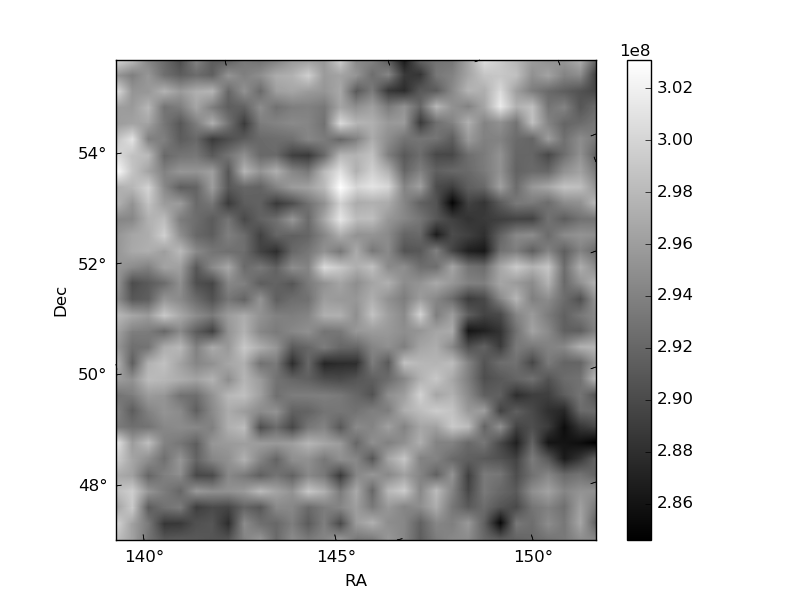
| Quadrant A | 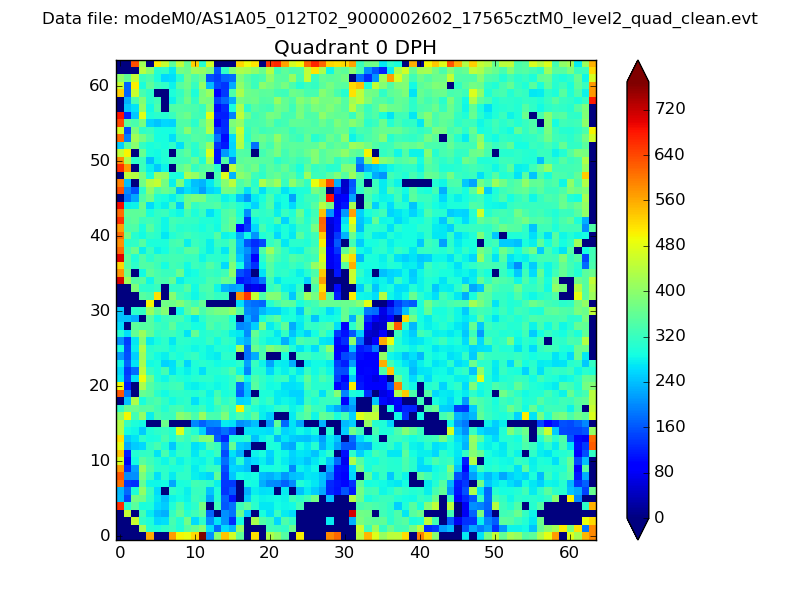 |
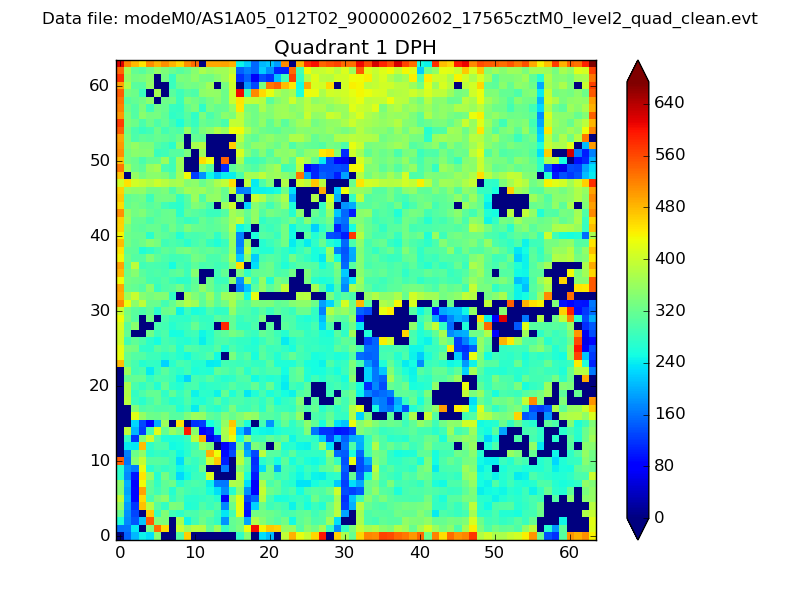 |
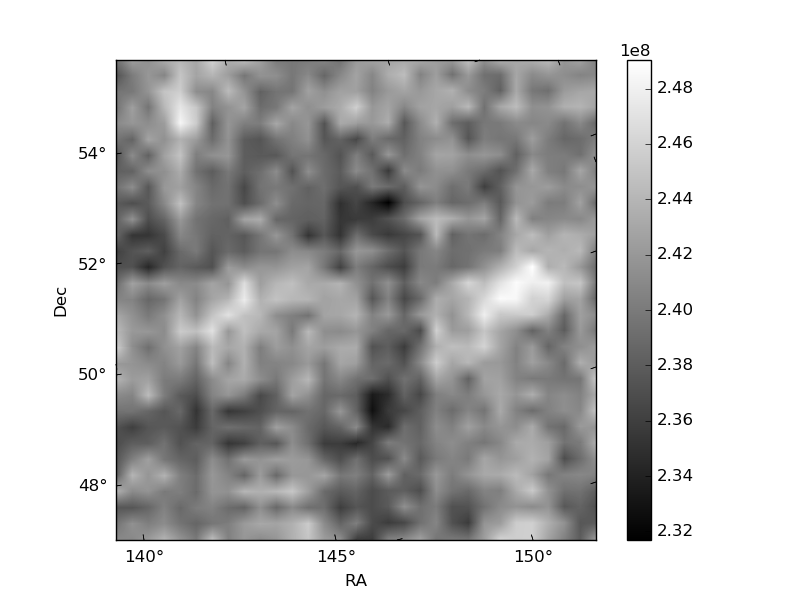
Quadrant B |
|---|---|---|---|
| Quadrant D | 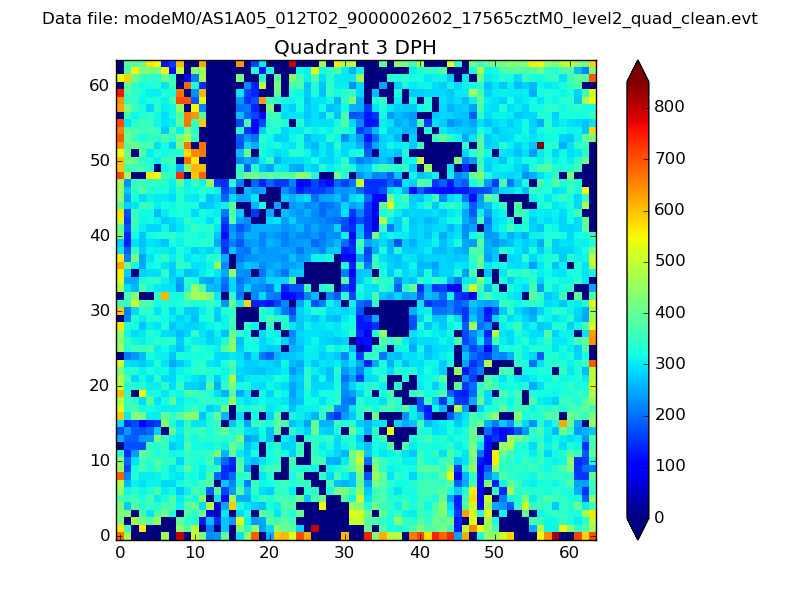 |
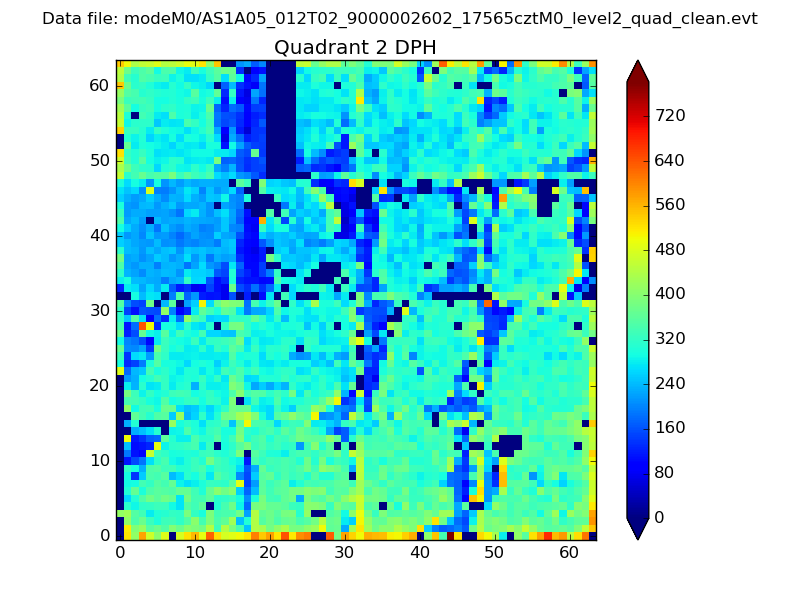 |
Quadrant C |
| Plot type | Count rate plots | Images |
|---|---|---|
| Comparison with Poisson distribution Blue bars denote a histogram of data divided into 1 sec bins. Red curve is a Poisson curve with rate = median count rate of data. |
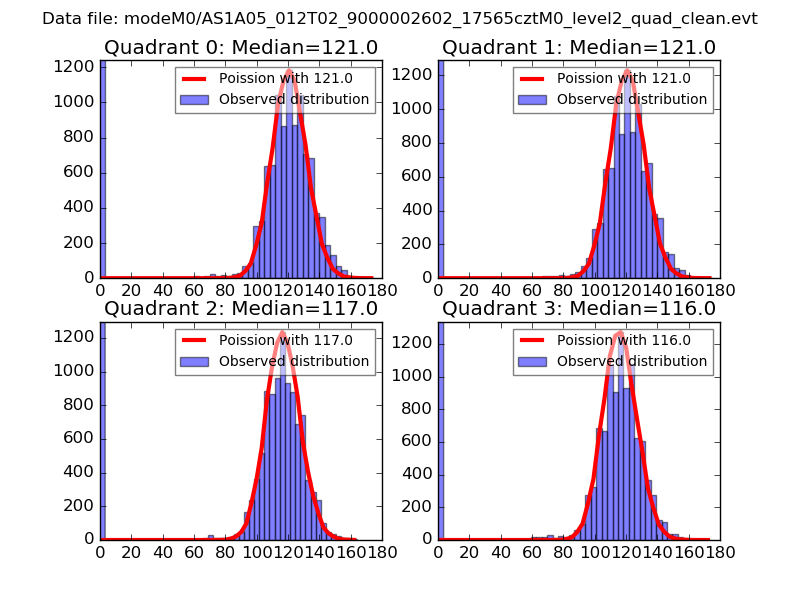 |
 |
| Quadrant-wise count rates Data is divided into 100 sec bins |
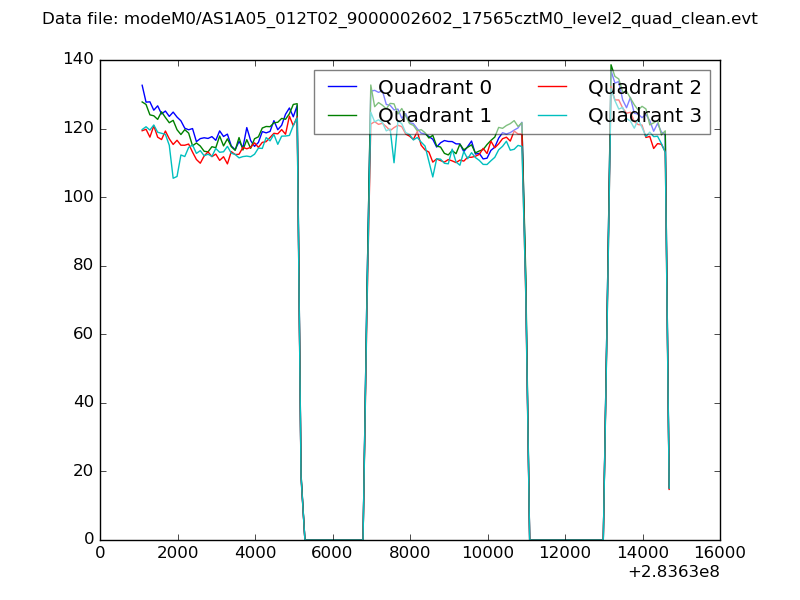 |
|
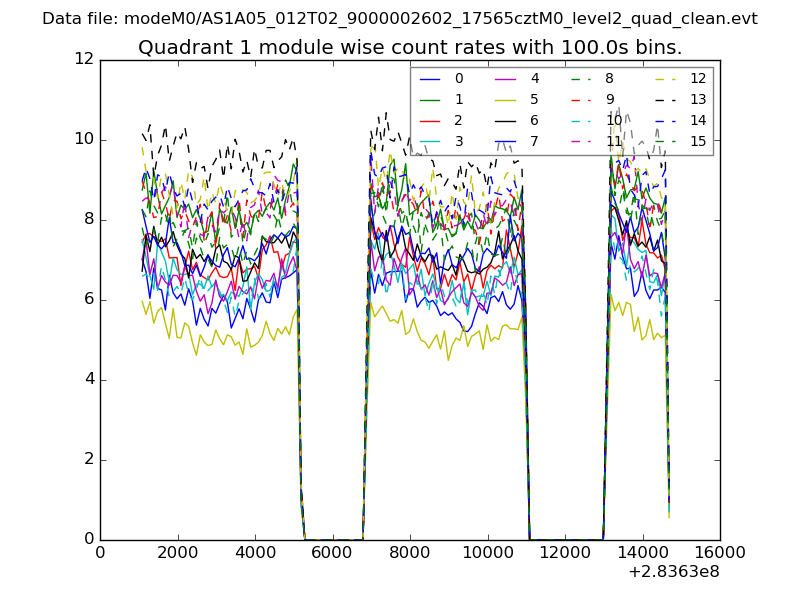
| Module-wise count rates for Quadrant A Data is divided into 100 sec bins |
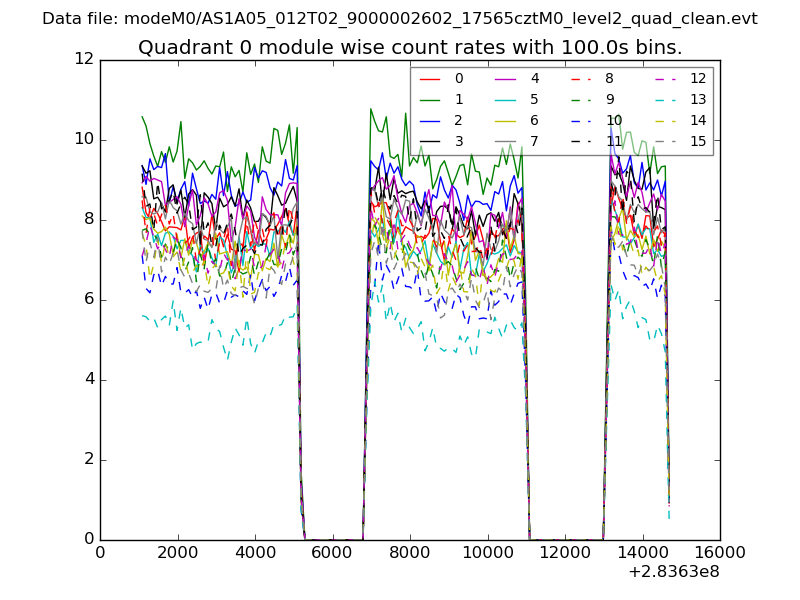 |
 |
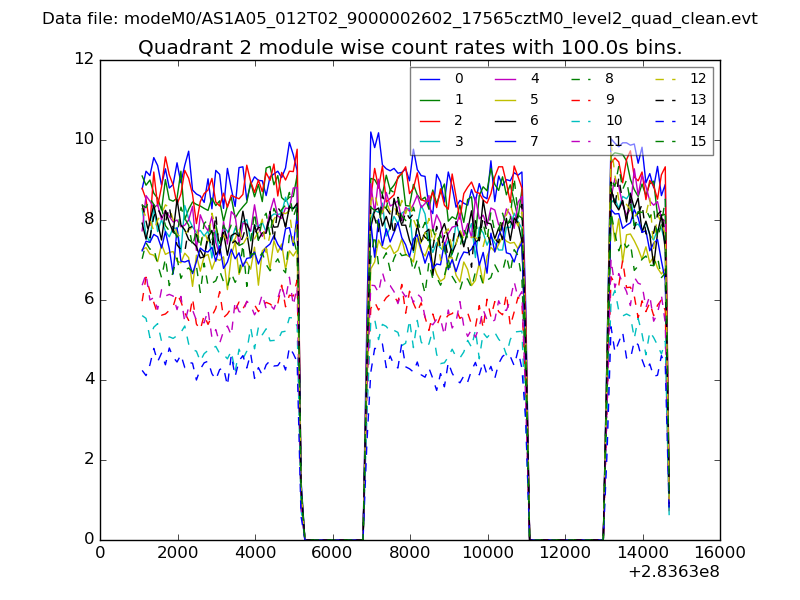
| Module-wise count rates for Quadrant B Data is divided into 100 sec bins |
 |
 |
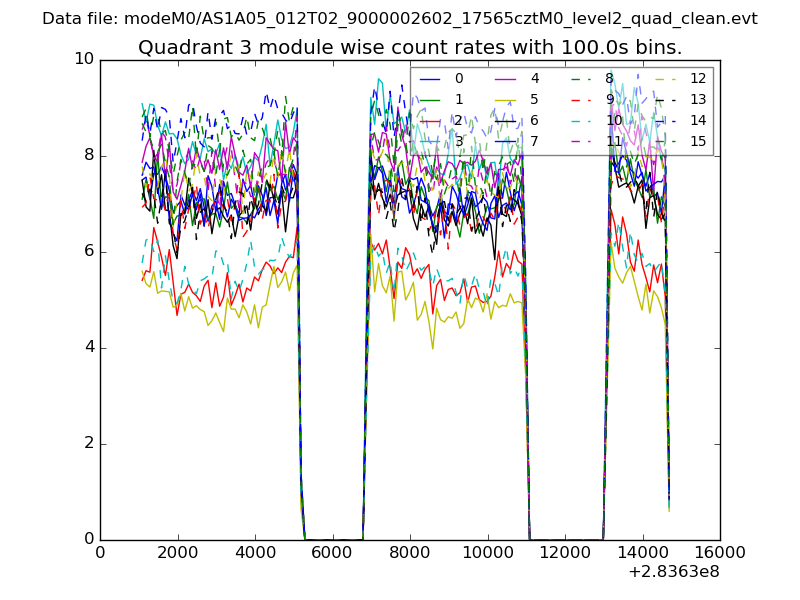
| Module-wise count rates for Quadrant C Data is divided into 100 sec bins |
 |
 |
| Module-wise count rates for Quadrant D Data is divided into 100 sec bins |
 |
 |
| Parameter | Plot |
|---|---|
| CZT HV Monitor | 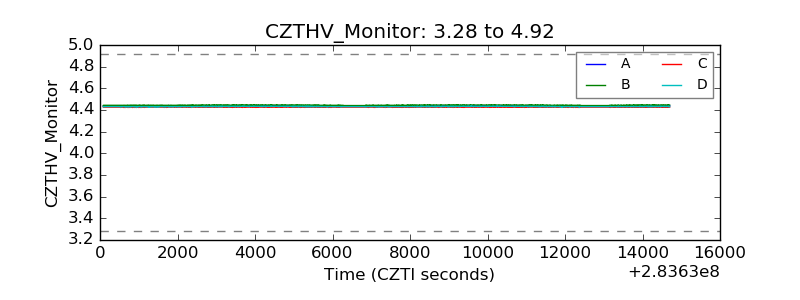 |
| D_VDD | 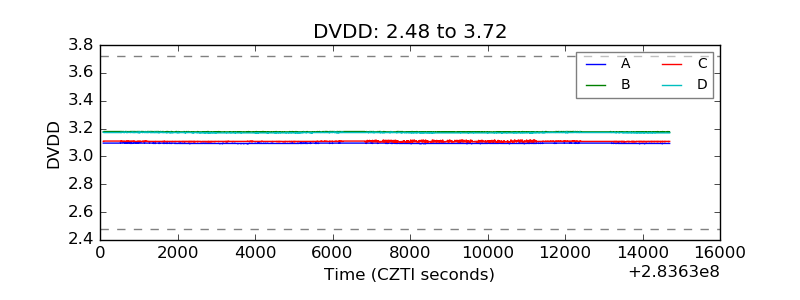 |
| Temperature 1 | 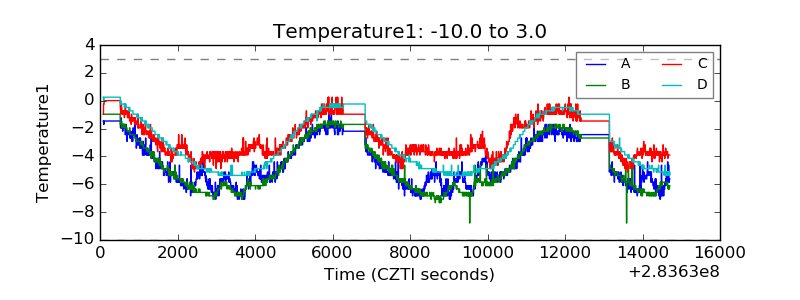 |
| Veto HV Monitor | 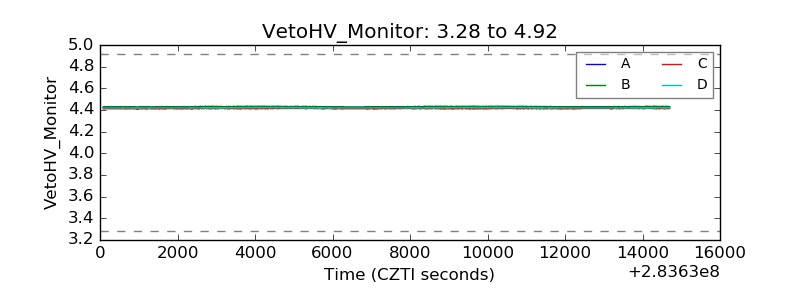 |
| Veto LLD | 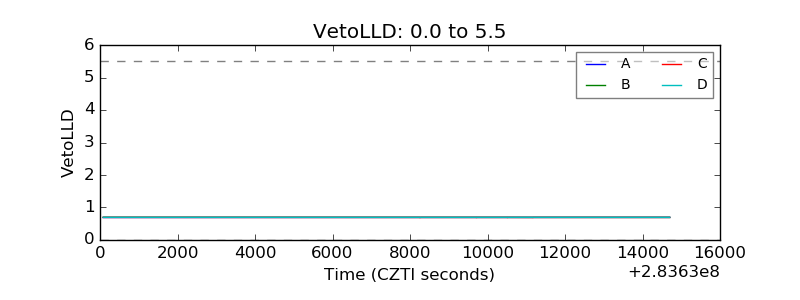 |
| Alpha Counter | 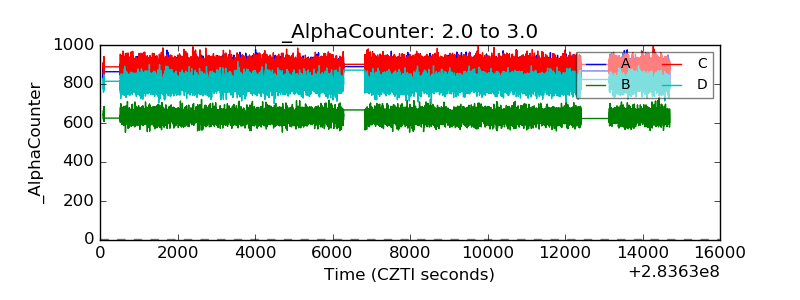 |
| _CPM_Rate | 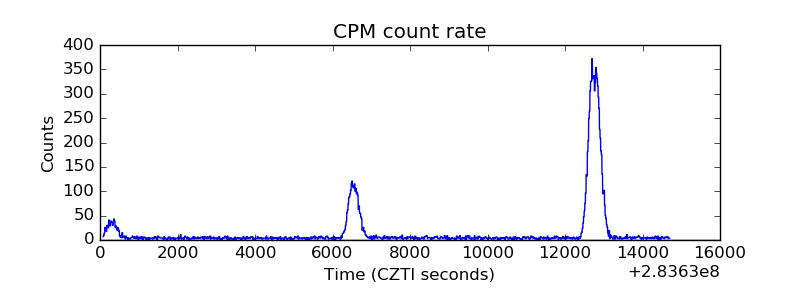 |
| CZT Counter | 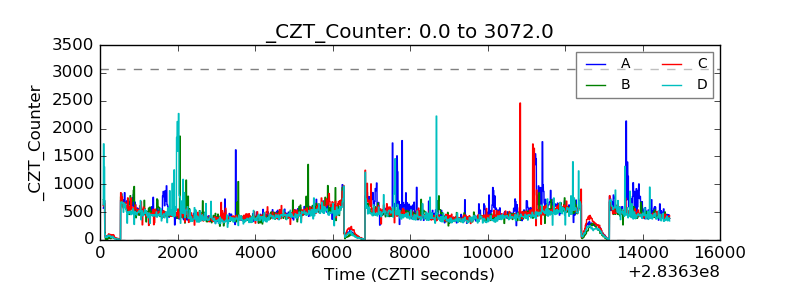 |
| +2.5 Volts monitor |  |
| +5 Volts monitor |  |
| _ROLL_ROT | 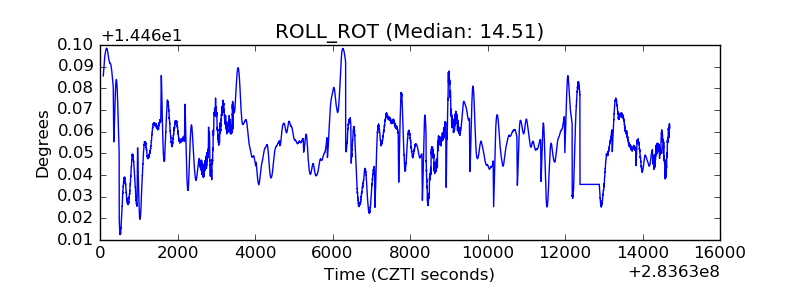 |
| _Roll_DEC | 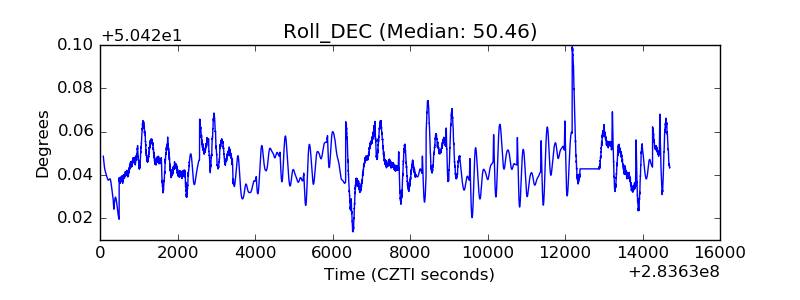 |
| _Roll_RA |  |
| Veto Counter | 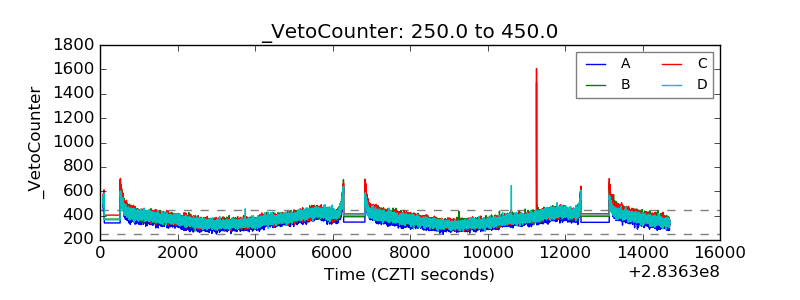 |