| Param | Original file | Final file |
|---|---|---|
| Filename | modeM0/AS1A05_012T02_9000002602_17566cztM0_level2.evt | modeM0/AS1A05_012T02_9000002602_17566cztM0_level2_quad_clean.evt |
| Size (bytes) | 444,513,600 | 100,111,680 |
| Size | 423.9 MB | 95.5 MB |
| Events in quadrant A | 3,354,028 | 647,627 |
| Events in quadrant B | 3,179,117 | 651,637 |
| Events in quadrant C | 3,192,747 | 627,441 |
| Events in quadrant D | 3,265,364 | 622,742 |
| Mode M0 | |||
|---|---|---|---|
| Quadrant | BADHDUFLAG | Total packets | Discarded packets |
| A | 0 | 14768 | 2 |
| B | 0 | 14199 | 2 |
| C | 0 | 14151 | 2 |
| D | 0 | 14798 | 2 |
| Mode M9 | |||
|---|---|---|---|
| Quadrant | BADHDUFLAG | Total packets | Discarded packets |
| A | 0 | 14 | 0 |
| B | 0 | 15 | 0 |
| C | 0 | 15 | 0 |
| D | 0 | 15 | 0 |
| Mode SS | |||
|---|---|---|---|
| Quadrant | BADHDUFLAG | Total packets | Discarded packets |
| A | 0 | 140 | 0 |
| B | 0 | 140 | 0 |
| C | 0 | 140 | 0 |
| D | 0 | 140 | 0 |
| Quadrant | Total seconds | Saturated seconds | Saturation percentage |
|---|---|---|---|
| A | 6927 | 18 | 0.259853% |
| B | 6927 | 15 | 0.216544% |
| C | 6927 | 47 | 0.678504% |
| D | 6927 | 38 | 0.548578% |
Noise dominated data is calculated using 1-second bins in cleaned event files. If a bin has >2000 counts, and if more than 50% of those come from <1% of pixels, then it is considered to be noise-dominated and hence unusable.
| Quadrant | # 1 sec bins | Bins with >0 counts | Bins with >2000 counts | High rate bins dominated by noise | Noise dominated (total time) | Noise dominated (detector-on time) | Marked lightcurve |
|---|---|---|---|---|---|---|---|
| A | 7817 | 6928 | 10 | 10 | 0.13% | 0.14% | 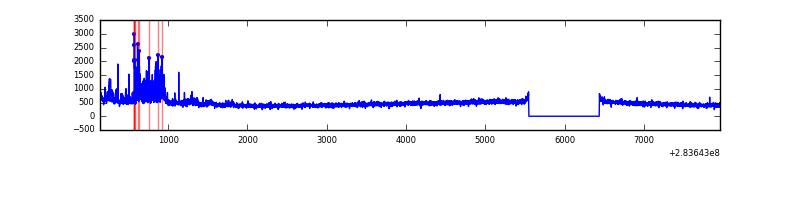 |
| B | 7817 | 6928 | 2 | 2 | 0.03% | 0.03% | 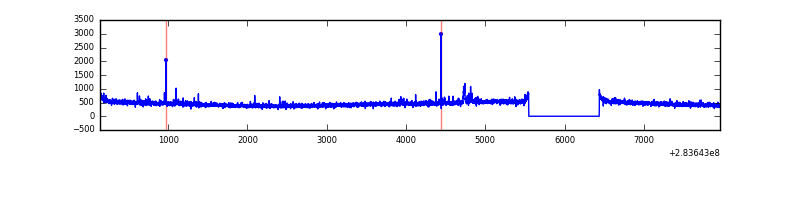 |
| C | 7817 | 6928 | 0 | 0 | 0.00% | 0.00% | 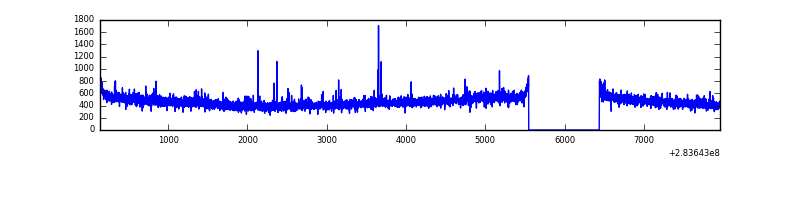 |
| D | 7817 | 6928 | 17 | 17 | 0.22% | 0.25% | 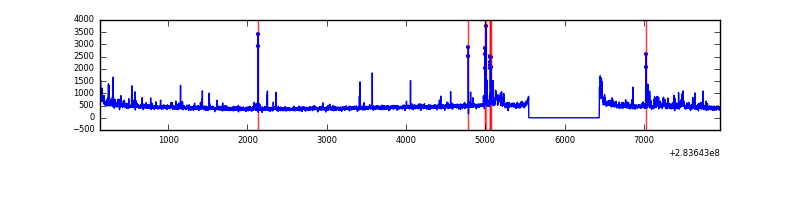 |
Top three noisy pixels from each quadrant. If the there are fewer than three noisy pixels in the level2.evt file, extra rows are filled as -1
| Pixel properties | Quadrant properties | ||||||
|---|---|---|---|---|---|---|---|
| Quadrant | DetID | PixID | Counts | Sigma | Mean | Median | Sigma |
| A | 14 | 237 | 275865 | 1690.26 | 799 | 783 | 162.7 |
| A | 0 | 226 | 6840 | 37.22 | 799 | 783 | 162.7 |
| A | 0 | 13 | 6123 | 32.81 | 799 | 783 | 162.7 |
| B | 12 | 111 | 18256 | 114.17 | 802 | 782 | 153.0 |
| B | 4 | 216 | 16681 | 103.88 | 802 | 782 | 153.0 |
| B | 11 | 111 | 15871 | 98.59 | 802 | 782 | 153.0 |
| C | 14 | 238 | 119604 | 660.39 | 770 | 774 | 179.9 |
| C | 0 | 207 | 26541 | 143.2 | 770 | 774 | 179.9 |
| C | 3 | 233 | 23113 | 124.15 | 770 | 774 | 179.9 |
| D | 13 | 189 | 158096 | 831.68 | 775 | 752 | 189.2 |
| D | 5 | 222 | 63431 | 331.31 | 775 | 752 | 189.2 |
| D | 1 | 255 | 42347 | 219.86 | 775 | 752 | 189.2 |
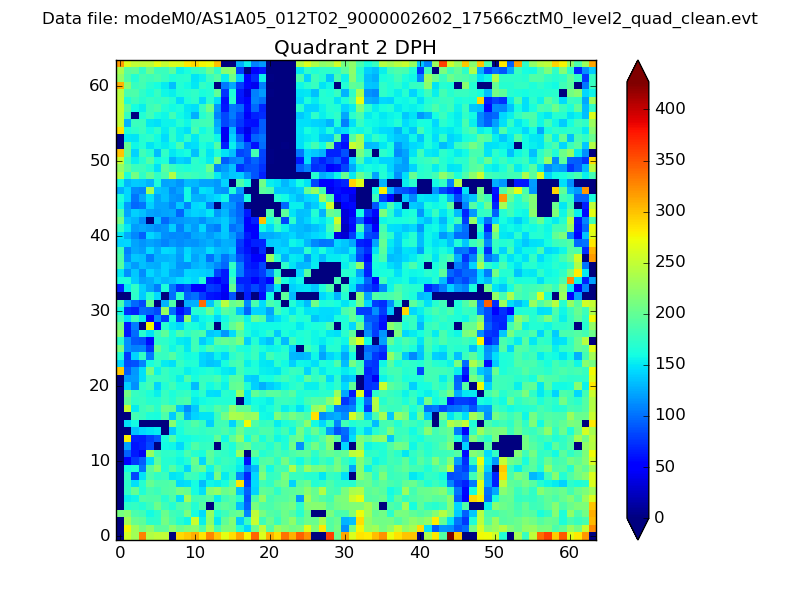
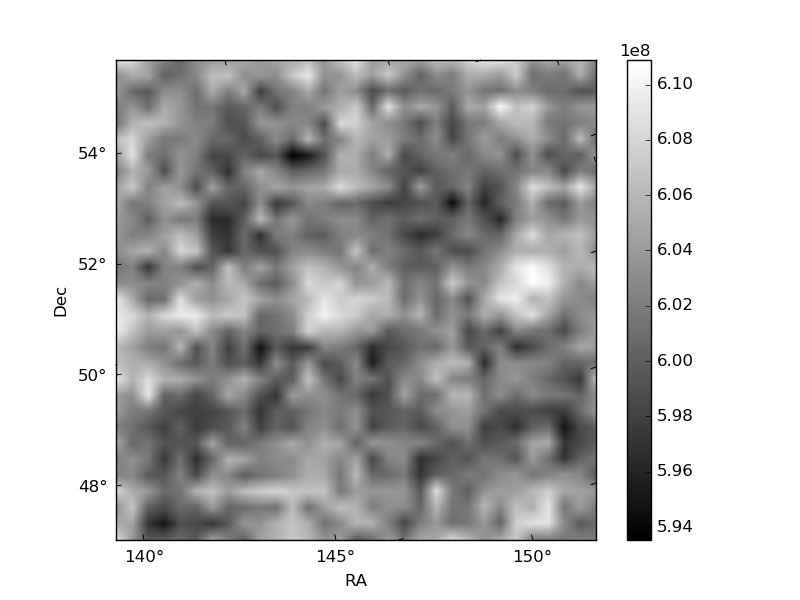
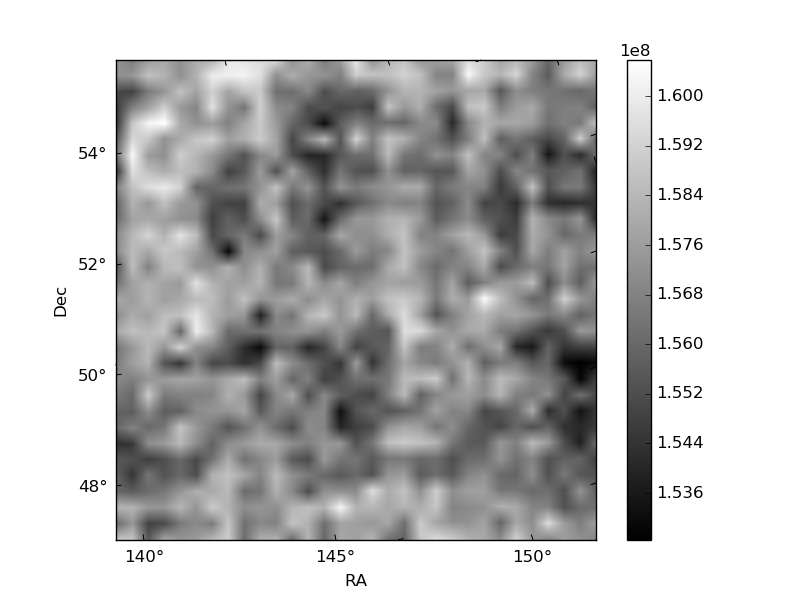
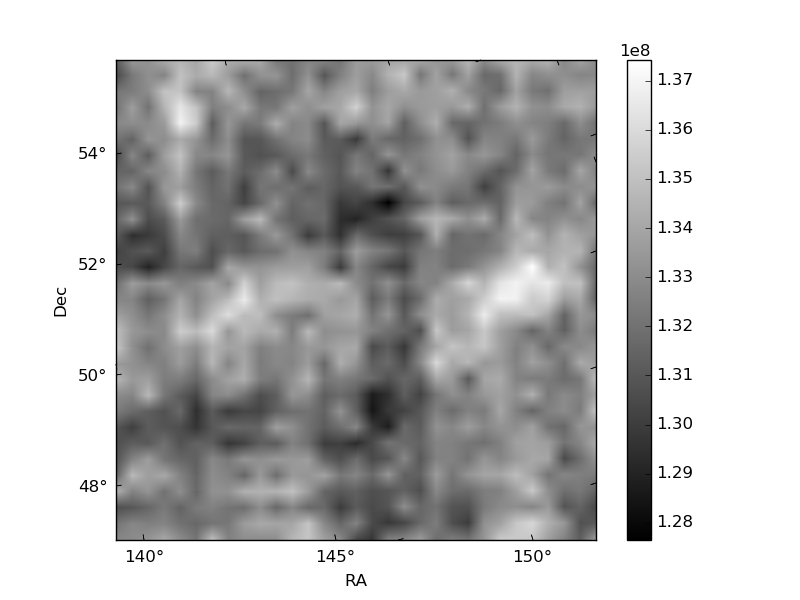
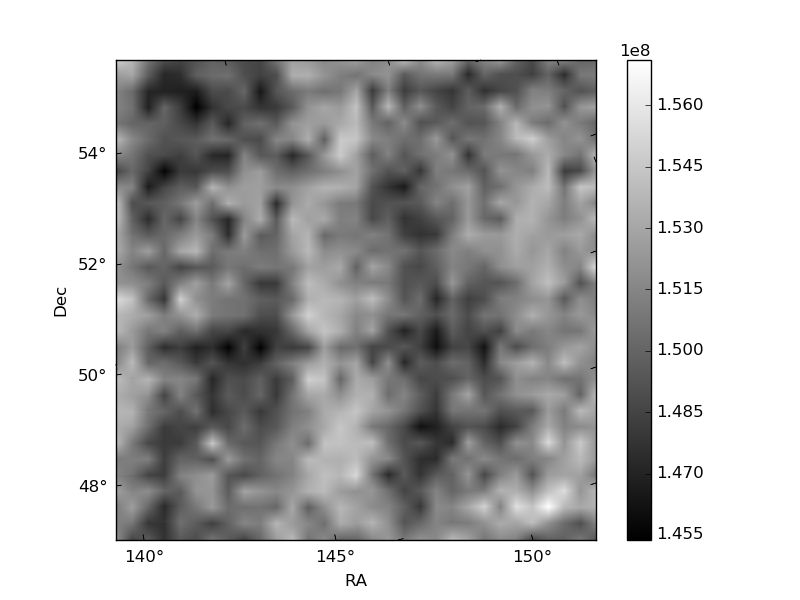
Histogram calculated using DETX and DETY for each event in the final _common_clean file
| Quadrant A | 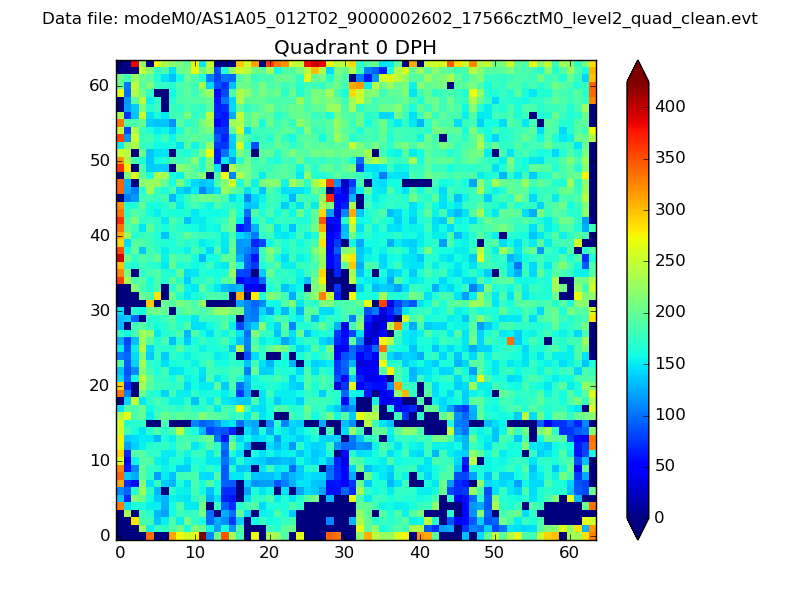 |
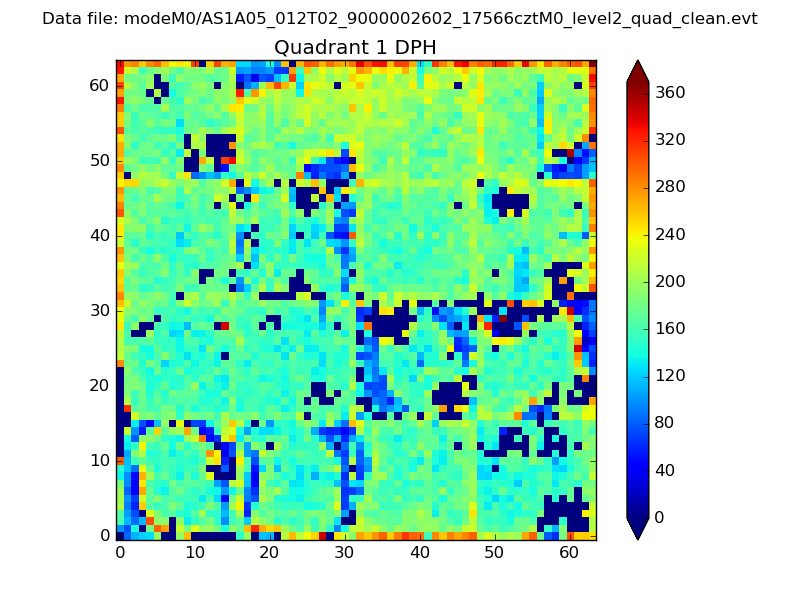 |
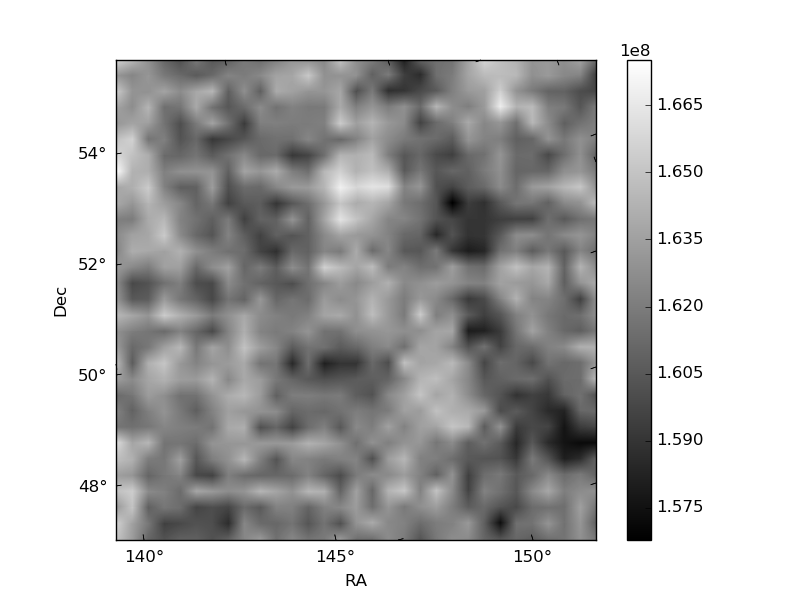
Quadrant B |
|---|---|---|---|
| Quadrant D | 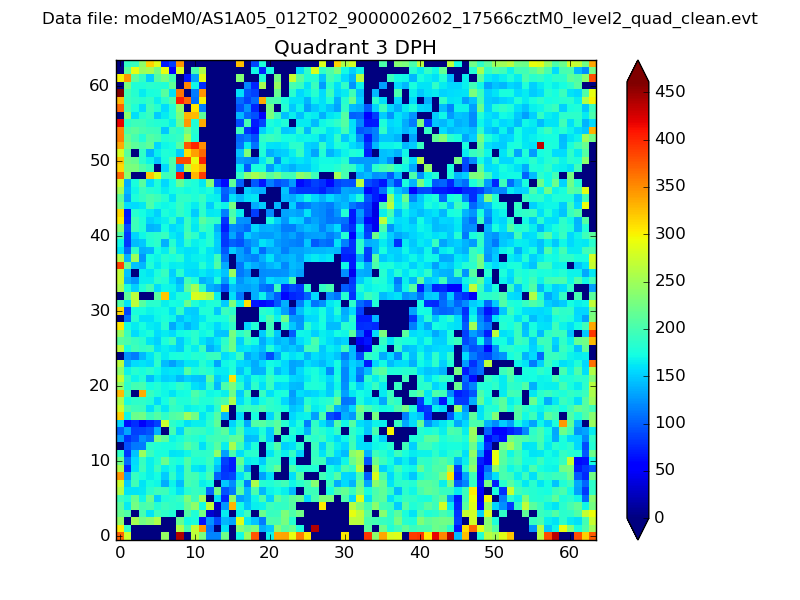 |
 |
Quadrant C |
| Plot type | Count rate plots | Images |
|---|---|---|
| Comparison with Poisson distribution Blue bars denote a histogram of data divided into 1 sec bins. Red curve is a Poisson curve with rate = median count rate of data. |
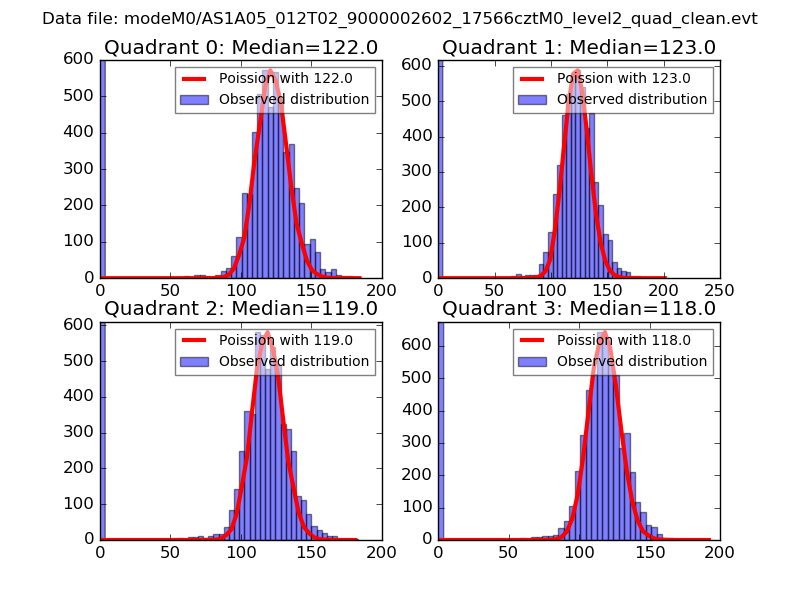 |
 |
| Quadrant-wise count rates Data is divided into 100 sec bins |
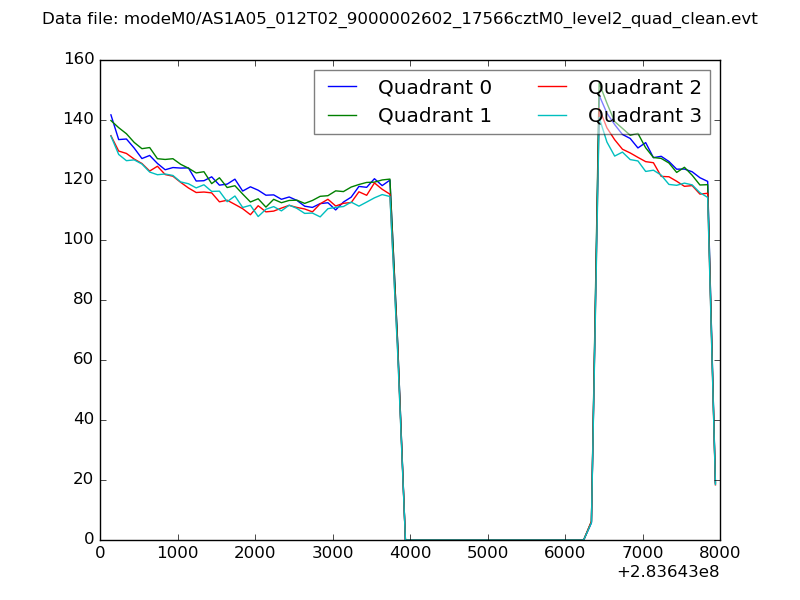 |
|
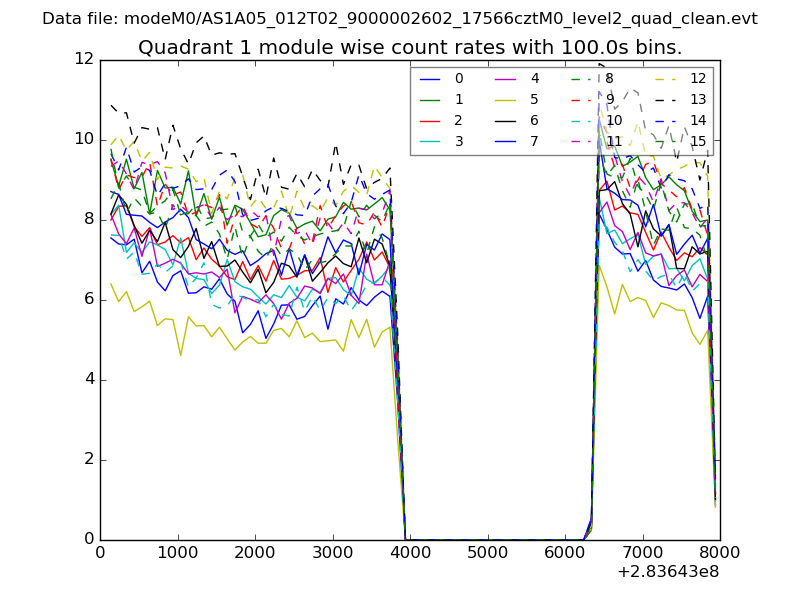
| Module-wise count rates for Quadrant A Data is divided into 100 sec bins |
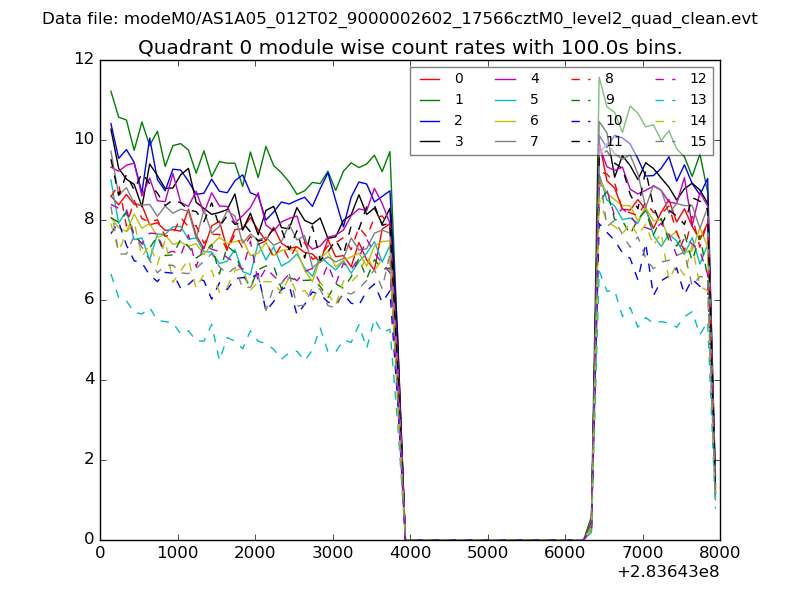 |
 |
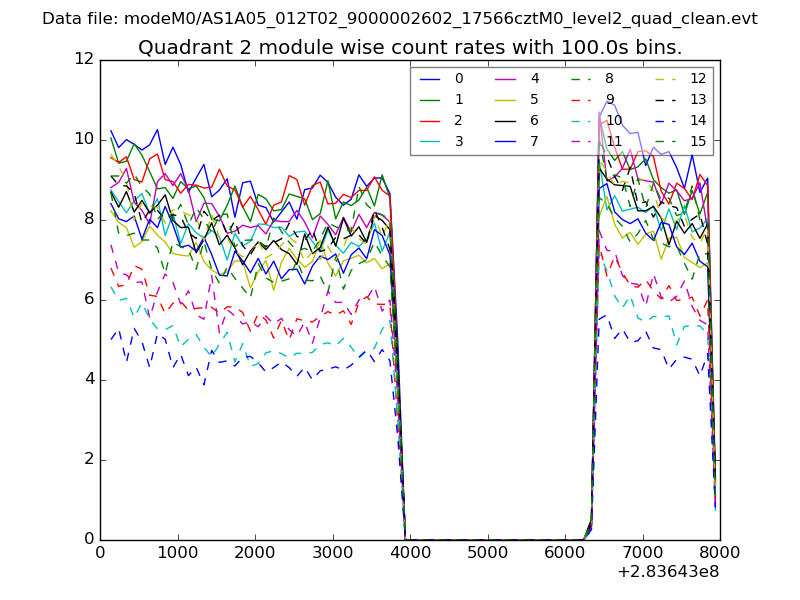
| Module-wise count rates for Quadrant B Data is divided into 100 sec bins |
 |
 |
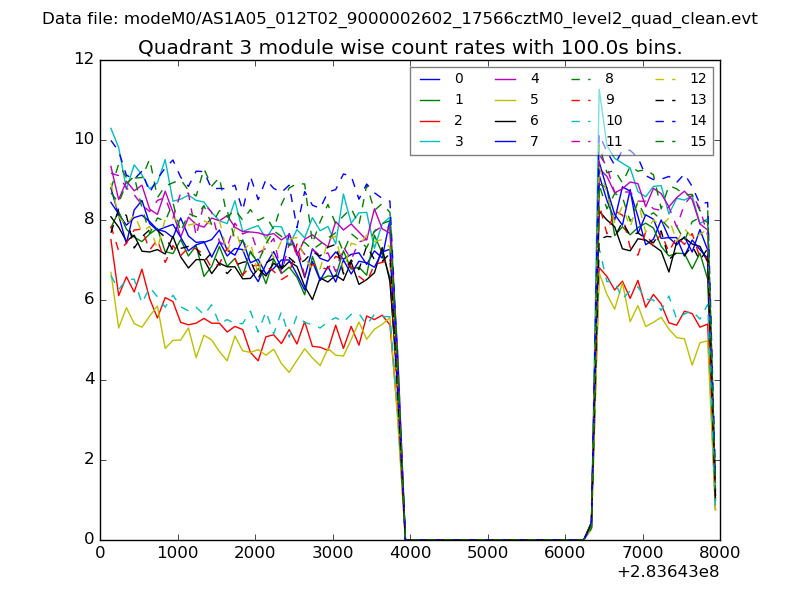
| Module-wise count rates for Quadrant C Data is divided into 100 sec bins |
 |
 |
| Module-wise count rates for Quadrant D Data is divided into 100 sec bins |
 |
 |
| Parameter | Plot |
|---|---|
| CZT HV Monitor | 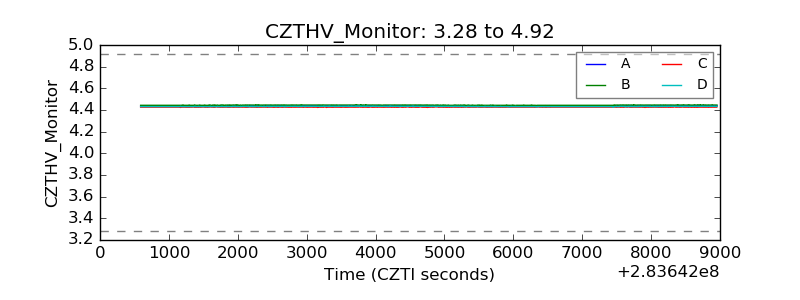 |
| D_VDD | 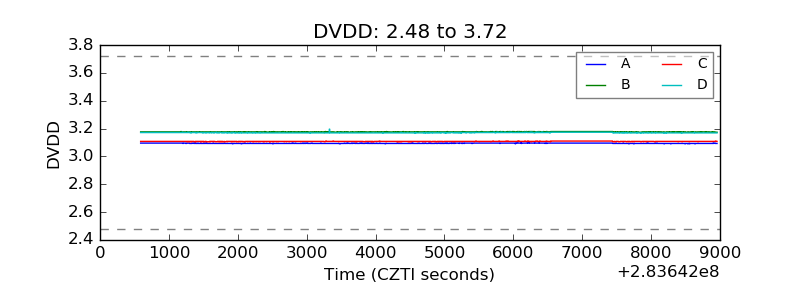 |
| Temperature 1 | 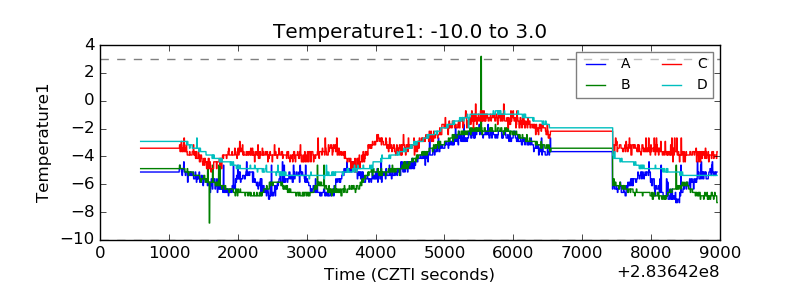 |
| Veto HV Monitor | 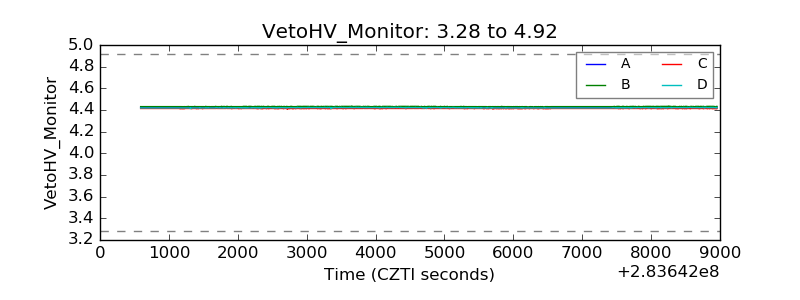 |
| Veto LLD | 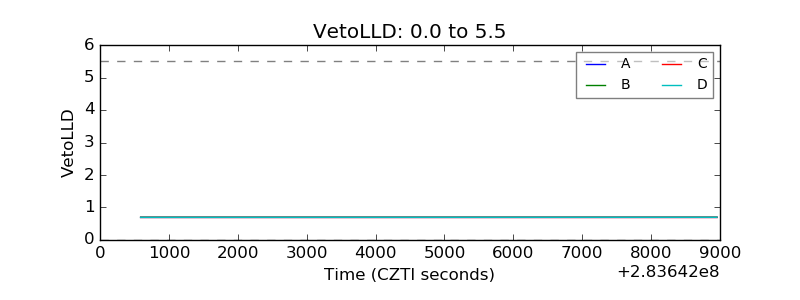 |
| Alpha Counter | 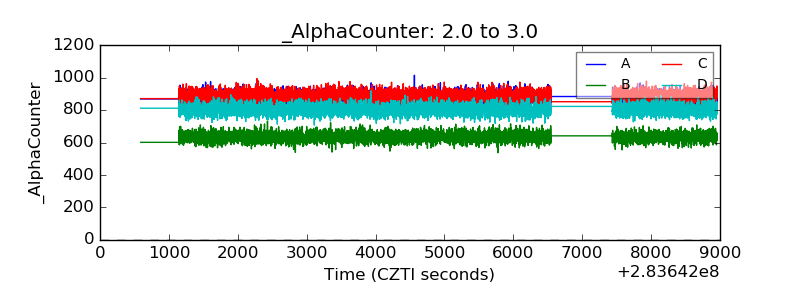 |
| _CPM_Rate | 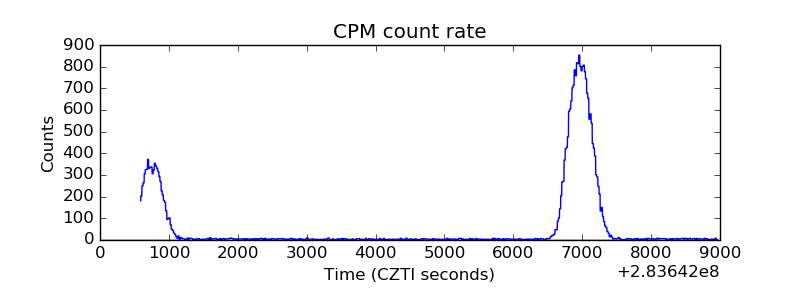 |
| CZT Counter | 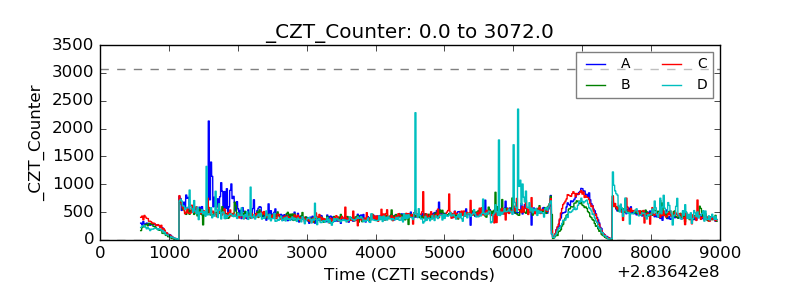 |
| +2.5 Volts monitor |  |
| +5 Volts monitor | 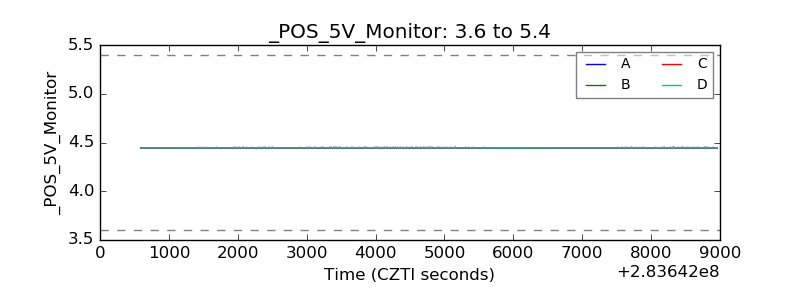 |
| _ROLL_ROT | 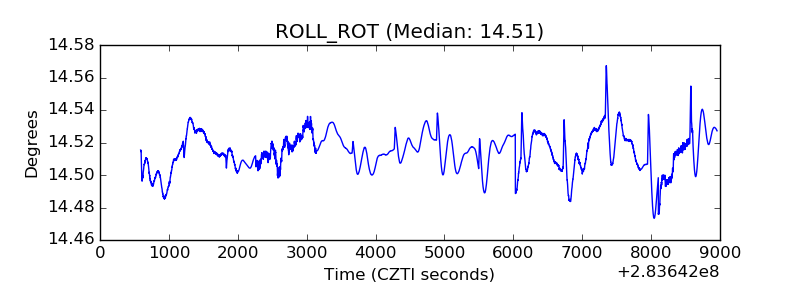 |
| _Roll_DEC | 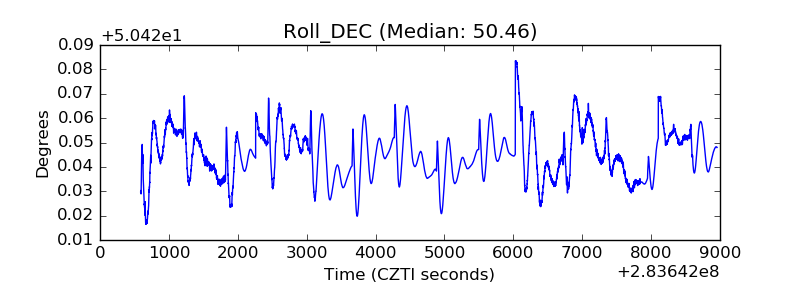 |
| _Roll_RA | 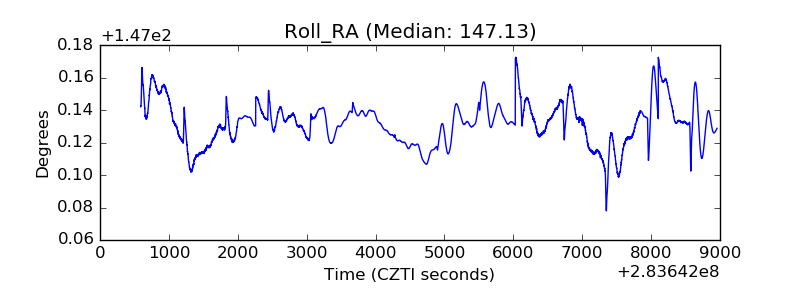 |
| Veto Counter | 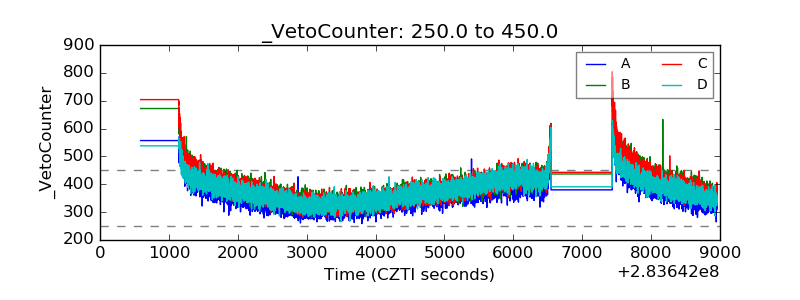 |