| Param | Original file | Final file |
|---|---|---|
| Filename | modeM0/AS1A05_012T02_9000002602_17569cztM0_level2.evt | modeM0/AS1A05_012T02_9000002602_17569cztM0_level2_quad_clean.evt |
| Size (bytes) | 485,043,840 | 97,669,440 |
| Size | 462.6 MB | 93.1 MB |
| Events in quadrant A | 3,193,044 | 648,876 |
| Events in quadrant B | 3,090,456 | 657,213 |
| Events in quadrant C | 3,081,725 | 620,150 |
| Events in quadrant D | 4,880,204 | 575,646 |
| Mode M0 | |||
|---|---|---|---|
| Quadrant | BADHDUFLAG | Total packets | Discarded packets |
| A | 0 | 13992 | 147 |
| B | 0 | 13605 | 123 |
| C | 0 | 13603 | 144 |
| D | 0 | 19206 | 190 |
| Mode M9 | |||
|---|---|---|---|
| Quadrant | BADHDUFLAG | Total packets | Discarded packets |
| A | 0 | 18 | 0 |
| B | 0 | 19 | 0 |
| C | 0 | 19 | 0 |
| D | 0 | 19 | 1 |
| Mode SS | |||
|---|---|---|---|
| Quadrant | BADHDUFLAG | Total packets | Discarded packets |
| A | 0 | 132 | 2 |
| B | 0 | 132 | 0 |
| C | 0 | 132 | 0 |
| D | 0 | 132 | 0 |
| Quadrant | Total seconds | Saturated seconds | Saturation percentage |
|---|---|---|---|
| A | 6536 | 40 | 0.611995% |
| B | 6545 | 21 | 0.320856% |
| C | 6539 | 50 | 0.764643% |
| D | 6539 | 663 | 10.139165% |
Noise dominated data is calculated using 1-second bins in cleaned event files. If a bin has >2000 counts, and if more than 50% of those come from <1% of pixels, then it is considered to be noise-dominated and hence unusable.
| Quadrant | # 1 sec bins | Bins with >0 counts | Bins with >2000 counts | High rate bins dominated by noise | Noise dominated (total time) | Noise dominated (detector-on time) | Marked lightcurve |
|---|---|---|---|---|---|---|---|
| A | 7744 | 6588 | 15 | 15 | 0.19% | 0.23% | 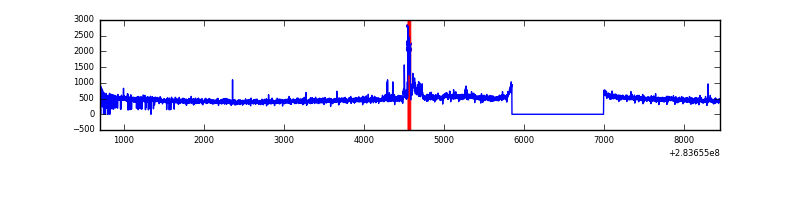 |
| B | 7744 | 6593 | 0 | 0 | 0.00% | 0.00% | 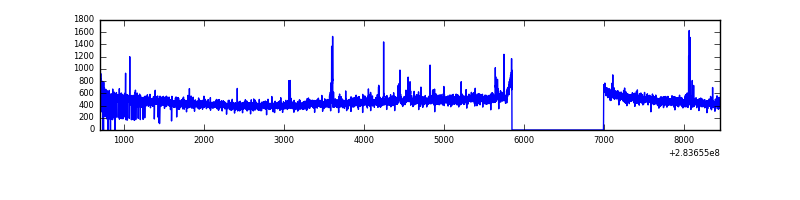 |
| C | 7744 | 6593 | 1 | 1 | 0.01% | 0.02% | 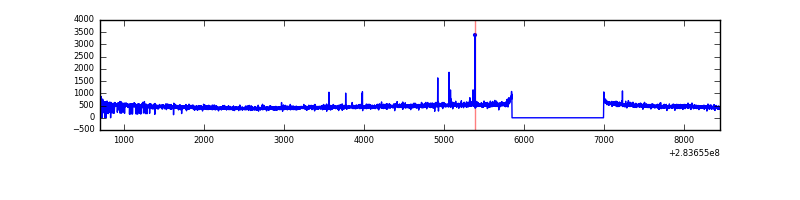 |
| D | 7744 | 6596 | 660 | 660 | 8.52% | 10.01% | 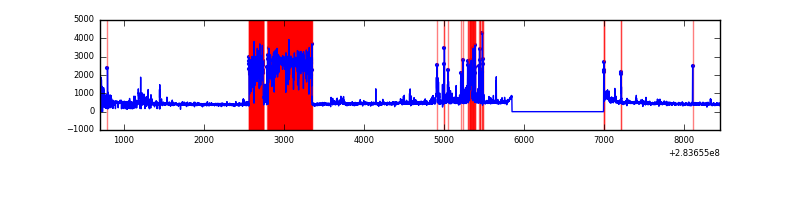 |
Top three noisy pixels from each quadrant. If the there are fewer than three noisy pixels in the level2.evt file, extra rows are filled as -1
| Pixel properties | Quadrant properties | ||||||
|---|---|---|---|---|---|---|---|
| Quadrant | DetID | PixID | Counts | Sigma | Mean | Median | Sigma |
| A | 14 | 237 | 188641 | 1186.18 | 782 | 765 | 158.4 |
| A | 0 | 226 | 6776 | 37.95 | 782 | 765 | 158.4 |
| A | 12 | 194 | 5704 | 31.18 | 782 | 765 | 158.4 |
| B | 12 | 111 | 17269 | 111.56 | 781 | 760 | 148.0 |
| B | 11 | 111 | 15061 | 96.64 | 781 | 760 | 148.0 |
| B | 4 | 216 | 12637 | 80.26 | 781 | 760 | 148.0 |
| C | 14 | 238 | 117944 | 682.94 | 742 | 745 | 171.6 |
| C | 0 | 207 | 28181 | 159.87 | 742 | 745 | 171.6 |
| C | 3 | 233 | 28062 | 159.18 | 742 | 745 | 171.6 |
| D | 12 | 227 | 1661530 | 9491.2 | 723 | 701 | 175.0 |
| D | 13 | 189 | 385861 | 2201.09 | 723 | 701 | 175.0 |
| D | 5 | 222 | 67776 | 383.32 | 723 | 701 | 175.0 |
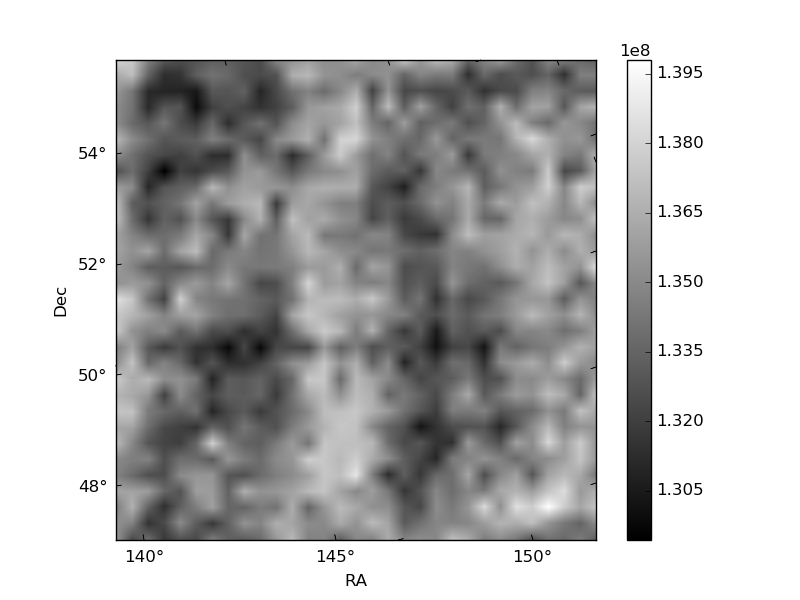
Histogram calculated using DETX and DETY for each event in the final _common_clean file
| Quadrant A | 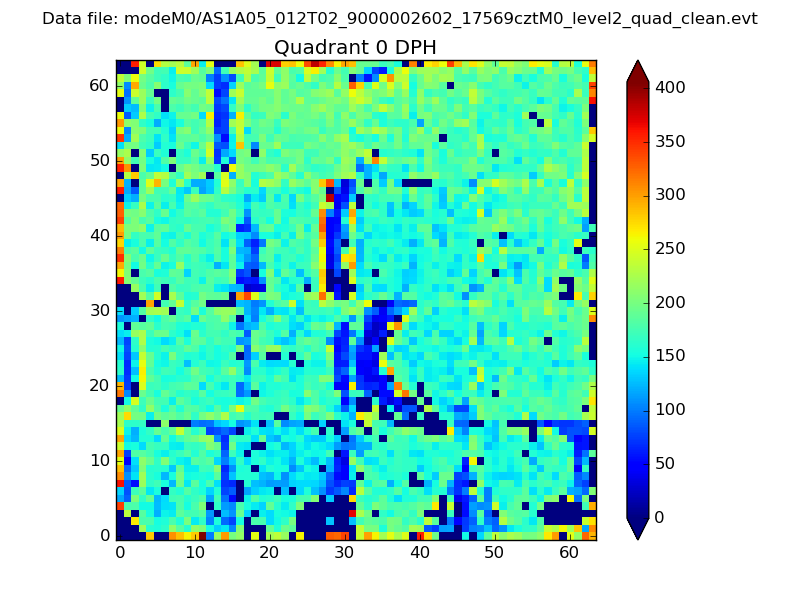 |
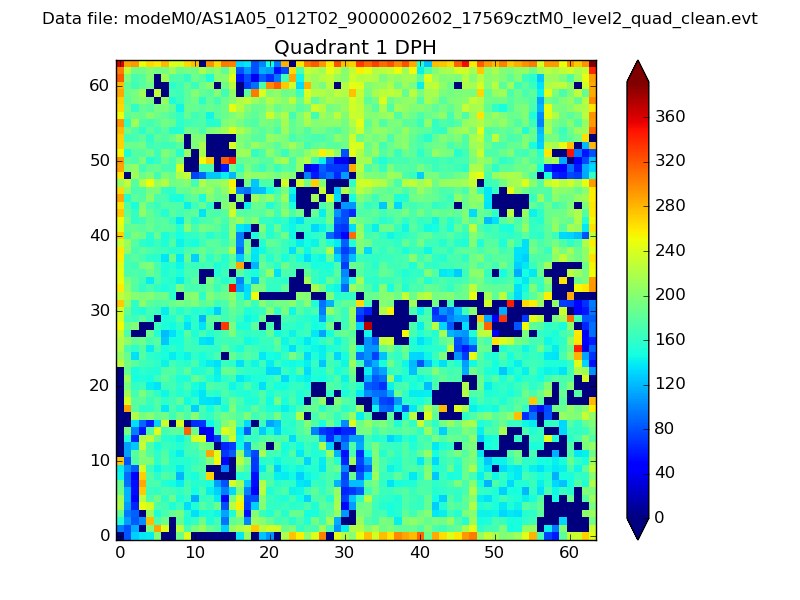 |
Quadrant B |
|---|---|---|---|
| Quadrant D | 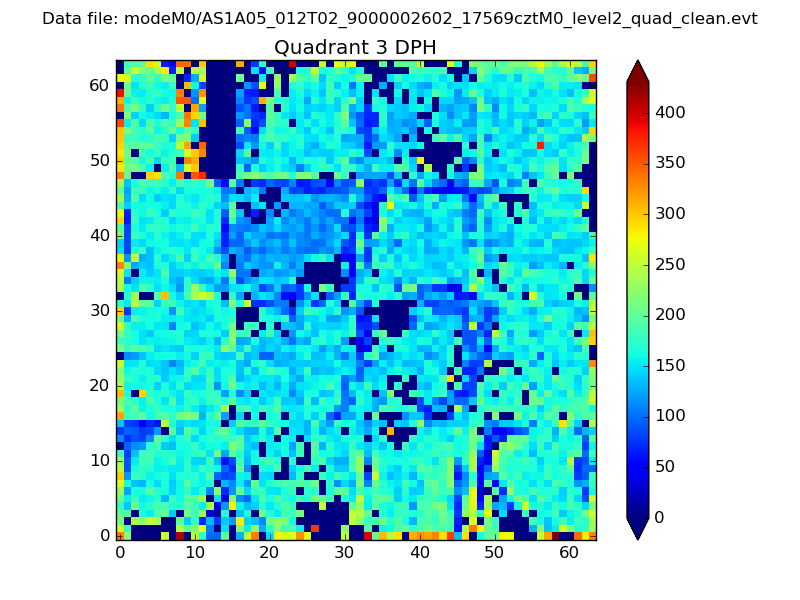 |
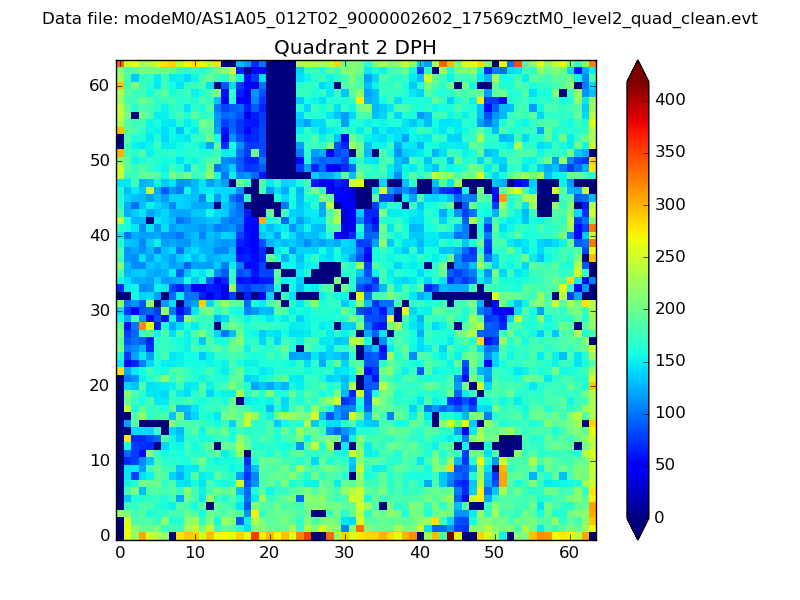 |
Quadrant C |
| Plot type | Count rate plots | Images |
|---|---|---|
| Comparison with Poisson distribution Blue bars denote a histogram of data divided into 1 sec bins. Red curve is a Poisson curve with rate = median count rate of data. |
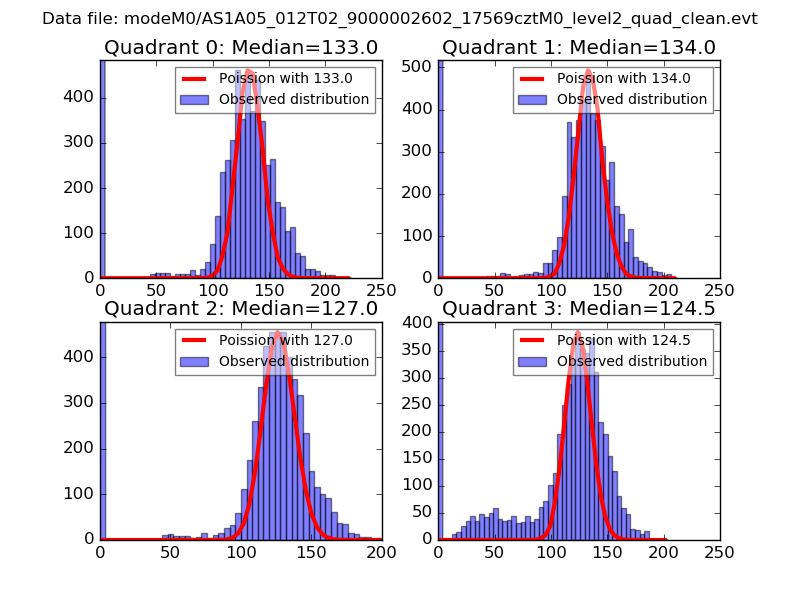 |
 |
| Quadrant-wise count rates Data is divided into 100 sec bins |
 |
|
| Module-wise count rates for Quadrant A Data is divided into 100 sec bins |
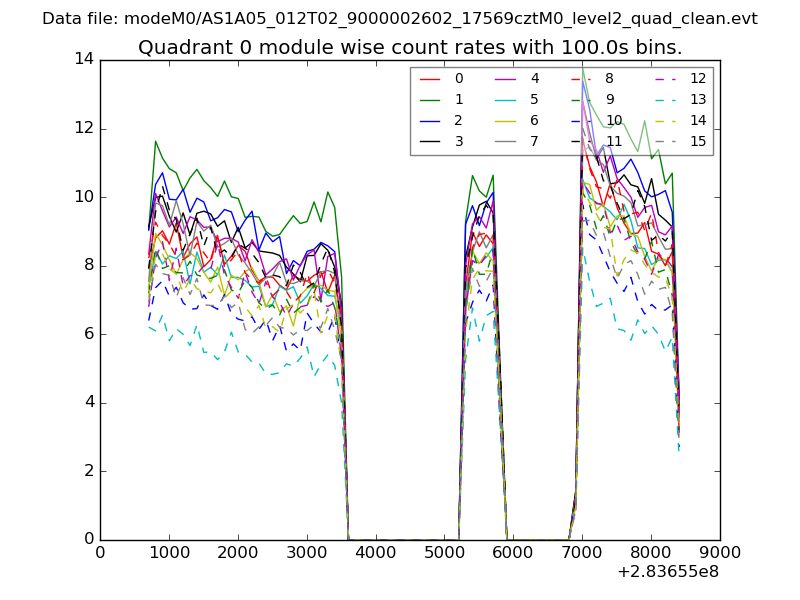 |
 |
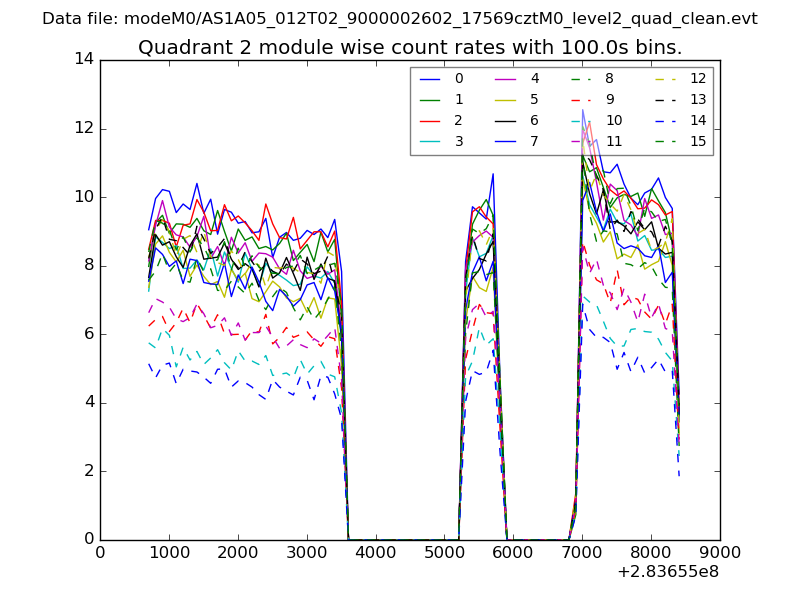
| Module-wise count rates for Quadrant B Data is divided into 100 sec bins |
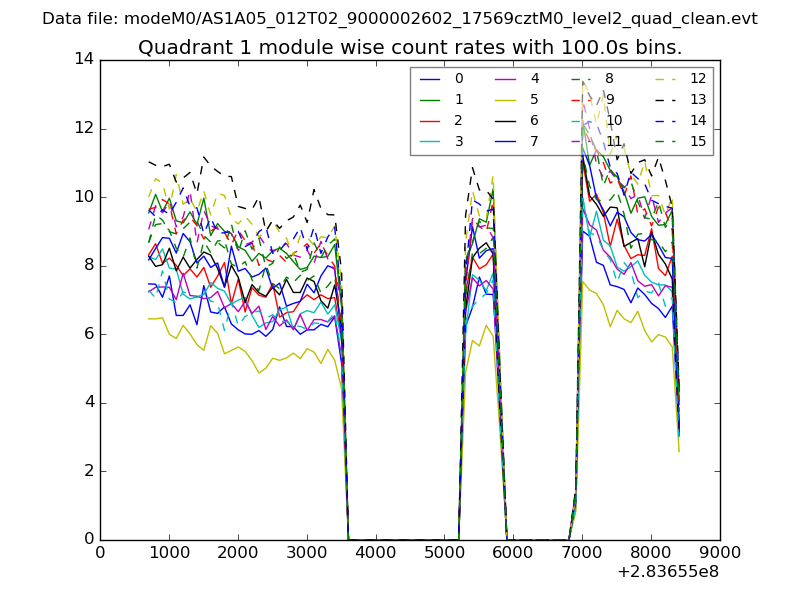 |
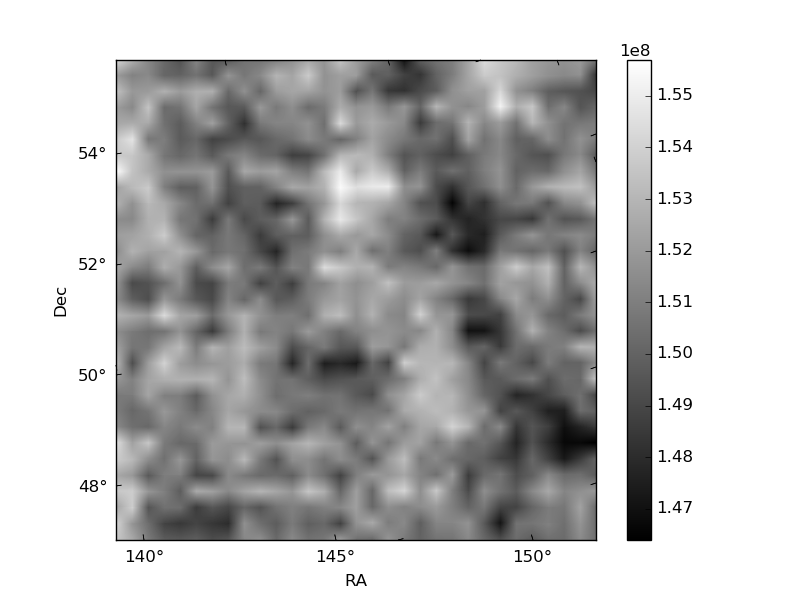 |
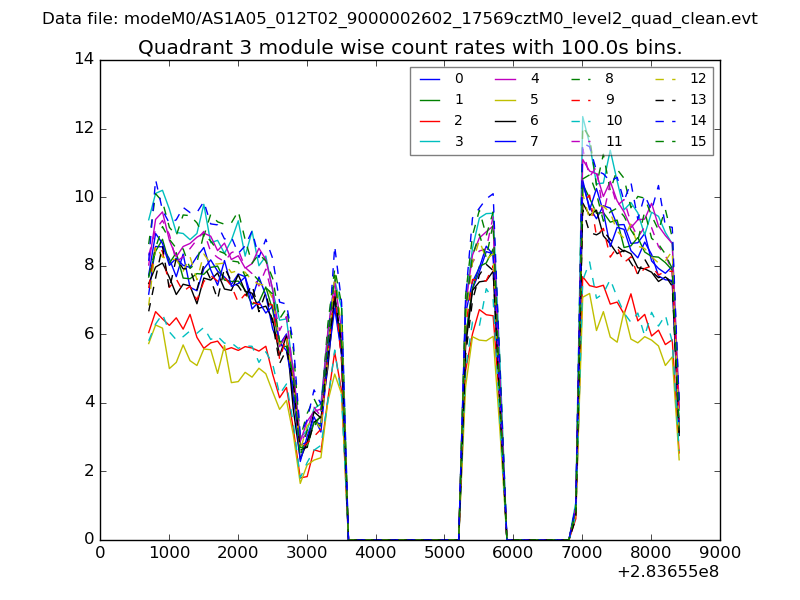
| Module-wise count rates for Quadrant C Data is divided into 100 sec bins |
 |
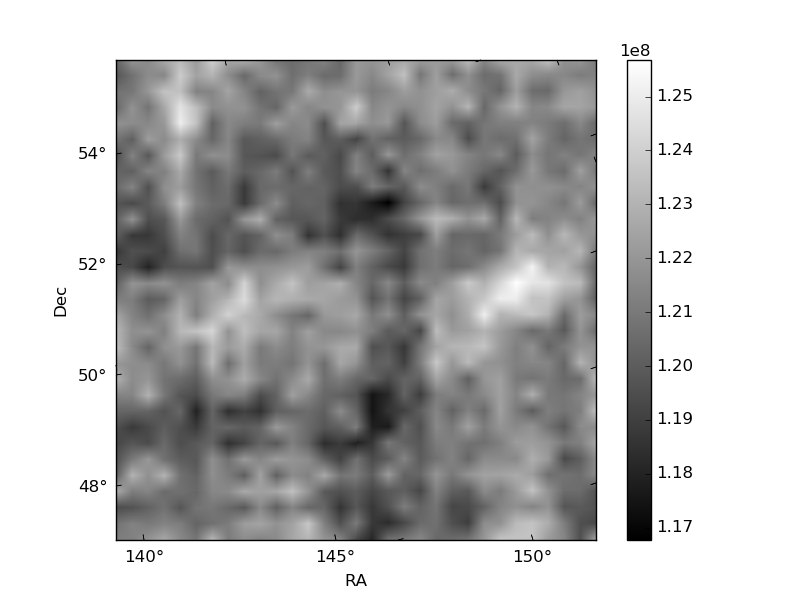 |
| Module-wise count rates for Quadrant D Data is divided into 100 sec bins |
 |
 |
| Parameter | Plot |
|---|---|
| CZT HV Monitor | 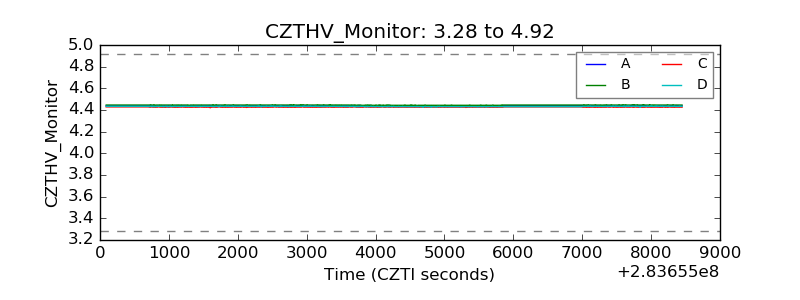 |
| D_VDD | 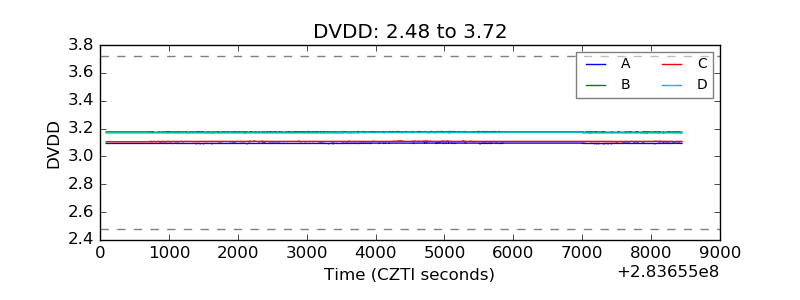 |
| Temperature 1 | 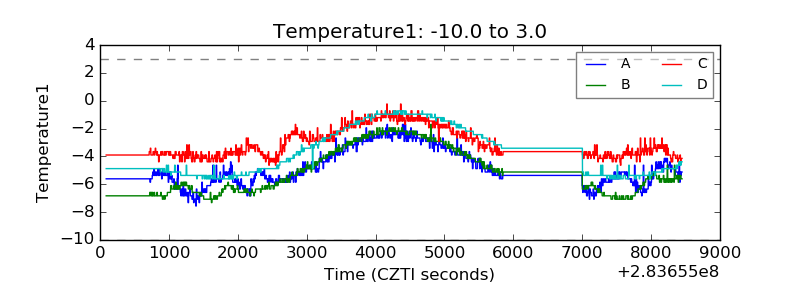 |
| Veto HV Monitor | 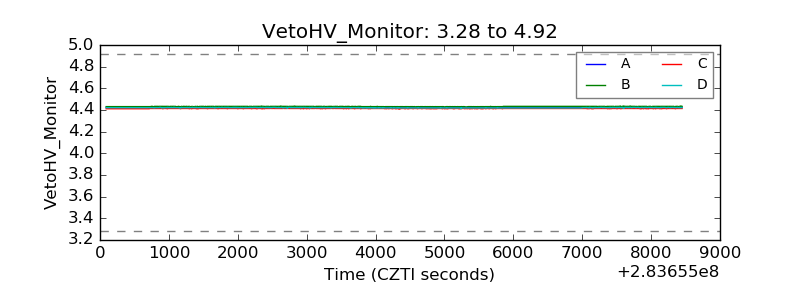 |
| Veto LLD | 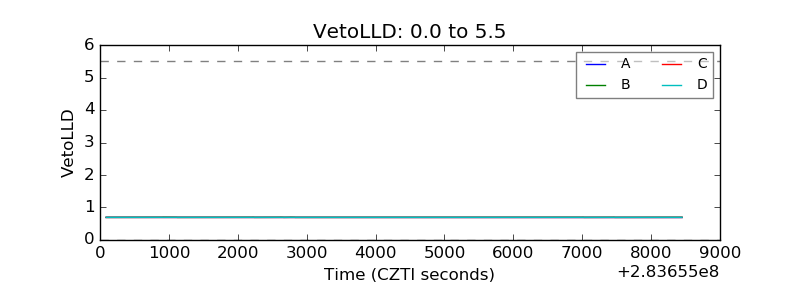 |
| Alpha Counter | 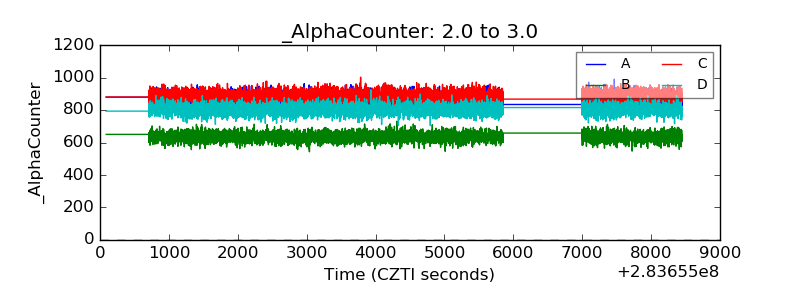 |
| _CPM_Rate | 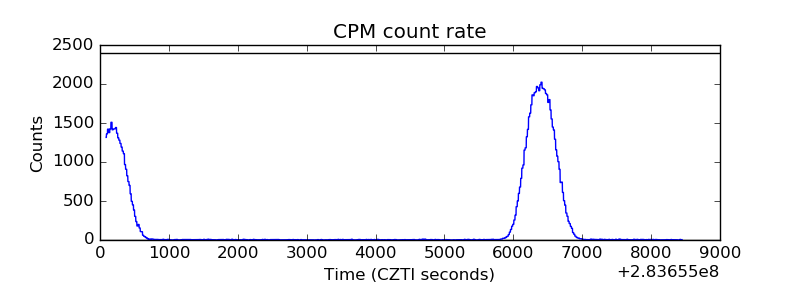 |
| CZT Counter |  |
| +2.5 Volts monitor |  |
| +5 Volts monitor |  |
| _ROLL_ROT | 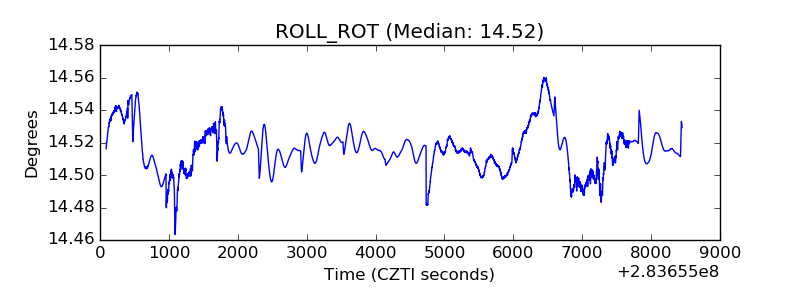 |
| _Roll_DEC | 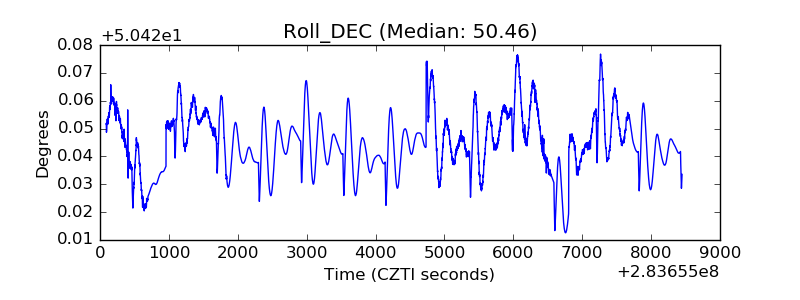 |
| _Roll_RA |  |
| Veto Counter | 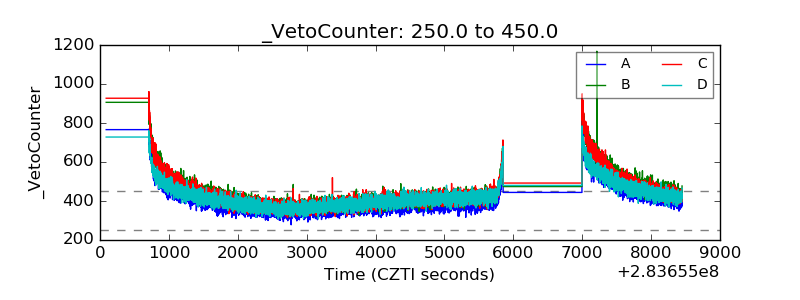 |