| Param | Original file | Final file |
|---|---|---|
| Filename | modeM0/AS1A05_012T02_9000002602_17570cztM0_level2.evt | modeM0/AS1A05_012T02_9000002602_17570cztM0_level2_quad_clean.evt |
| Size (bytes) | 428,106,240 | 100,681,920 |
| Size | 408.3 MB | 96.0 MB |
| Events in quadrant A | 3,136,313 | 670,969 |
| Events in quadrant B | 3,152,320 | 674,327 |
| Events in quadrant C | 3,148,891 | 633,255 |
| Events in quadrant D | 3,096,386 | 628,064 |
| Mode M0 | |||
|---|---|---|---|
| Quadrant | BADHDUFLAG | Total packets | Discarded packets |
| A | 0 | 13274 | 2 |
| B | 0 | 13297 | 2 |
| C | 0 | 13265 | 2 |
| D | 0 | 13528 | 2 |
| Mode M9 | |||
|---|---|---|---|
| Quadrant | BADHDUFLAG | Total packets | Discarded packets |
| A | 0 | 12 | 0 |
| B | 0 | 13 | 0 |
| C | 0 | 13 | 0 |
| D | 0 | 13 | 0 |
| Mode SS | |||
|---|---|---|---|
| Quadrant | BADHDUFLAG | Total packets | Discarded packets |
| A | 0 | 128 | 0 |
| B | 0 | 128 | 0 |
| C | 0 | 128 | 0 |
| D | 0 | 128 | 0 |
| Quadrant | Total seconds | Saturated seconds | Saturation percentage |
|---|---|---|---|
| A | 6345 | 57 | 0.898345% |
| B | 6345 | 43 | 0.677699% |
| C | 6345 | 69 | 1.087470% |
| D | 6345 | 48 | 0.756501% |
Noise dominated data is calculated using 1-second bins in cleaned event files. If a bin has >2000 counts, and if more than 50% of those come from <1% of pixels, then it is considered to be noise-dominated and hence unusable.
| Quadrant | # 1 sec bins | Bins with >0 counts | Bins with >2000 counts | High rate bins dominated by noise | Noise dominated (total time) | Noise dominated (detector-on time) | Marked lightcurve |
|---|---|---|---|---|---|---|---|
| A | 7570 | 6346 | 28 | 28 | 0.37% | 0.44% | 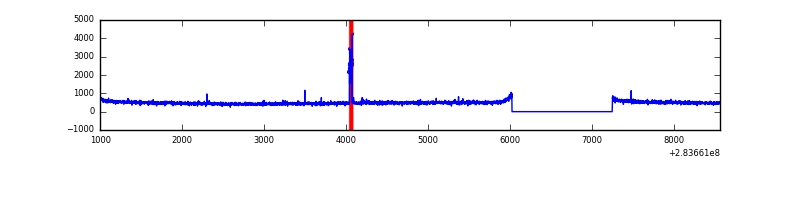 |
| B | 7570 | 6346 | 2 | 2 | 0.03% | 0.03% | 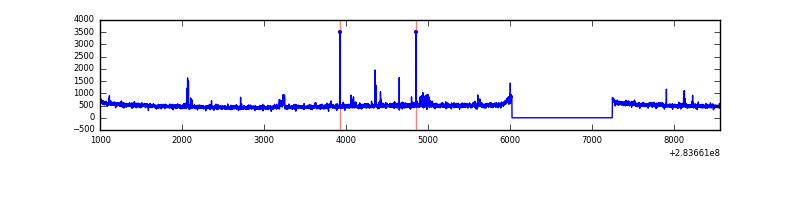 |
| C | 7570 | 6346 | 8 | 8 | 0.11% | 0.13% | 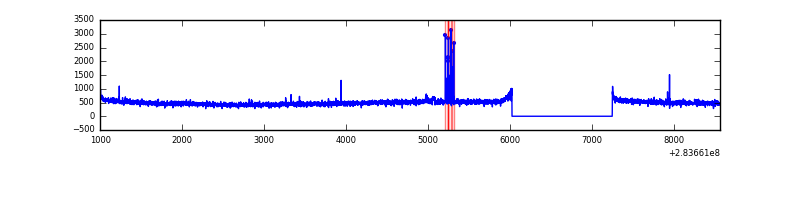 |
| D | 7570 | 6346 | 21 | 21 | 0.28% | 0.33% | 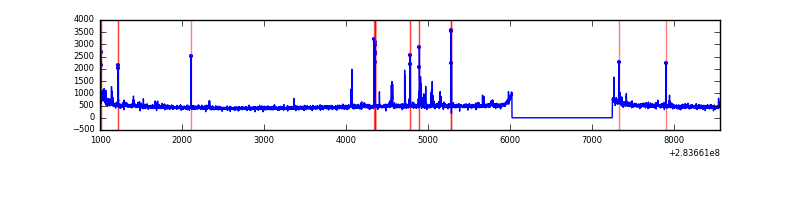 |
Top three noisy pixels from each quadrant. If the there are fewer than three noisy pixels in the level2.evt file, extra rows are filled as -1
| Pixel properties | Quadrant properties | ||||||
|---|---|---|---|---|---|---|---|
| Quadrant | DetID | PixID | Counts | Sigma | Mean | Median | Sigma |
| A | 15 | 174 | 83312 | 526.04 | 790 | 775 | 156.9 |
| A | 14 | 237 | 9616 | 56.35 | 790 | 775 | 156.9 |
| A | 0 | 226 | 6995 | 39.64 | 790 | 775 | 156.9 |
| B | 7 | 220 | 30035 | 200.04 | 786 | 767 | 146.3 |
| B | 12 | 111 | 17058 | 111.34 | 786 | 767 | 146.3 |
| B | 15 | 201 | 16611 | 108.29 | 786 | 767 | 146.3 |
| C | 14 | 238 | 117295 | 679.14 | 742 | 748 | 171.6 |
| C | 3 | 233 | 71855 | 414.35 | 742 | 748 | 171.6 |
| C | 0 | 207 | 52000 | 298.66 | 742 | 748 | 171.6 |
| D | 13 | 189 | 151244 | 822.81 | 756 | 734 | 182.9 |
| D | 10 | 70 | 30239 | 161.3 | 756 | 734 | 182.9 |
| D | 2 | 234 | 26964 | 143.39 | 756 | 734 | 182.9 |
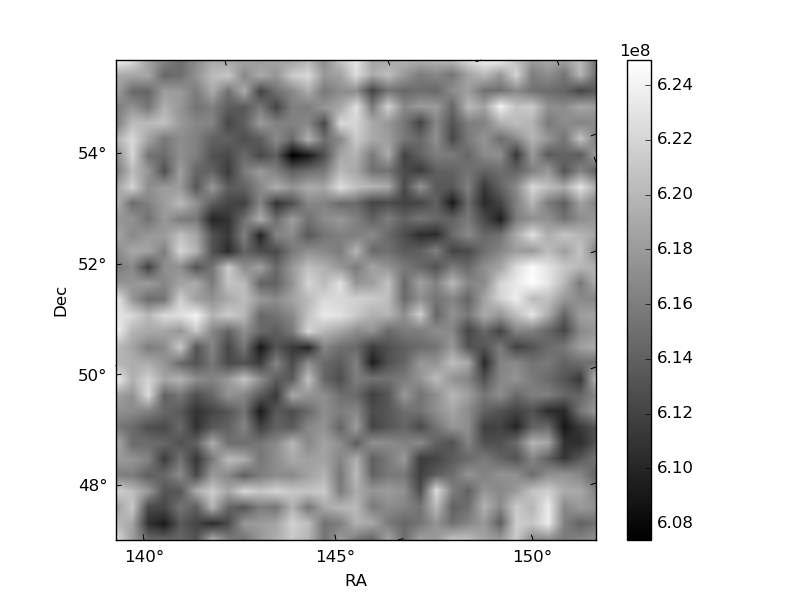
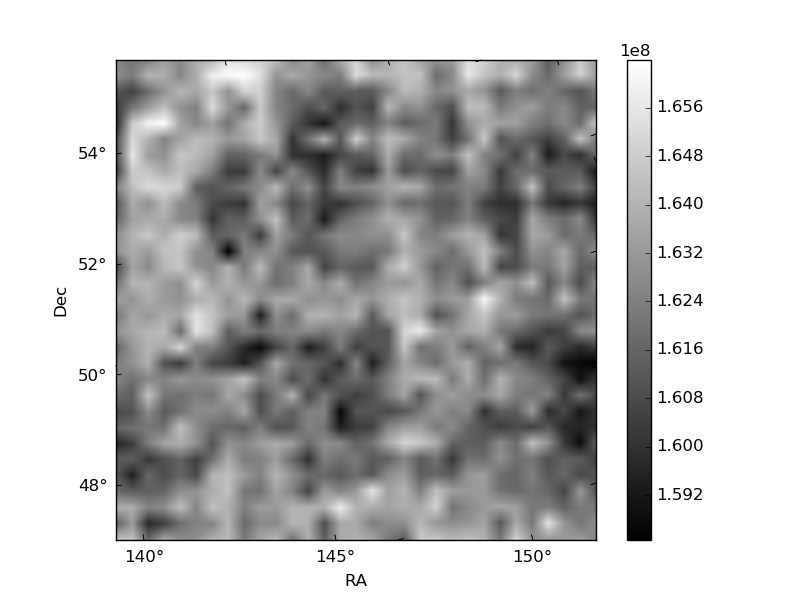
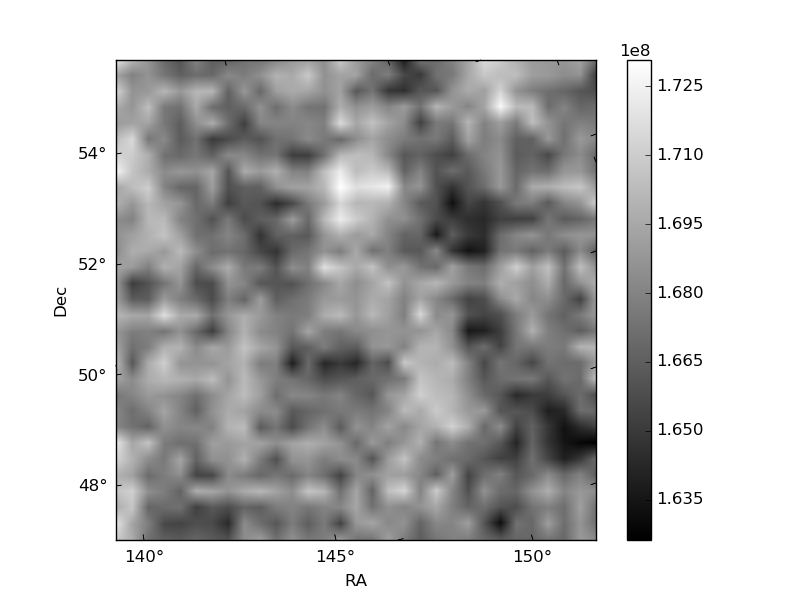
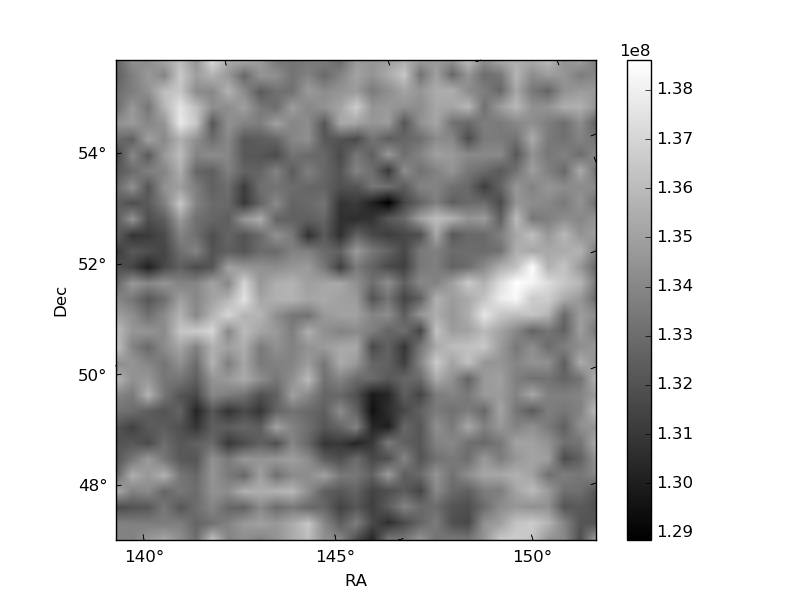
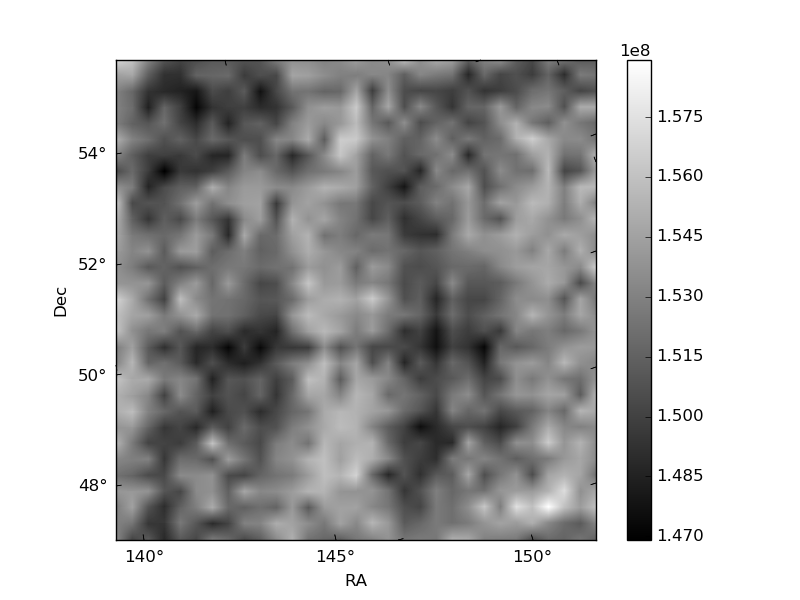
Histogram calculated using DETX and DETY for each event in the final _common_clean file
| Quadrant A | 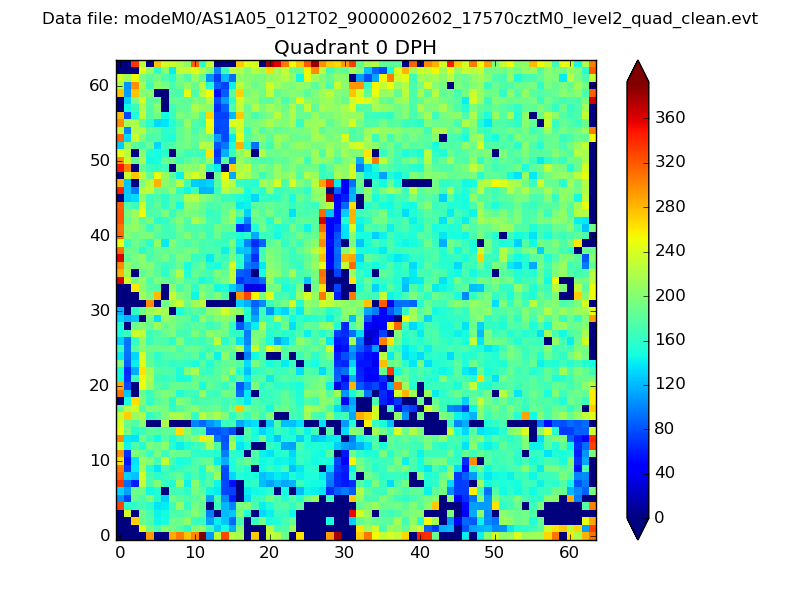 |
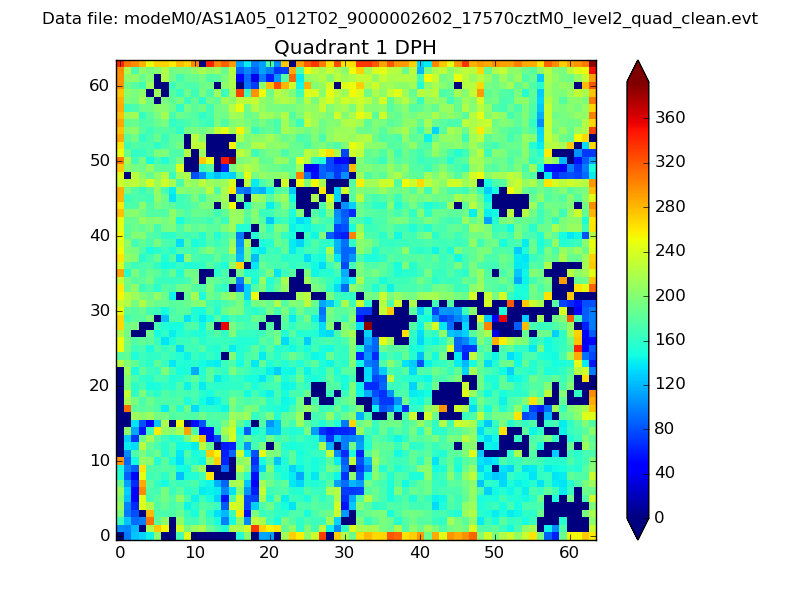 |
Quadrant B |
|---|---|---|---|
| Quadrant D | 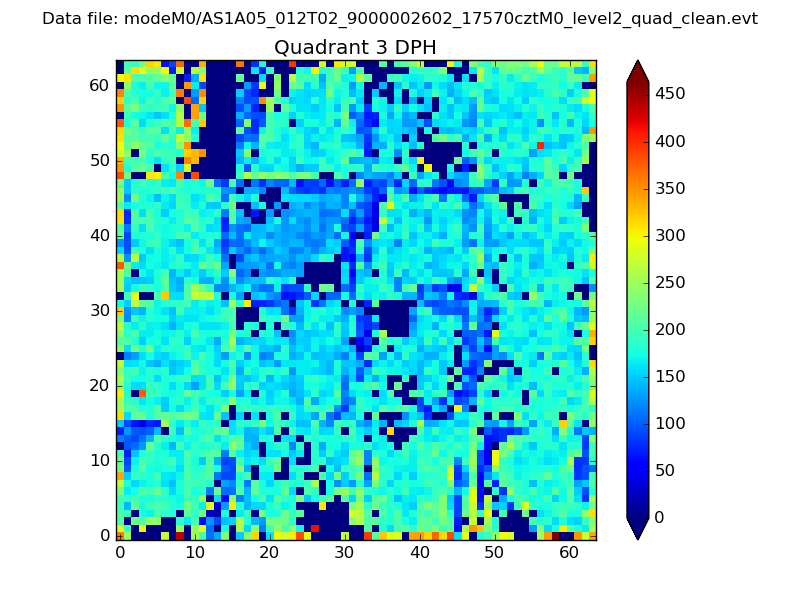 |
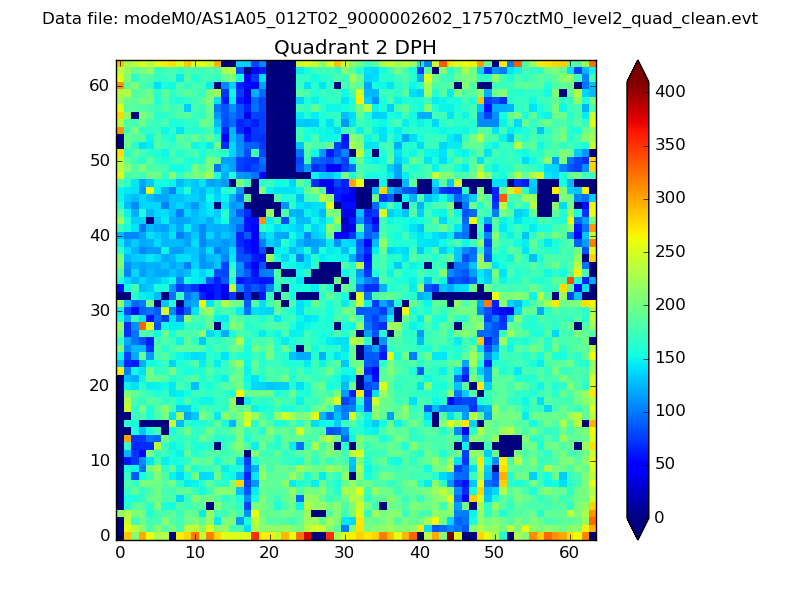 |
Quadrant C |
| Plot type | Count rate plots | Images |
|---|---|---|
| Comparison with Poisson distribution Blue bars denote a histogram of data divided into 1 sec bins. Red curve is a Poisson curve with rate = median count rate of data. |
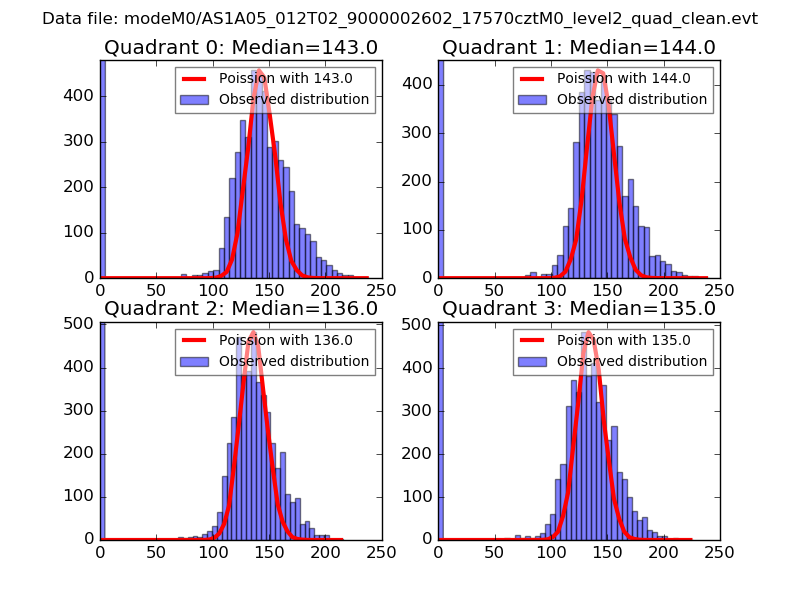 |
 |
| Quadrant-wise count rates Data is divided into 100 sec bins |
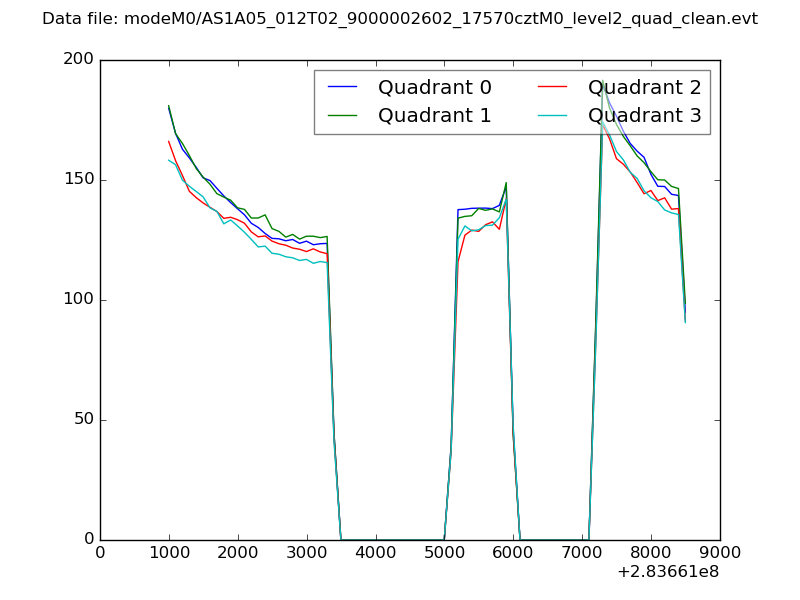 |
|
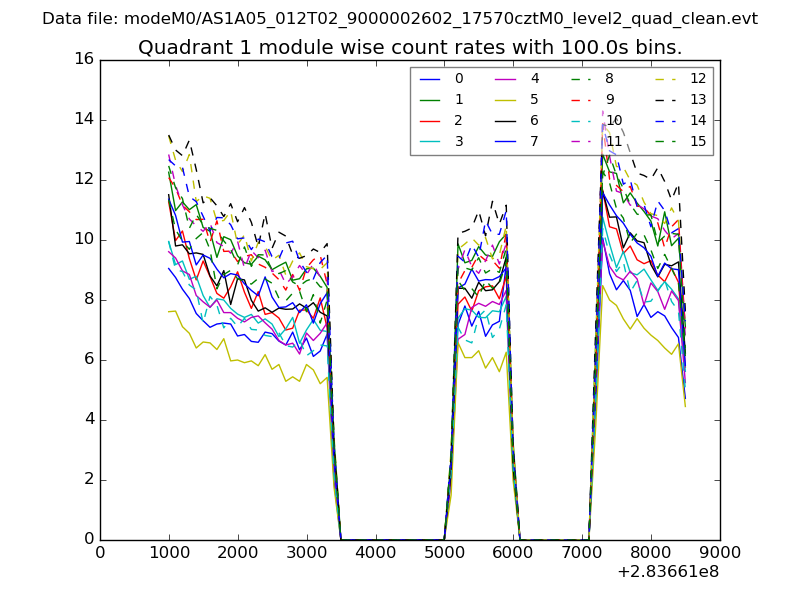
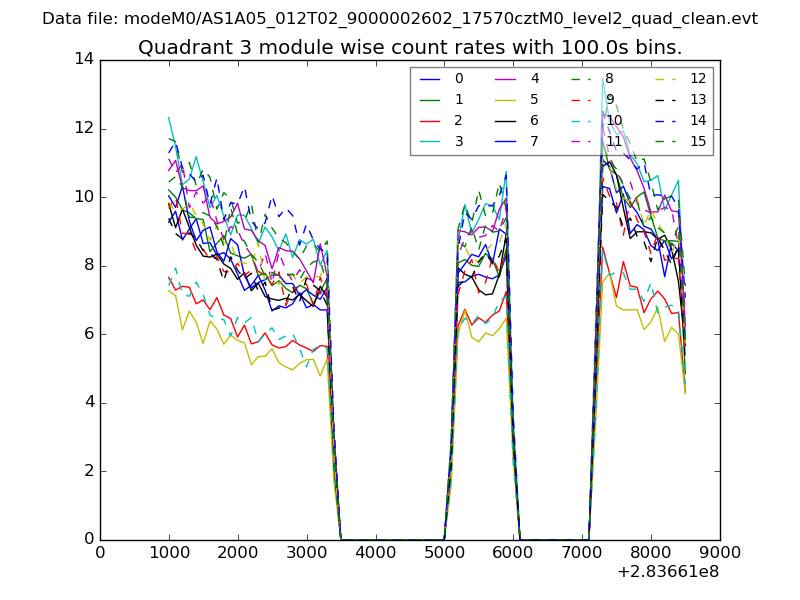
| Module-wise count rates for Quadrant A Data is divided into 100 sec bins |
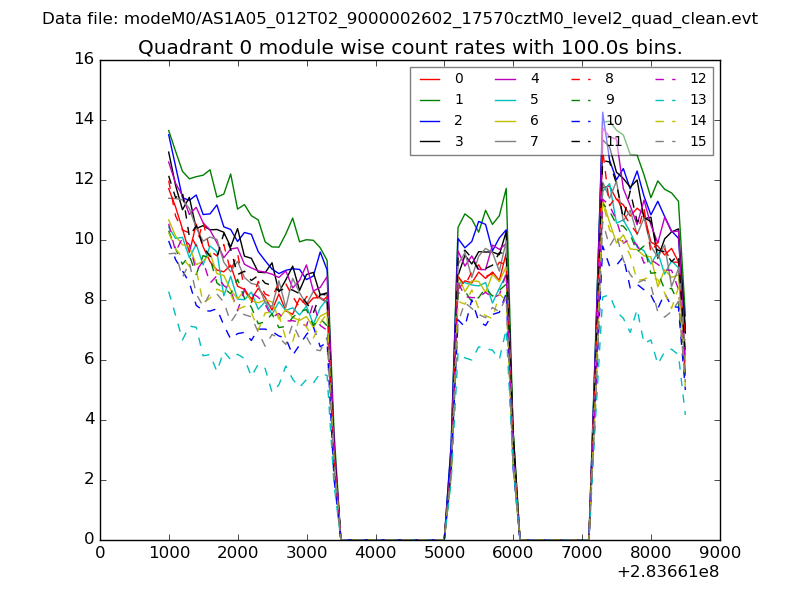 |
 |
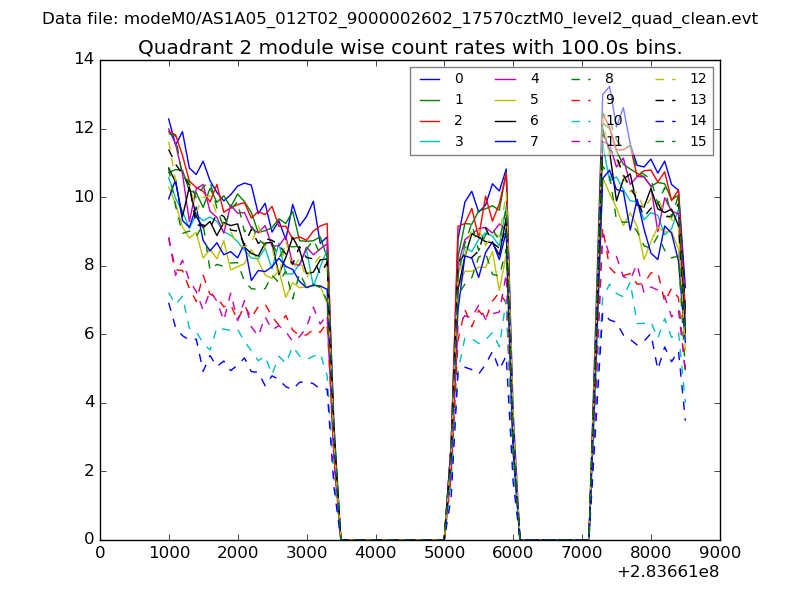
| Module-wise count rates for Quadrant B Data is divided into 100 sec bins |
 |
 |
| Module-wise count rates for Quadrant C Data is divided into 100 sec bins |
 |
 |
| Module-wise count rates for Quadrant D Data is divided into 100 sec bins |
 |
 |
| Parameter | Plot |
|---|---|
| CZT HV Monitor | 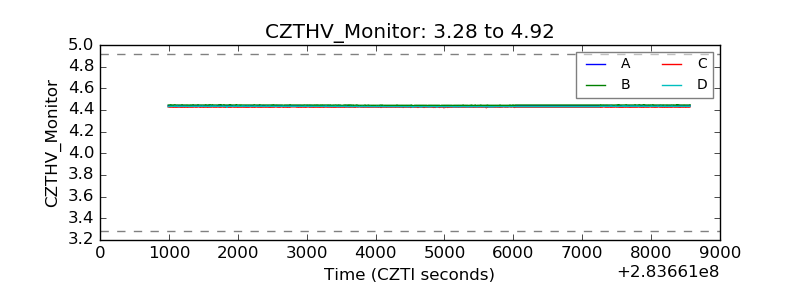 |
| D_VDD | 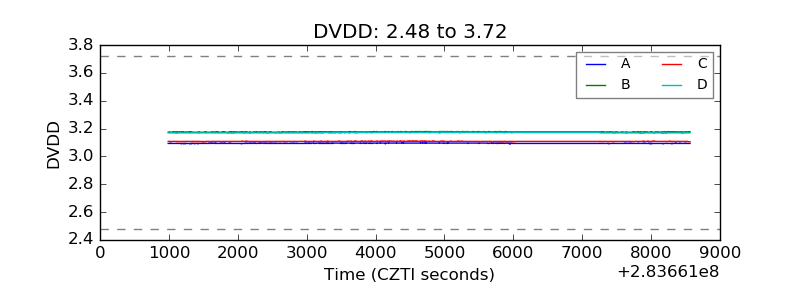 |
| Temperature 1 | 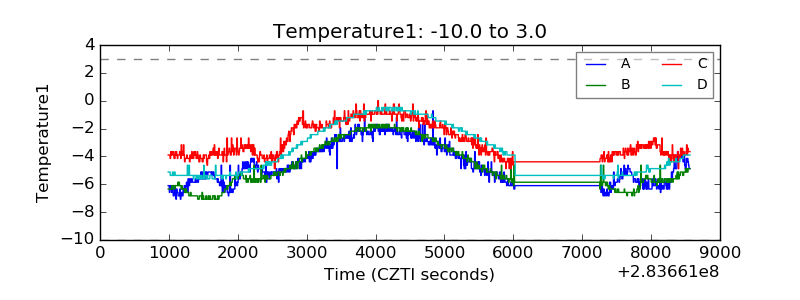 |
| Veto HV Monitor | 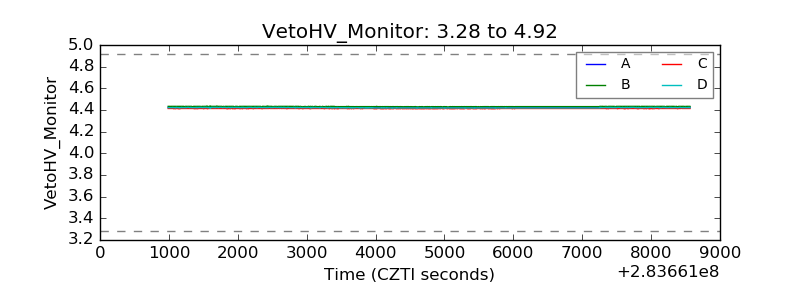 |
| Veto LLD | 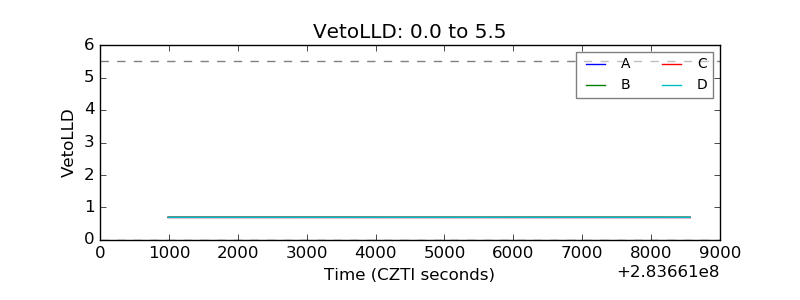 |
| Alpha Counter | 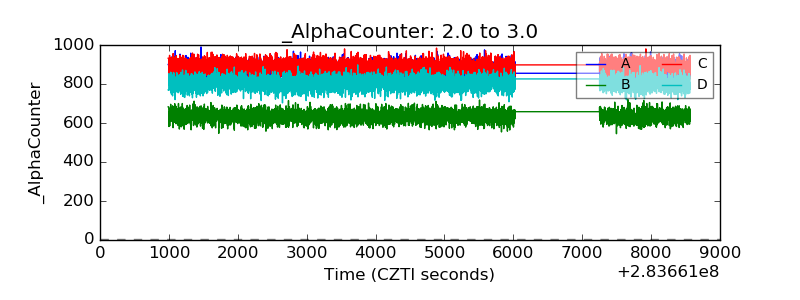 |
| _CPM_Rate | 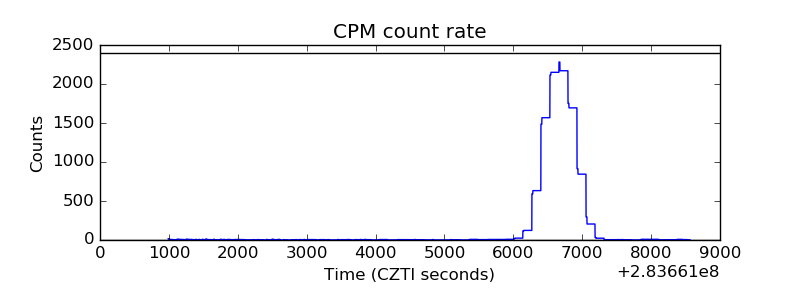 |
| CZT Counter | 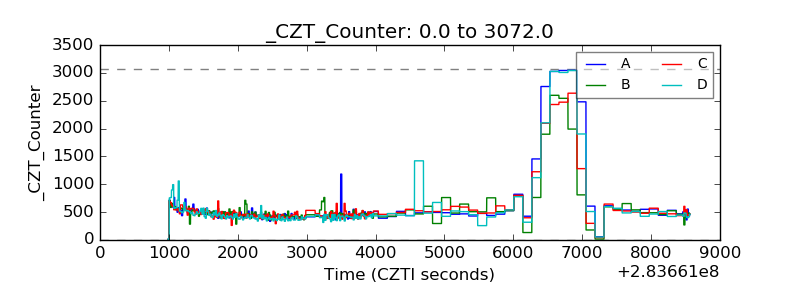 |
| +2.5 Volts monitor |  |
| +5 Volts monitor | 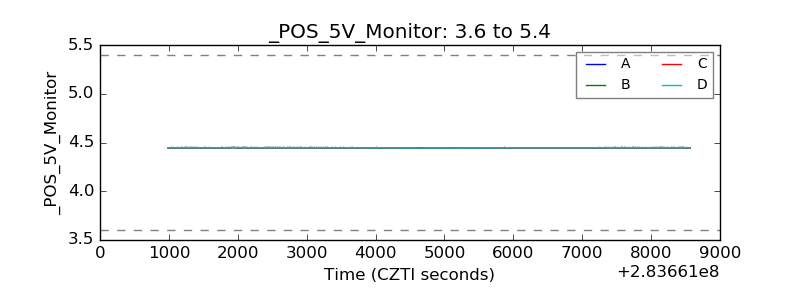 |
| _ROLL_ROT | 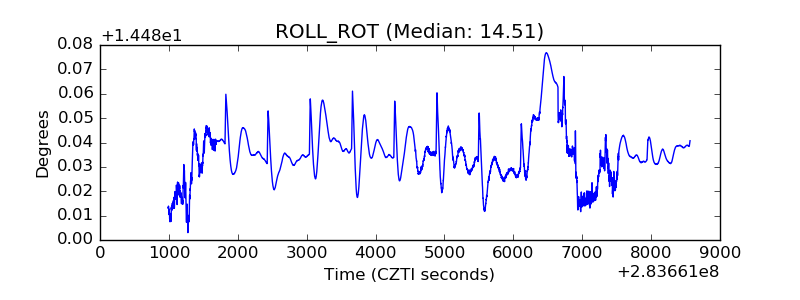 |
| _Roll_DEC | 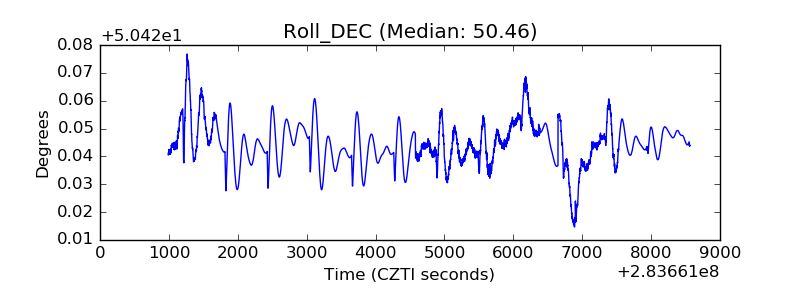 |
| _Roll_RA | 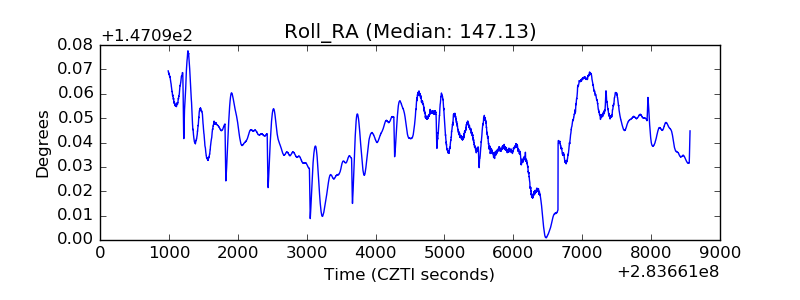 |
| Veto Counter | 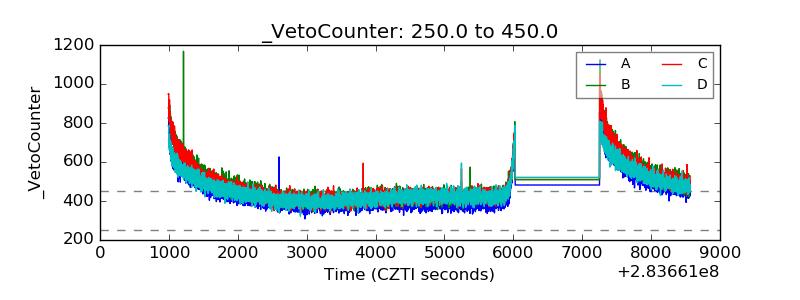 |