| Param | Original file | Final file |
|---|---|---|
| Filename | modeM0/AS1A05_012T02_9000002602_17571cztM0_level2.evt | modeM0/AS1A05_012T02_9000002602_17571cztM0_level2_quad_clean.evt |
| Size (bytes) | 1,199,479,680 | 226,941,120 |
| Size | 1.1 GB | 216.4 MB |
| Events in quadrant A | 10,281,467 | 1,477,617 |
| Events in quadrant B | 7,772,188 | 1,506,712 |
| Events in quadrant C | 7,759,204 | 1,423,303 |
| Events in quadrant D | 9,444,827 | 1,375,368 |
| Mode M0 | |||
|---|---|---|---|
| Quadrant | BADHDUFLAG | Total packets | Discarded packets |
| A | 0 | 40756 | 3 |
| B | 0 | 33071 | 3 |
| C | 0 | 32877 | 3 |
| D | 0 | 38672 | 3 |
| Mode M9 | |||
|---|---|---|---|
| Quadrant | BADHDUFLAG | Total packets | Discarded packets |
| A | 0 | 37 | 0 |
| B | 0 | 37 | 0 |
| C | 0 | 37 | 0 |
| D | 0 | 37 | 0 |
| Mode SS | |||
|---|---|---|---|
| Quadrant | BADHDUFLAG | Total packets | Discarded packets |
| A | 0 | 322 | 0 |
| B | 0 | 322 | 0 |
| C | 0 | 322 | 0 |
| D | 0 | 322 | 0 |
| Quadrant | Total seconds | Saturated seconds | Saturation percentage |
|---|---|---|---|
| A | 15805 | 1326 | 8.389750% |
| B | 15806 | 136 | 0.860433% |
| C | 15806 | 159 | 1.005947% |
| D | 15806 | 754 | 4.770340% |
Noise dominated data is calculated using 1-second bins in cleaned event files. If a bin has >2000 counts, and if more than 50% of those come from <1% of pixels, then it is considered to be noise-dominated and hence unusable.
| Quadrant | # 1 sec bins | Bins with >0 counts | Bins with >2000 counts | High rate bins dominated by noise | Noise dominated (total time) | Noise dominated (detector-on time) | Marked lightcurve |
|---|---|---|---|---|---|---|---|
| A | 19460 | 15808 | 900 | 900 | 4.62% | 5.69% | 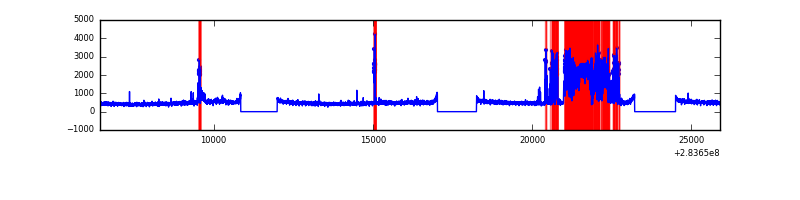 |
| B | 19461 | 15809 | 9 | 9 | 0.05% | 0.06% | 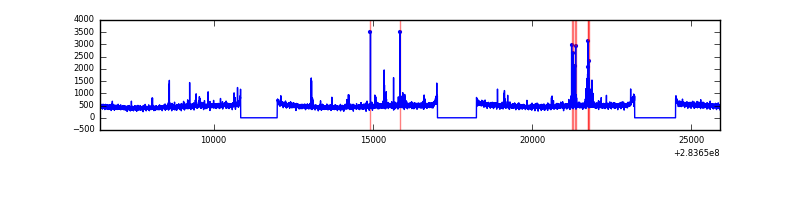 |
| C | 19461 | 15809 | 9 | 9 | 0.05% | 0.06% | 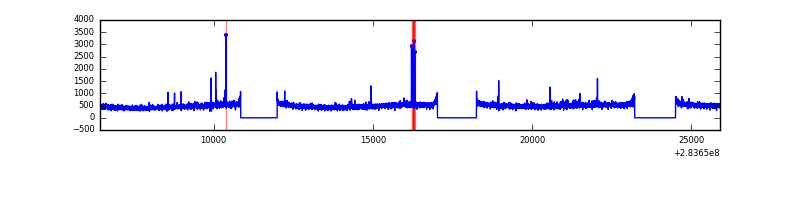 |
| D | 19461 | 15809 | 694 | 694 | 3.57% | 4.39% | 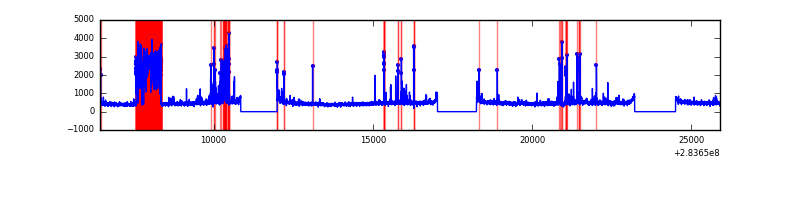 |
Top three noisy pixels from each quadrant. If the there are fewer than three noisy pixels in the level2.evt file, extra rows are filled as -1
| Pixel properties | Quadrant properties | ||||||
|---|---|---|---|---|---|---|---|
| Quadrant | DetID | PixID | Counts | Sigma | Mean | Median | Sigma |
| A | 14 | 237 | 3059793 | 8328.52 | 1855 | 1822 | 367.2 |
| A | 15 | 174 | 92172 | 246.07 | 1855 | 1822 | 367.2 |
| A | 0 | 226 | 16379 | 39.65 | 1855 | 1822 | 367.2 |
| B | 4 | 216 | 72512 | 197.11 | 1933 | 1887 | 358.3 |
| B | 7 | 220 | 71056 | 193.04 | 1933 | 1887 | 358.3 |
| B | 12 | 111 | 41909 | 111.7 | 1933 | 1887 | 358.3 |
| C | 14 | 238 | 290819 | 691.09 | 1831 | 1837 | 418.2 |
| C | 3 | 233 | 190490 | 451.16 | 1831 | 1837 | 418.2 |
| C | 0 | 207 | 92668 | 217.22 | 1831 | 1837 | 418.2 |
| D | 12 | 227 | 1663014 | 3781.31 | 1846 | 1792 | 439.3 |
| D | 13 | 189 | 520248 | 1180.12 | 1846 | 1792 | 439.3 |
| D | 1 | 52 | 87929 | 196.07 | 1846 | 1792 | 439.3 |
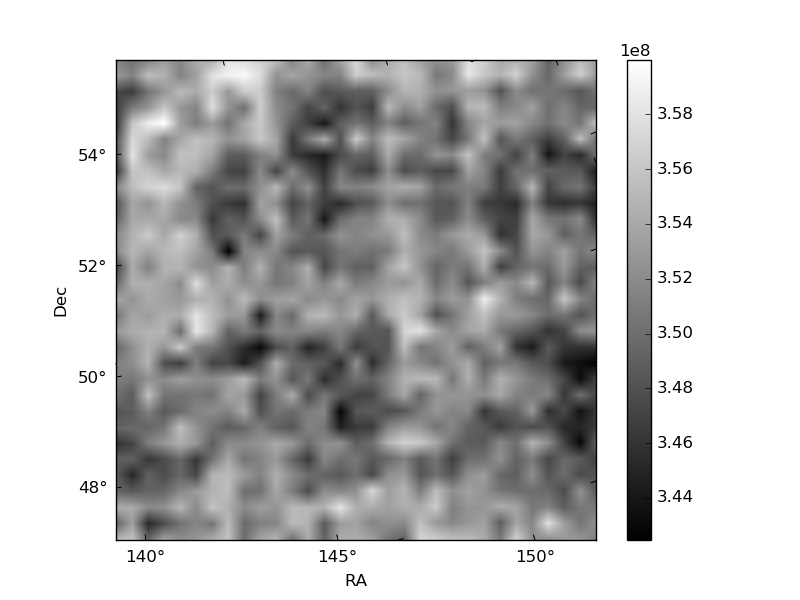
Histogram calculated using DETX and DETY for each event in the final _common_clean file
| Quadrant A |  |
 |
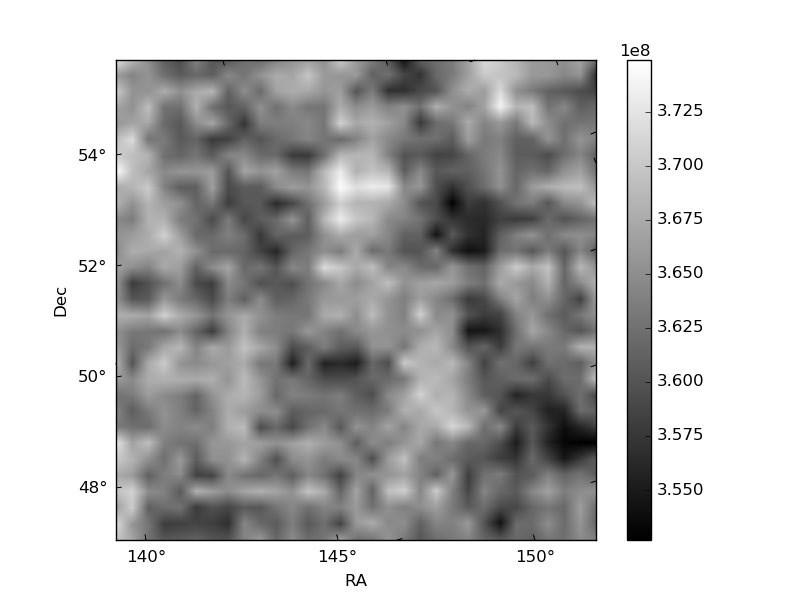
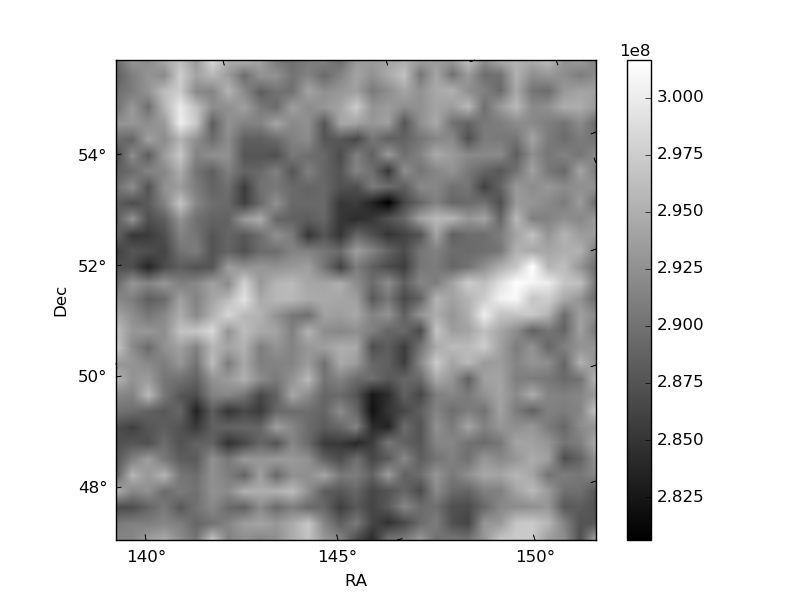
Quadrant B |
|---|---|---|---|
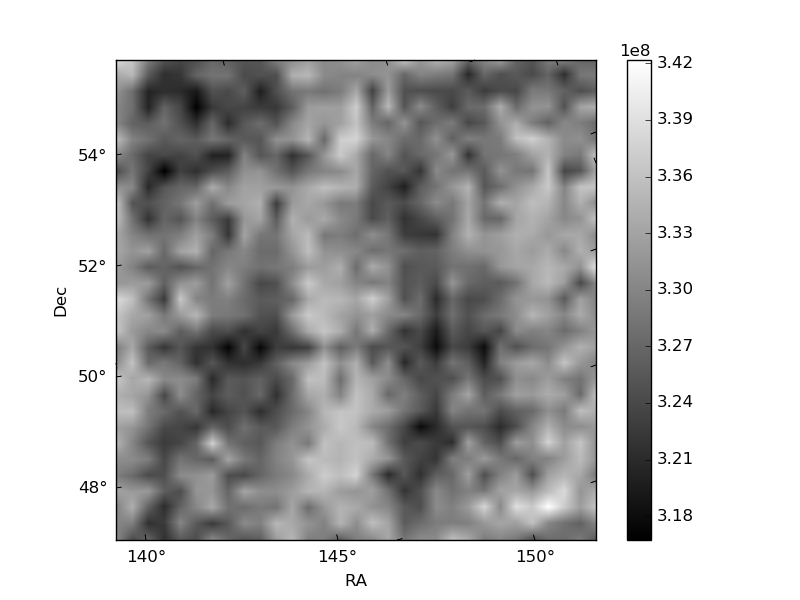
| Quadrant D |  |
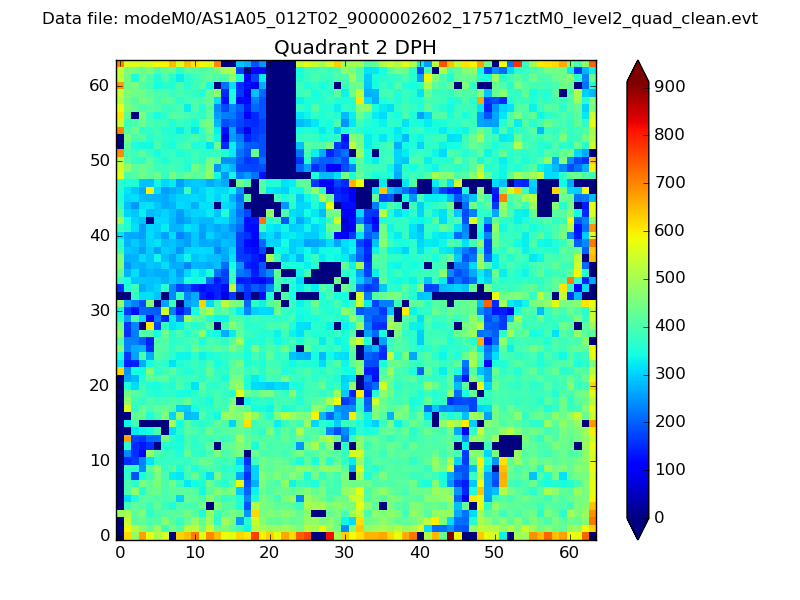 |
Quadrant C |
| Plot type | Count rate plots | Images |
|---|---|---|
| Comparison with Poisson distribution Blue bars denote a histogram of data divided into 1 sec bins. Red curve is a Poisson curve with rate = median count rate of data. |
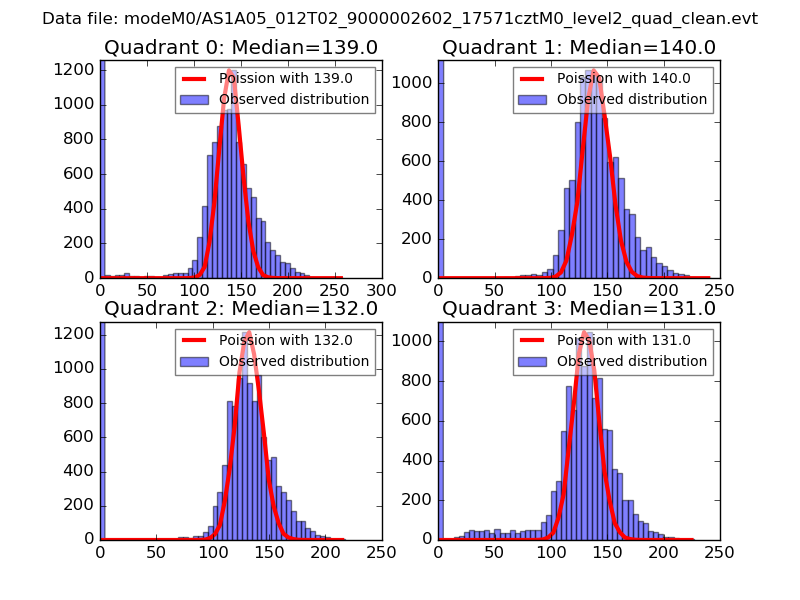 |
 |
| Quadrant-wise count rates Data is divided into 100 sec bins |
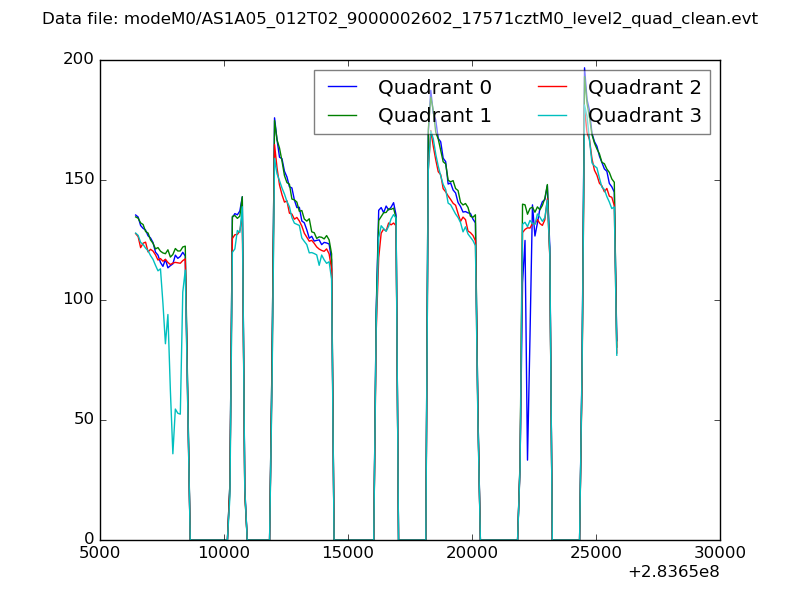 |
|
| Module-wise count rates for Quadrant A Data is divided into 100 sec bins |
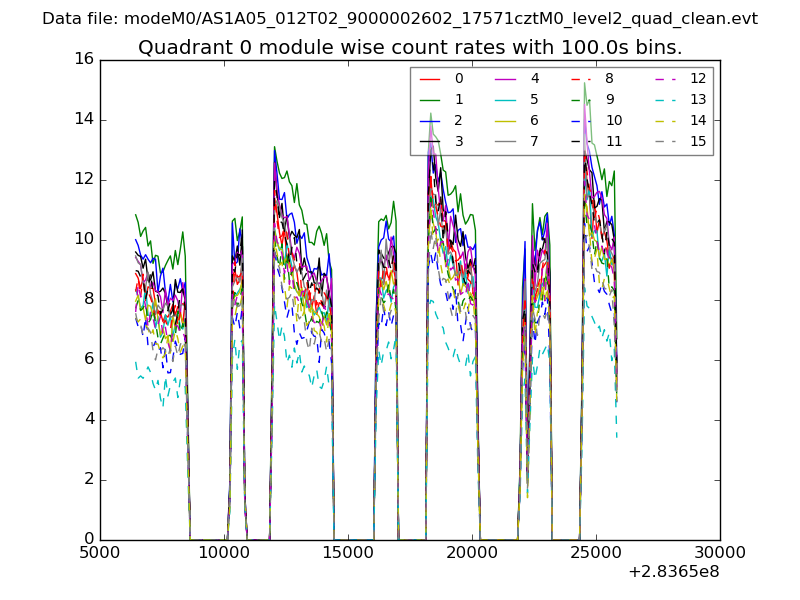 |
 |
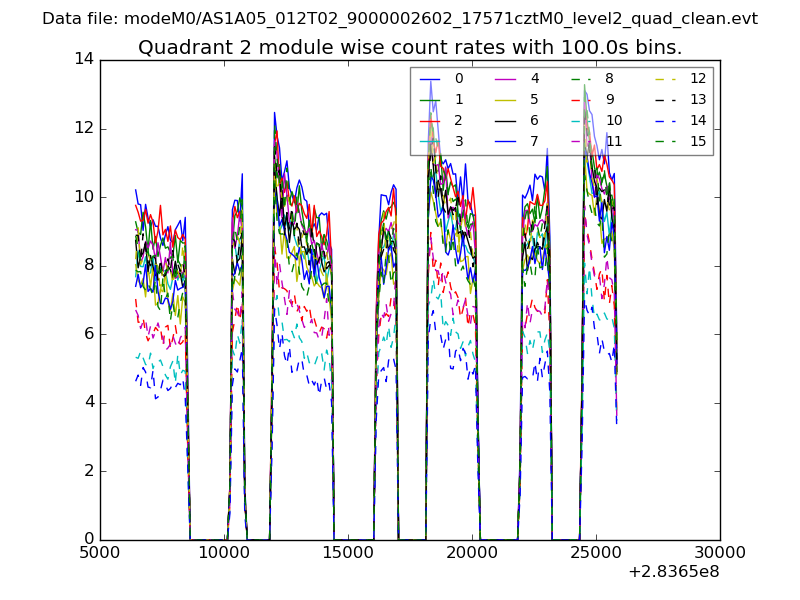
| Module-wise count rates for Quadrant B Data is divided into 100 sec bins |
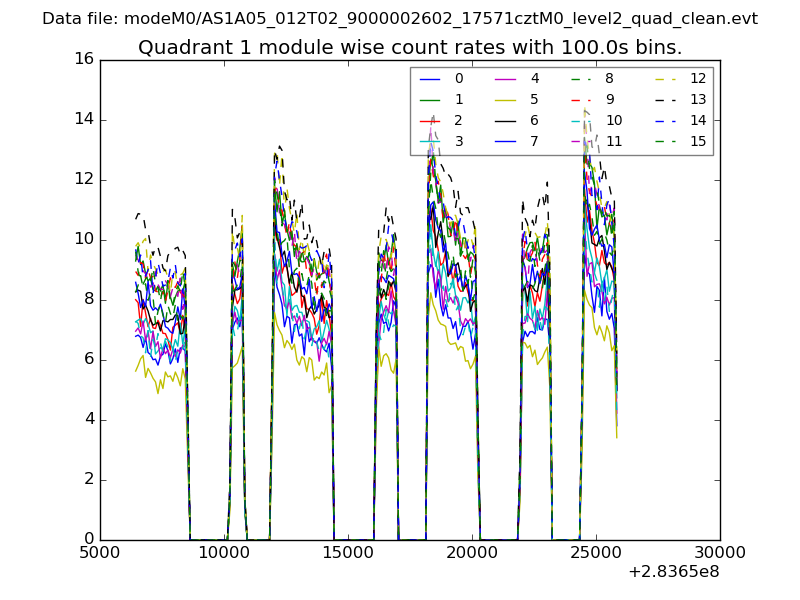 |
 |
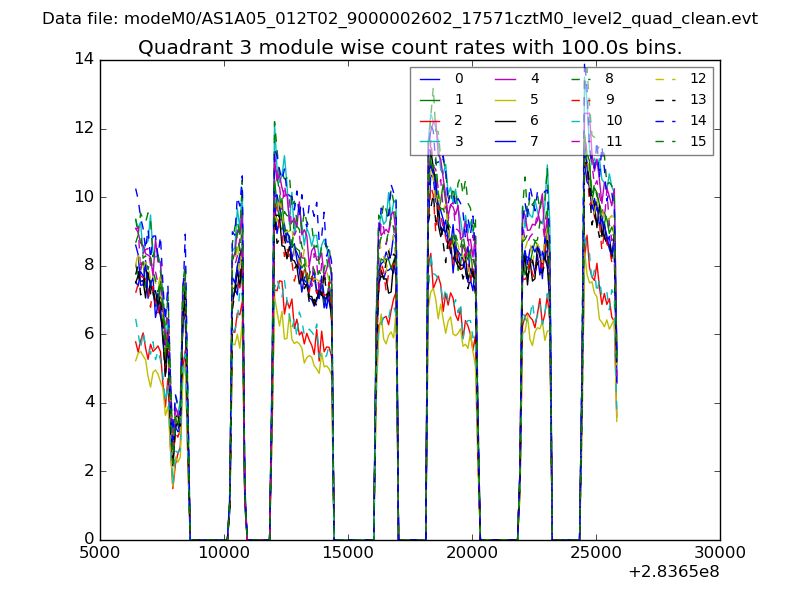
| Module-wise count rates for Quadrant C Data is divided into 100 sec bins |
 |
 |
| Module-wise count rates for Quadrant D Data is divided into 100 sec bins |
 |
 |
| Parameter | Plot |
|---|---|
| CZT HV Monitor | 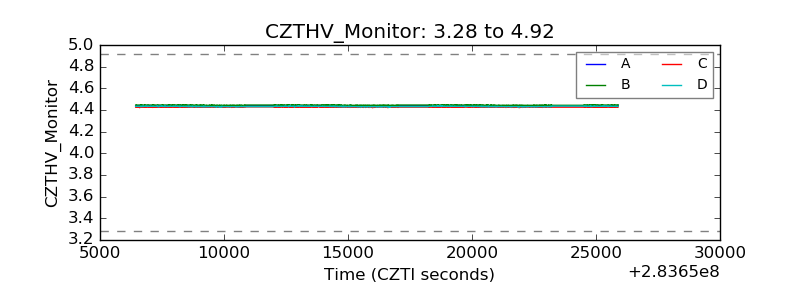 |
| D_VDD | 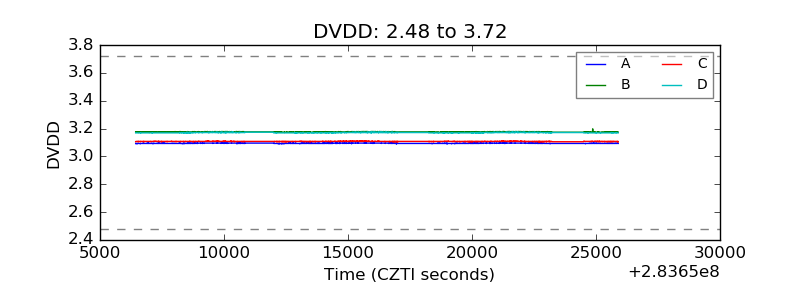 |
| Temperature 1 | 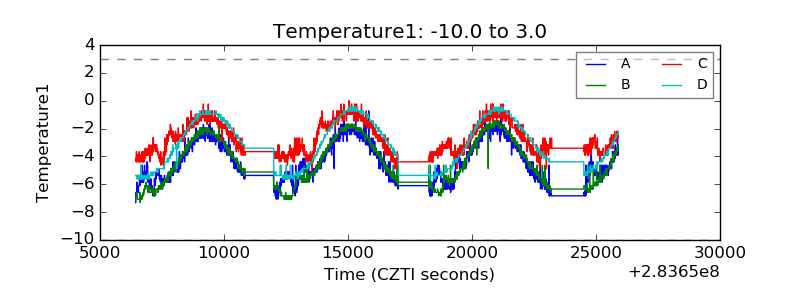 |
| Veto HV Monitor | 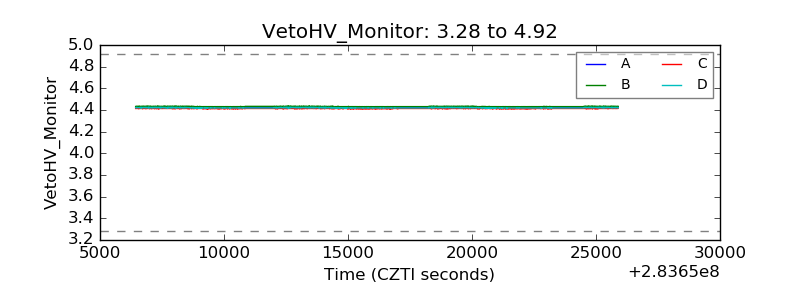 |
| Veto LLD | 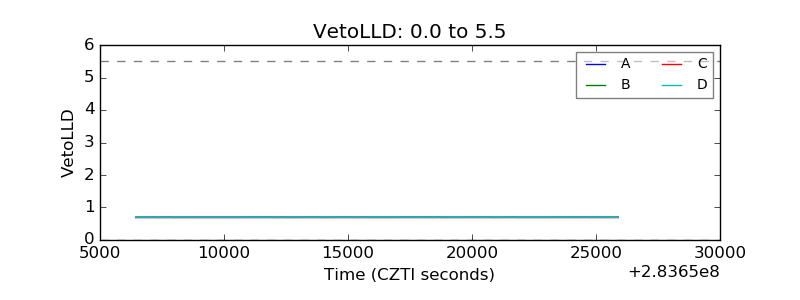 |
| Alpha Counter | 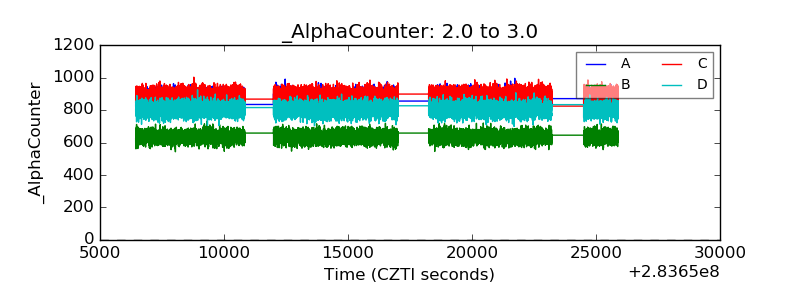 |
| _CPM_Rate | 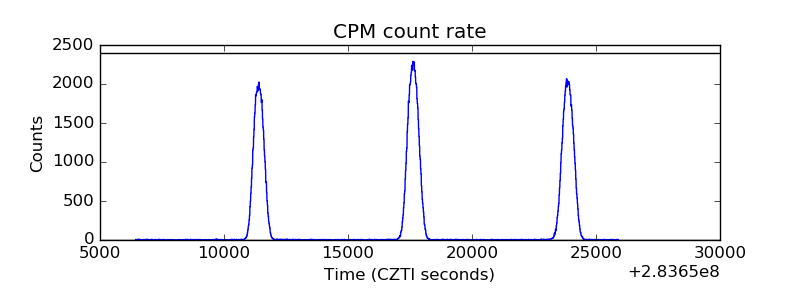 |
| CZT Counter | 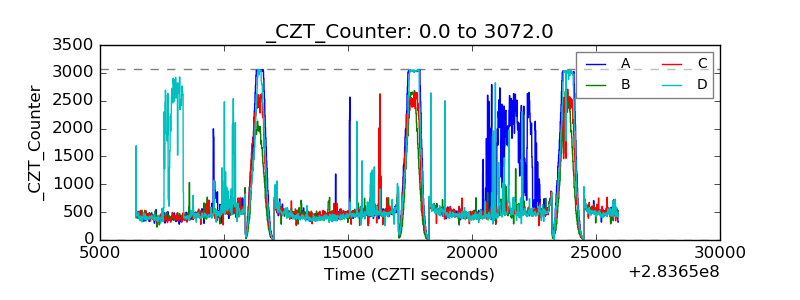 |
| +2.5 Volts monitor |  |
| +5 Volts monitor | 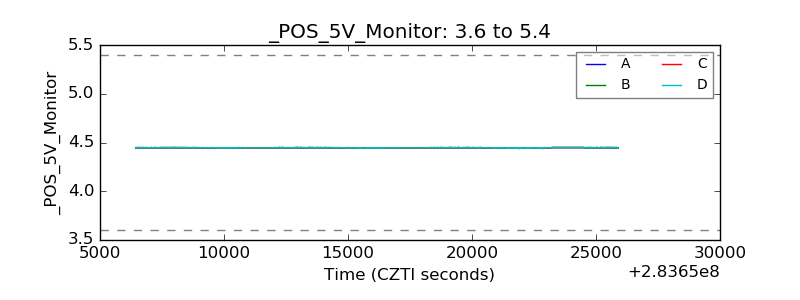 |
| _ROLL_ROT | 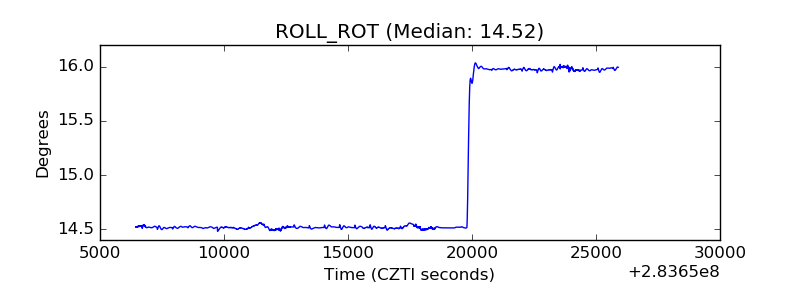 |
| _Roll_DEC | 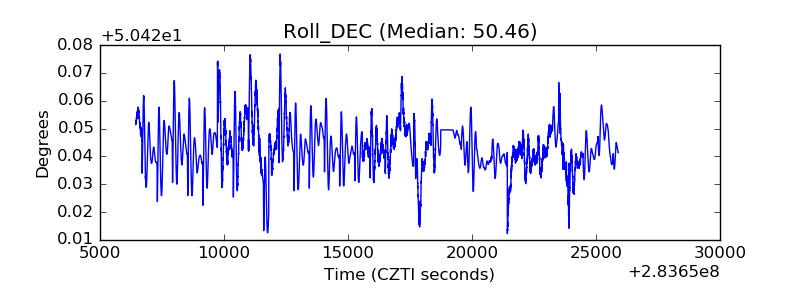 |
| _Roll_RA | 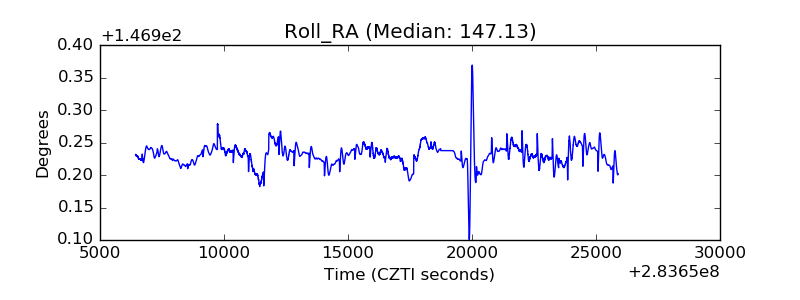 |
| Veto Counter | 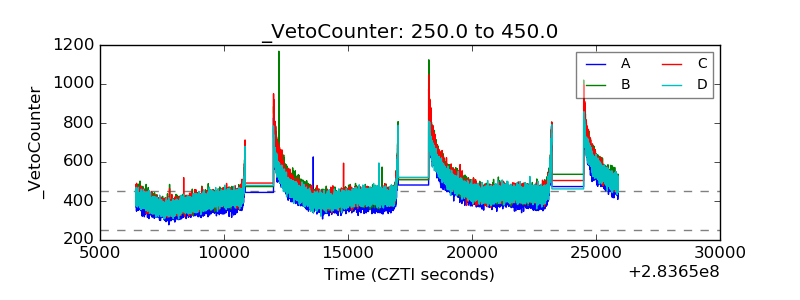 |