| Param | Original file | Final file |
|---|---|---|
| Filename | modeM0/AS1A05_012T02_9000002602_17573cztM0_level2.evt | modeM0/AS1A05_012T02_9000002602_17573cztM0_level2_quad_clean.evt |
| Size (bytes) | 408,651,840 | 53,308,800 |
| Size | 389.7 MB | 50.8 MB |
| Events in quadrant A | 5,539,123 | 334,090 |
| Events in quadrant B | 2,139,525 | 343,412 |
| Events in quadrant C | 2,012,668 | 325,136 |
| Events in quadrant D | 2,407,310 | 323,936 |
| Mode M0 | |||
|---|---|---|---|
| Quadrant | BADHDUFLAG | Total packets | Discarded packets |
| A | 0 | 19271 | 1 |
| B | 0 | 8765 | 1 |
| C | 0 | 8296 | 1 |
| D | 0 | 9750 | 1 |
| Mode M9 | |||
|---|---|---|---|
| Quadrant | BADHDUFLAG | Total packets | Discarded packets |
| A | 0 | 1 | 0 |
| B | 0 | 2 | 0 |
| C | 0 | 2 | 0 |
| D | 0 | 2 | 0 |
| Mode SS | |||
|---|---|---|---|
| Quadrant | BADHDUFLAG | Total packets | Discarded packets |
| A | 0 | 82 | 0 |
| B | 0 | 82 | 0 |
| C | 0 | 82 | 0 |
| D | 0 | 82 | 0 |
| Quadrant | Total seconds | Saturated seconds | Saturation percentage |
|---|---|---|---|
| A | 4073 | 1504 | 36.926099% |
| B | 4073 | 43 | 1.055733% |
| C | 4073 | 16 | 0.392831% |
| D | 4073 | 29 | 0.712006% |
Noise dominated data is calculated using 1-second bins in cleaned event files. If a bin has >2000 counts, and if more than 50% of those come from <1% of pixels, then it is considered to be noise-dominated and hence unusable.
| Quadrant | # 1 sec bins | Bins with >0 counts | Bins with >2000 counts | High rate bins dominated by noise | Noise dominated (total time) | Noise dominated (detector-on time) | Marked lightcurve |
|---|---|---|---|---|---|---|---|
| A | 4073 | 4073 | 1324 | 1324 | 32.51% | 32.51% | 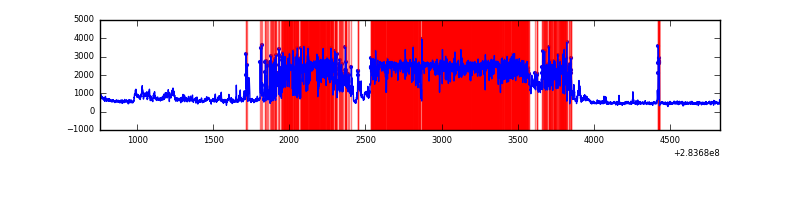 |
| B | 4073 | 4073 | 19 | 19 | 0.47% | 0.47% | 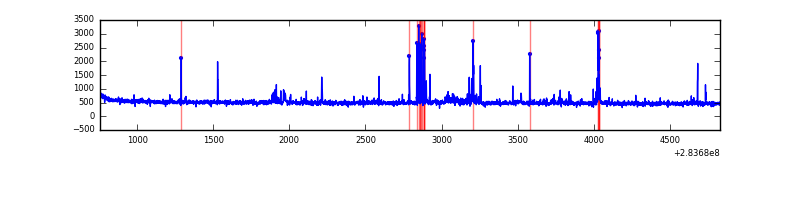 |
| C | 4073 | 4073 | 0 | 0 | 0.00% | 0.00% | 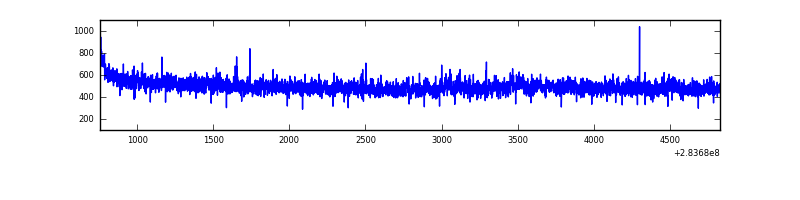 |
| D | 4073 | 4073 | 25 | 25 | 0.61% | 0.61% | 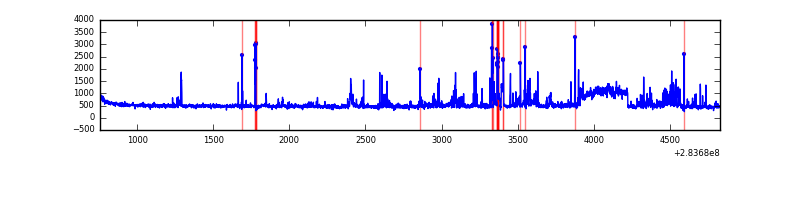 |
Top three noisy pixels from each quadrant. If the there are fewer than three noisy pixels in the level2.evt file, extra rows are filled as -1
| Pixel properties | Quadrant properties | ||||||
|---|---|---|---|---|---|---|---|
| Quadrant | DetID | PixID | Counts | Sigma | Mean | Median | Sigma |
| A | 14 | 237 | 3802457 | 43847.99 | 436 | 428 | 86.7 |
| A | 15 | 174 | 59604 | 682.46 | 436 | 428 | 86.7 |
| A | 0 | 226 | 3887 | 39.89 | 436 | 428 | 86.7 |
| B | 7 | 220 | 110569 | 1166.72 | 503 | 493 | 94.3 |
| B | 0 | 230 | 17887 | 184.36 | 503 | 493 | 94.3 |
| B | 12 | 111 | 10434 | 105.37 | 503 | 493 | 94.3 |
| C | 14 | 238 | 75681 | 679.38 | 479 | 481 | 110.7 |
| C | 3 | 233 | 41942 | 374.57 | 479 | 481 | 110.7 |
| C | 5 | 218 | 16440 | 144.18 | 479 | 481 | 110.7 |
| D | 15 | 0 | 236274 | 1966.54 | 493 | 479 | 119.9 |
| D | 13 | 189 | 180563 | 1501.91 | 493 | 479 | 119.9 |
| D | 12 | 233 | 48302 | 398.85 | 493 | 479 | 119.9 |
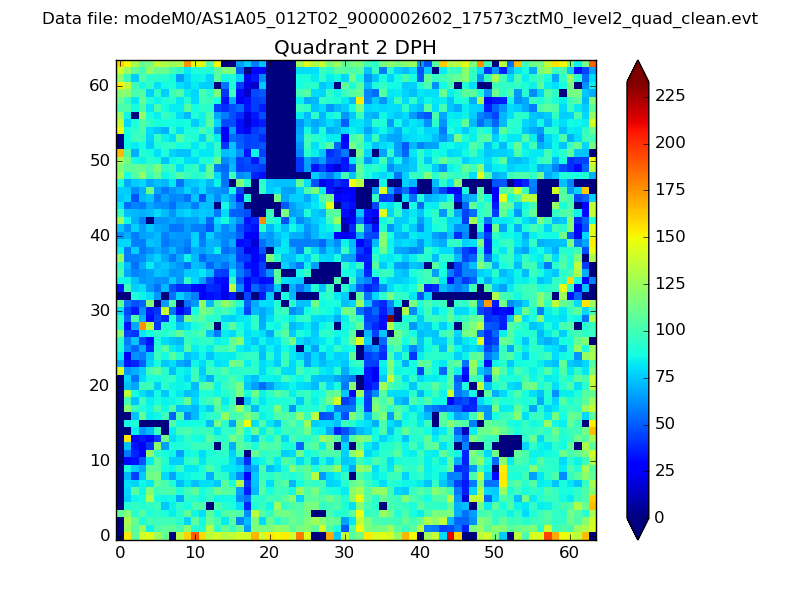
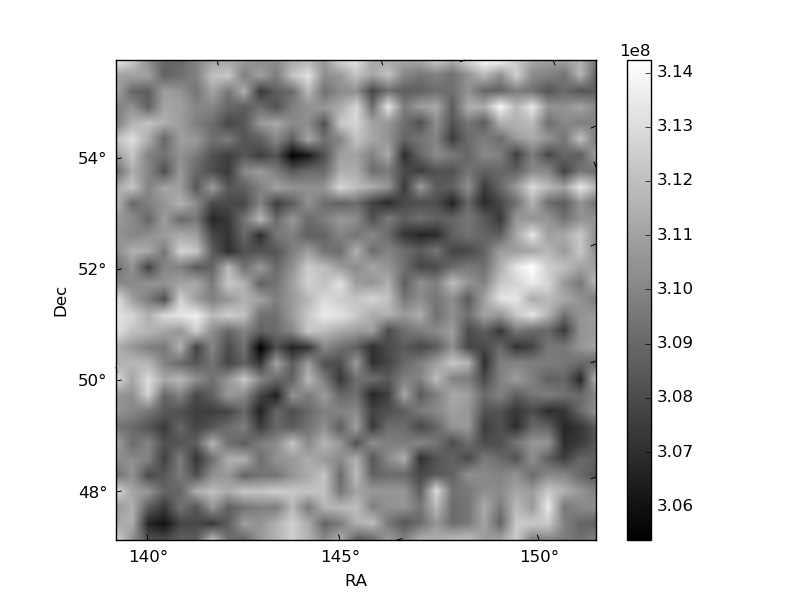
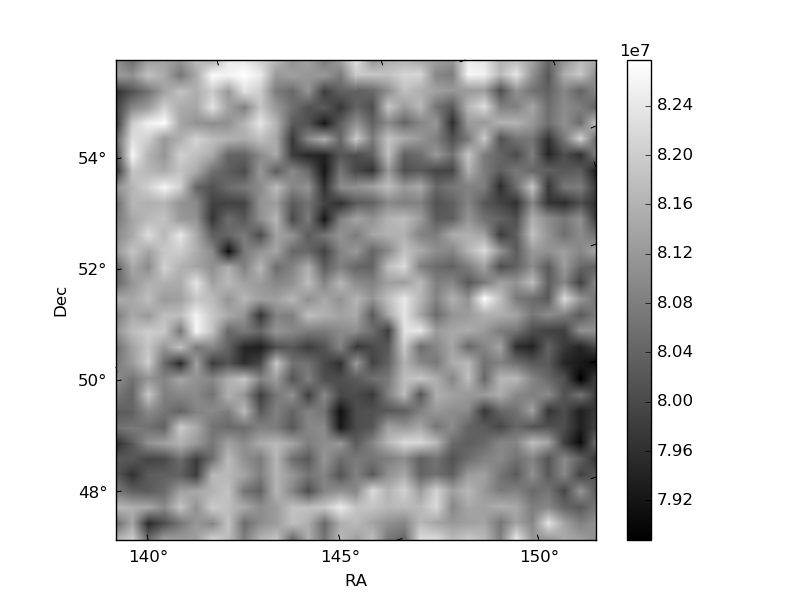
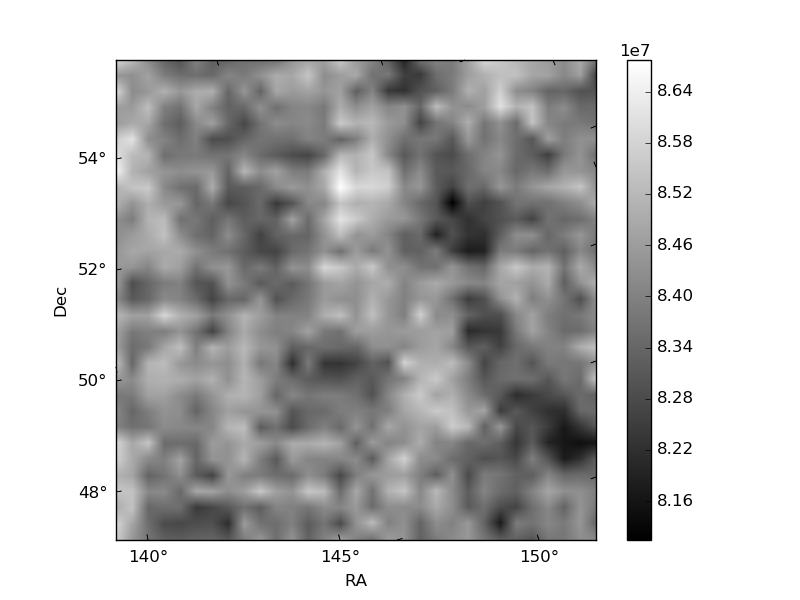
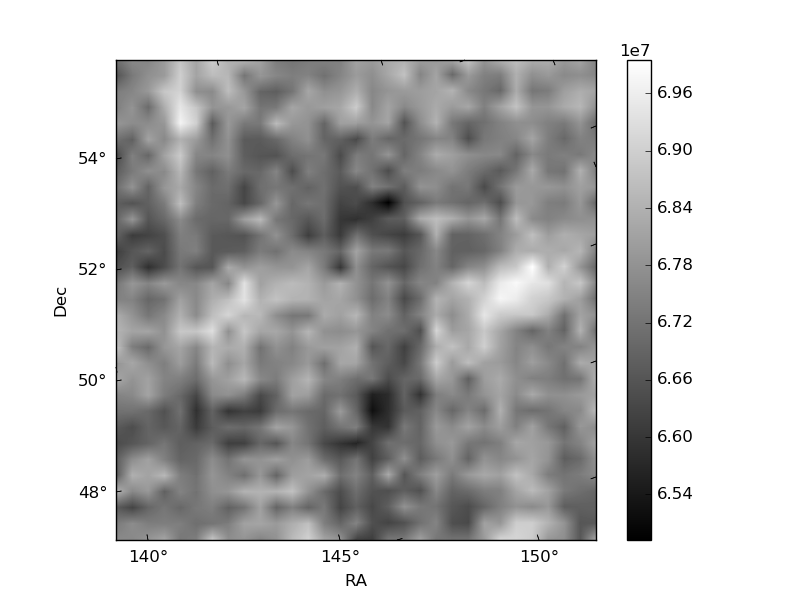
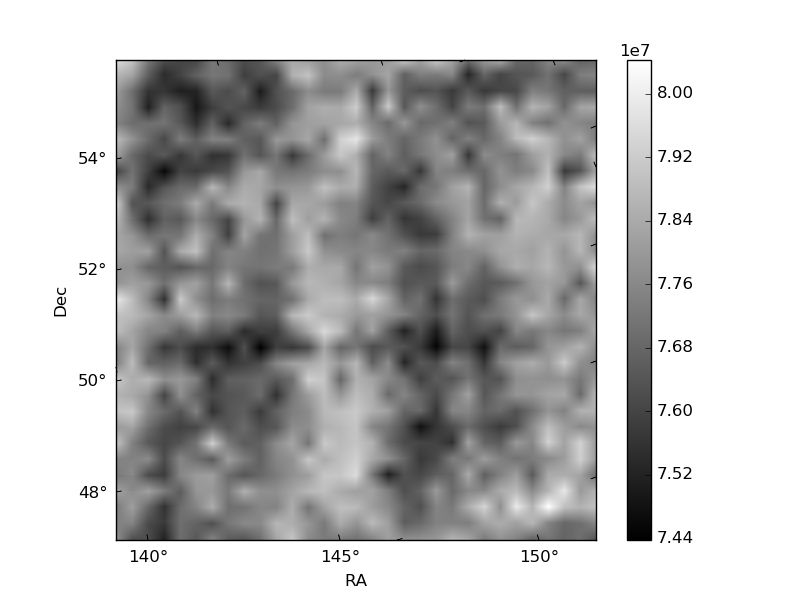
Histogram calculated using DETX and DETY for each event in the final _common_clean file
| Quadrant A | 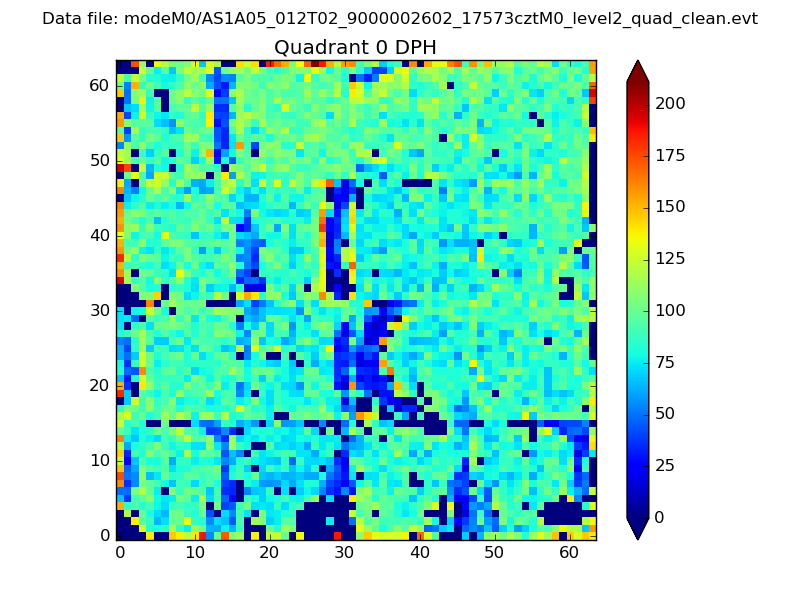 |
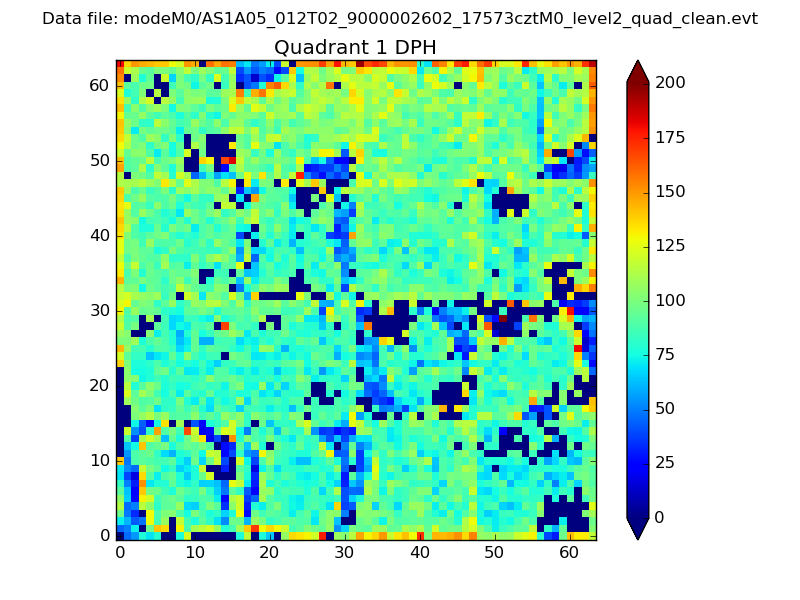 |
Quadrant B |
|---|---|---|---|
| Quadrant D | 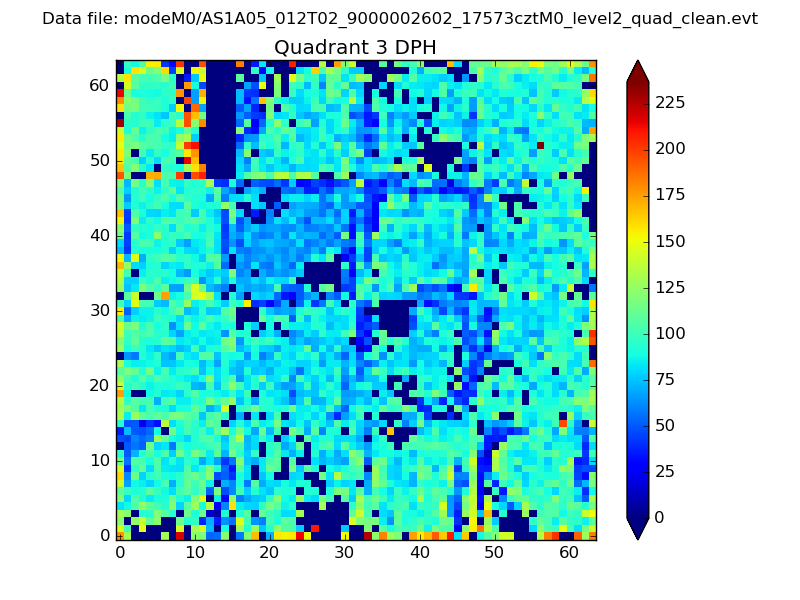 |
 |
Quadrant C |
| Plot type | Count rate plots | Images |
|---|---|---|
| Comparison with Poisson distribution Blue bars denote a histogram of data divided into 1 sec bins. Red curve is a Poisson curve with rate = median count rate of data. |
 |
 |
| Quadrant-wise count rates Data is divided into 100 sec bins |
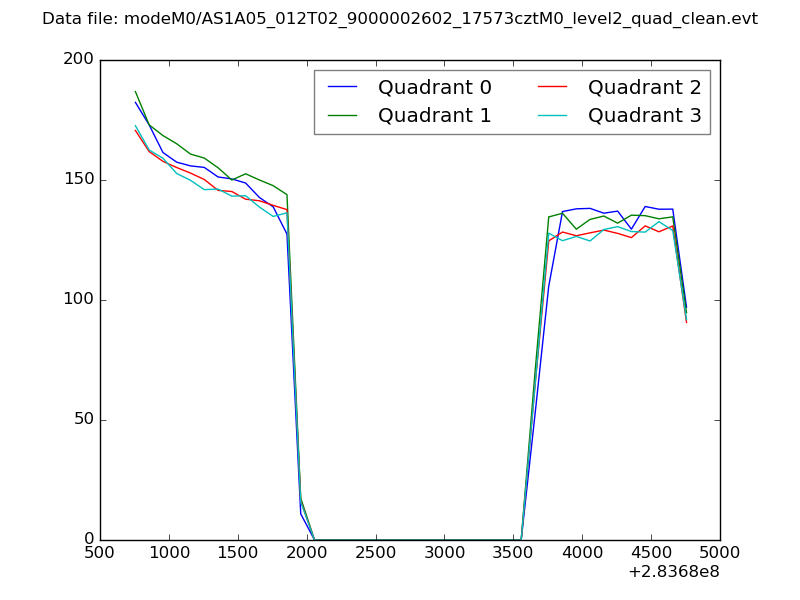 |
|
| Module-wise count rates for Quadrant A Data is divided into 100 sec bins |
 |
 |
| Module-wise count rates for Quadrant B Data is divided into 100 sec bins |
 |
 |
| Module-wise count rates for Quadrant C Data is divided into 100 sec bins |
 |
 |
| Module-wise count rates for Quadrant D Data is divided into 100 sec bins |
 |
 |
| Parameter | Plot |
|---|---|
| CZT HV Monitor |  |
| D_VDD | 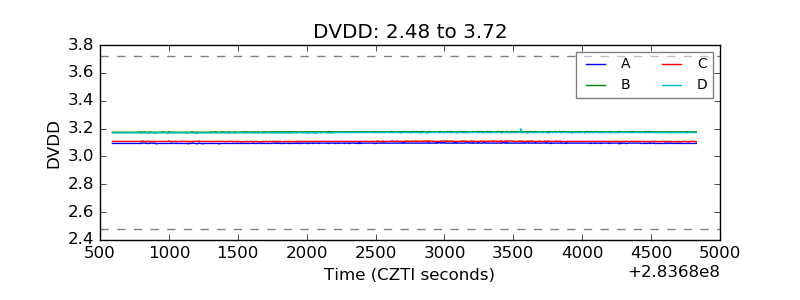 |
| Temperature 1 | 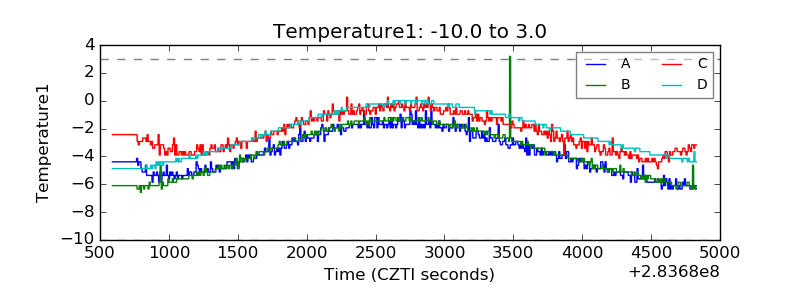 |
| Veto HV Monitor | 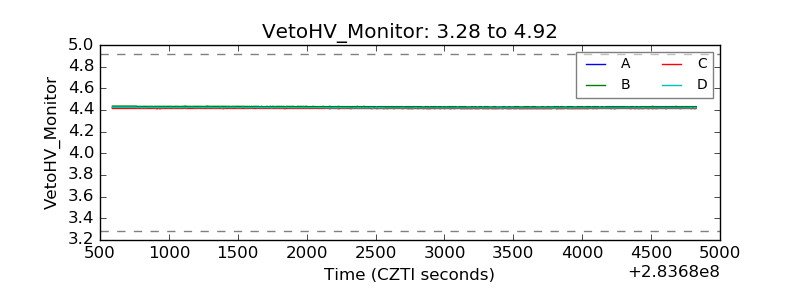 |
| Veto LLD |  |
| Alpha Counter | 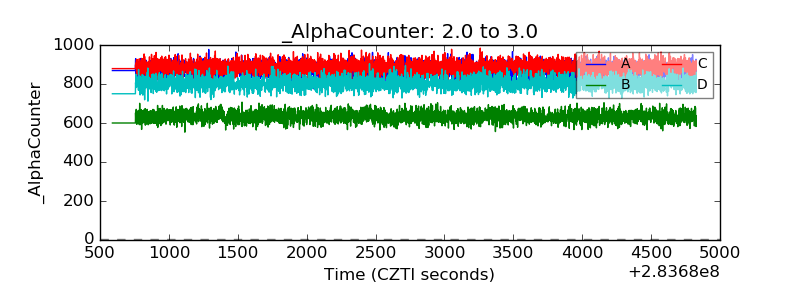 |
| _CPM_Rate | 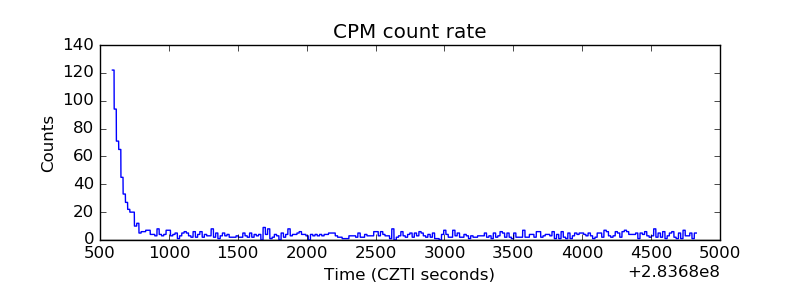 |
| CZT Counter | 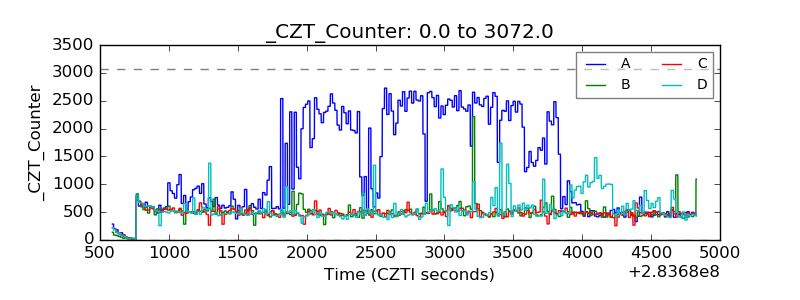 |
| +2.5 Volts monitor |  |
| +5 Volts monitor | 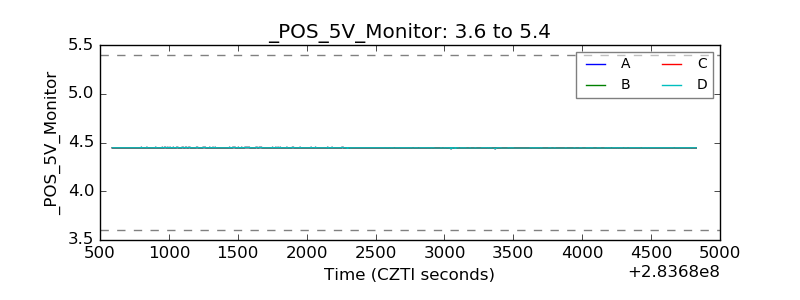 |
| _ROLL_ROT | 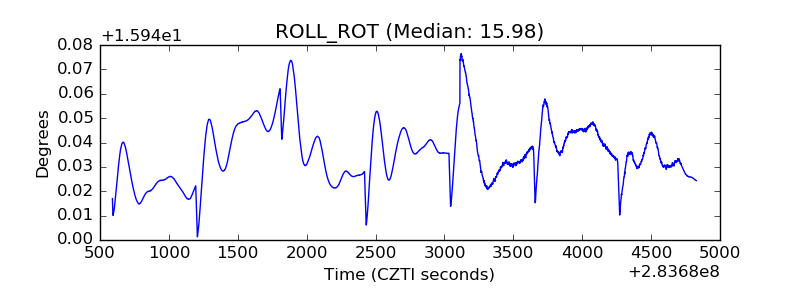 |
| _Roll_DEC | 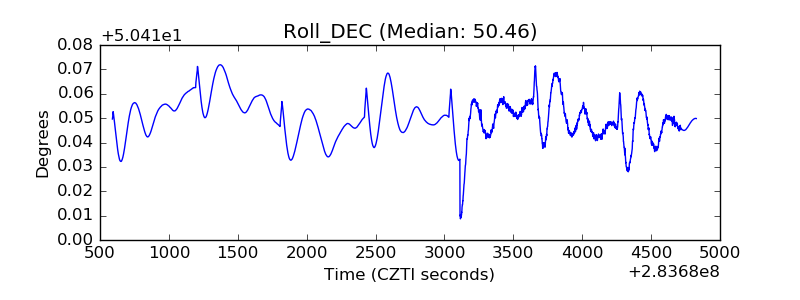 |
| _Roll_RA | 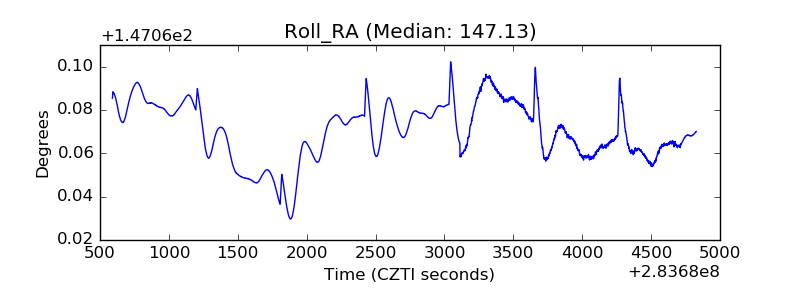 |
| Veto Counter |  |