| Param | Original file | Final file |
|---|---|---|
| Filename | modeM0/AS1A05_056T01_9000002604_17573cztM0_level2.evt | modeM0/AS1A05_056T01_9000002604_17573cztM0_level2_quad_clean.evt |
| Size (bytes) | 93,841,920 | 3,833,280 |
| Size | 89.5 MB | 3.7 MB |
| Events in quadrant A | 692,521 | 4,886 |
| Events in quadrant B | 692,880 | 5,060 |
| Events in quadrant C | 700,741 | 4,921 |
| Events in quadrant D | 666,335 | 4,824 |
| Mode M9 | |||
|---|---|---|---|
| Quadrant | BADHDUFLAG | Total packets | Discarded packets |
| A | 0 | 6 | 0 |
| B | 0 | 6 | 0 |
| C | 0 | 6 | 0 |
| D | 0 | 6 | 0 |
| Mode M0 | |||
|---|---|---|---|
| Quadrant | BADHDUFLAG | Total packets | Discarded packets |
| A | 0 | 2742 | 1 |
| B | 0 | 2749 | 1 |
| C | 0 | 2769 | 1 |
| D | 0 | 2693 | 1 |
| Mode SS | |||
|---|---|---|---|
| Quadrant | BADHDUFLAG | Total packets | Discarded packets |
| A | 0 | 24 | 0 |
| B | 0 | 24 | 0 |
| C | 0 | 24 | 0 |
| D | 0 | 24 | 0 |
| Quadrant | Total seconds | Saturated seconds | Saturation percentage |
|---|---|---|---|
| A | 1276 | 5 | 0.391850% |
| B | 1276 | 18 | 1.410658% |
| C | 1276 | 19 | 1.489028% |
| D | 1276 | 2 | 0.156740% |
Noise dominated data is calculated using 1-second bins in cleaned event files. If a bin has >2000 counts, and if more than 50% of those come from <1% of pixels, then it is considered to be noise-dominated and hence unusable.
| Quadrant | # 1 sec bins | Bins with >0 counts | Bins with >2000 counts | High rate bins dominated by noise | Noise dominated (total time) | Noise dominated (detector-on time) | Marked lightcurve |
|---|---|---|---|---|---|---|---|
| A | 1276 | 1276 | 0 | 0 | 0.00% | 0.00% | 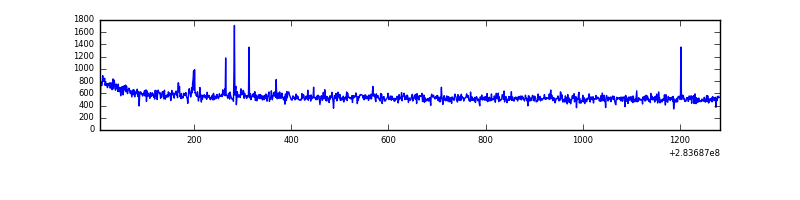 |
| B | 1276 | 1276 | 0 | 0 | 0.00% | 0.00% | 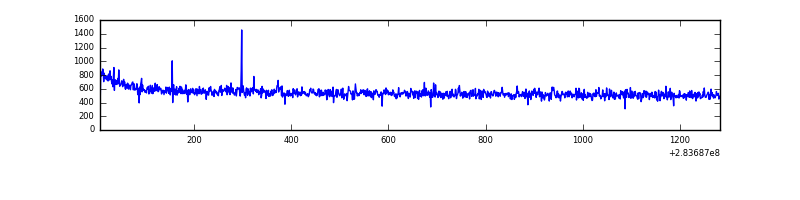 |
| C | 1276 | 1276 | 0 | 0 | 0.00% | 0.00% | 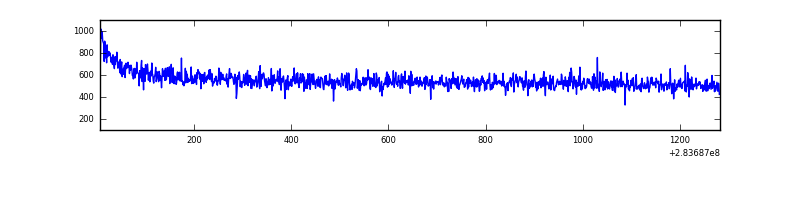 |
| D | 1276 | 1276 | 0 | 0 | 0.00% | 0.00% | 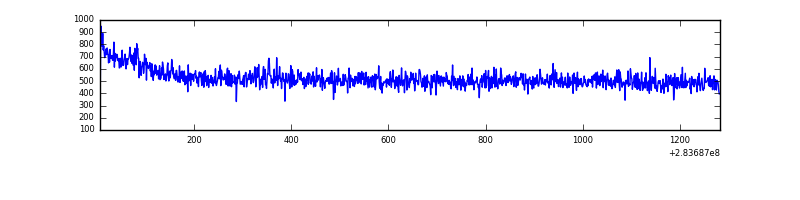 |
Top three noisy pixels from each quadrant. If the there are fewer than three noisy pixels in the level2.evt file, extra rows are filled as -1
| Pixel properties | Quadrant properties | ||||||
|---|---|---|---|---|---|---|---|
| Quadrant | DetID | PixID | Counts | Sigma | Mean | Median | Sigma |
| A | 14 | 237 | 11020 | 287.91 | 177 | 174 | 37.7 |
| A | 0 | 226 | 1577 | 37.24 | 177 | 174 | 37.7 |
| A | 12 | 194 | 1277 | 29.28 | 177 | 174 | 37.7 |
| B | 12 | 111 | 4016 | 109.06 | 176 | 172 | 35.2 |
| B | 11 | 111 | 3625 | 97.97 | 176 | 172 | 35.2 |
| B | 14 | 111 | 3086 | 82.68 | 176 | 172 | 35.2 |
| C | 14 | 238 | 26126 | 632.63 | 170 | 170 | 41.0 |
| C | 3 | 233 | 8307 | 198.32 | 170 | 170 | 41.0 |
| C | 5 | 218 | 2227 | 50.14 | 170 | 170 | 41.0 |
| D | 2 | 152 | 7068 | 158.67 | 173 | 168 | 43.5 |
| D | 2 | 234 | 4067 | 89.66 | 173 | 168 | 43.5 |
| D | 3 | 238 | 2824 | 61.08 | 173 | 168 | 43.5 |
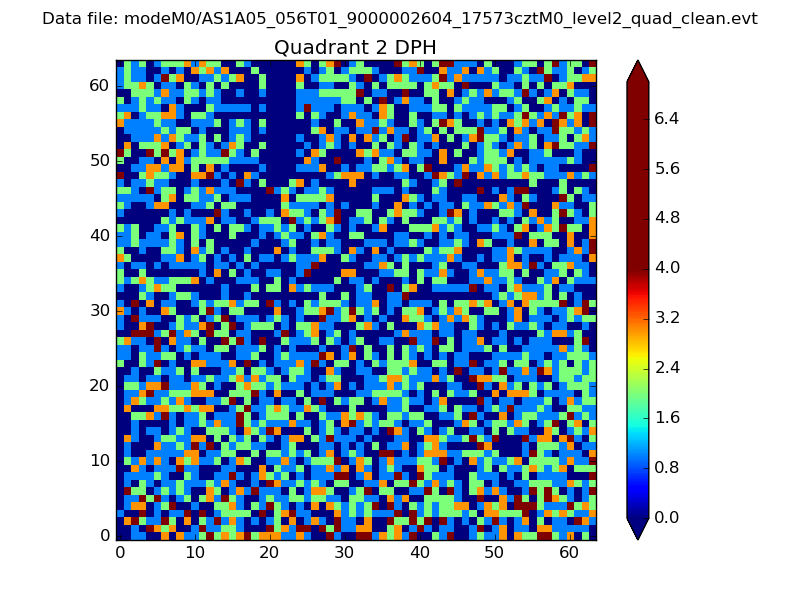
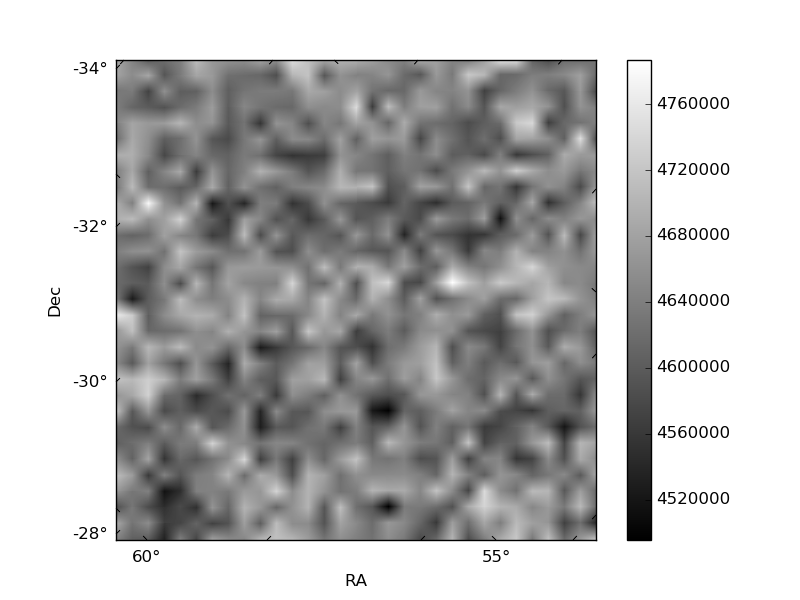
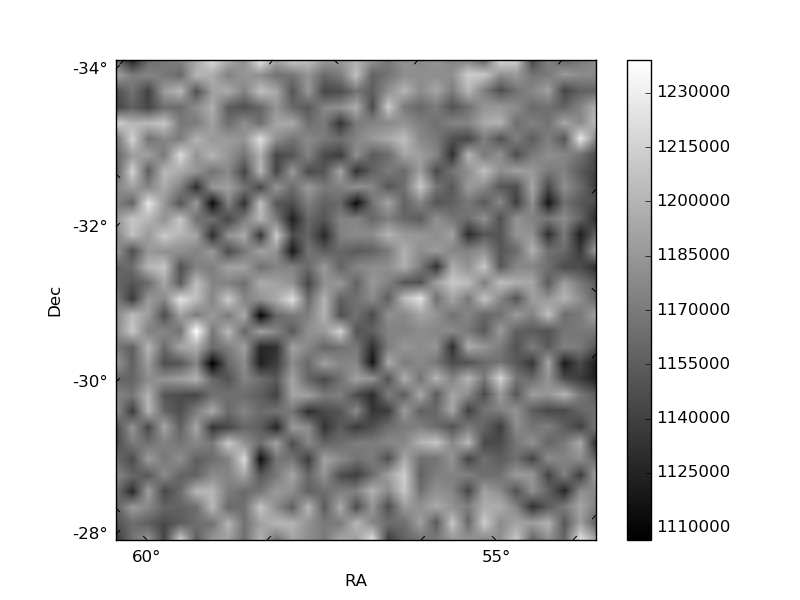
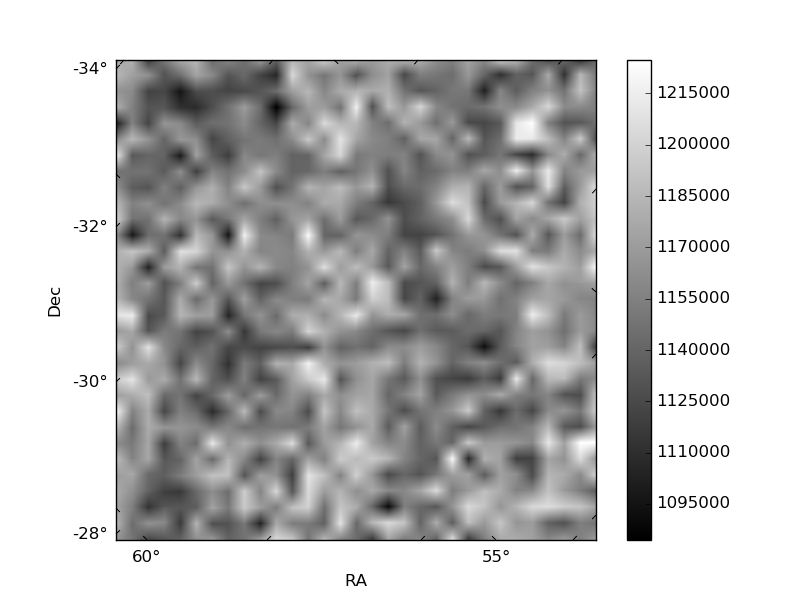
Histogram calculated using DETX and DETY for each event in the final _common_clean file
| Quadrant A | 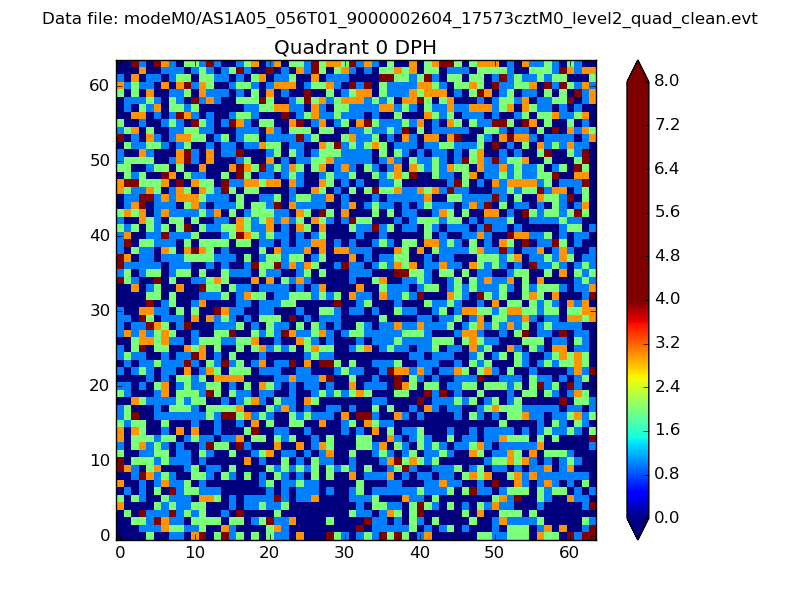 |
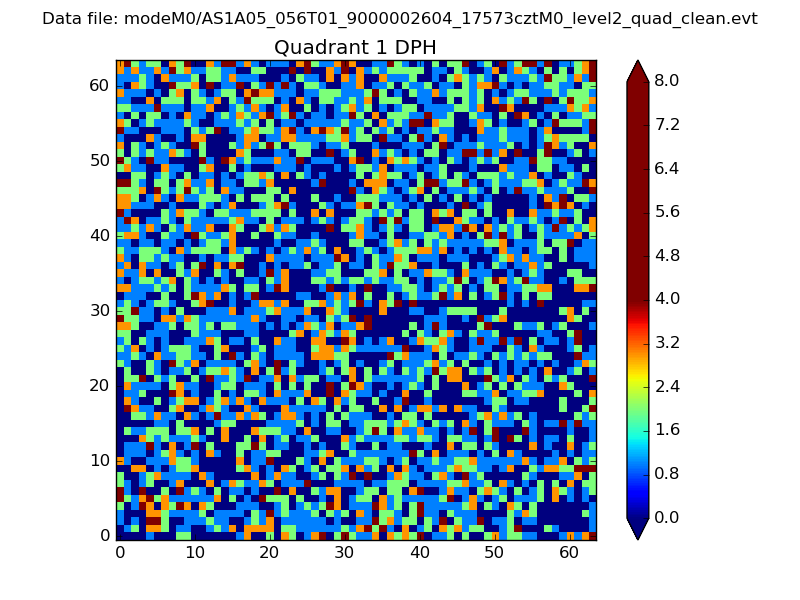 |
Quadrant B |
|---|---|---|---|
| Quadrant D | 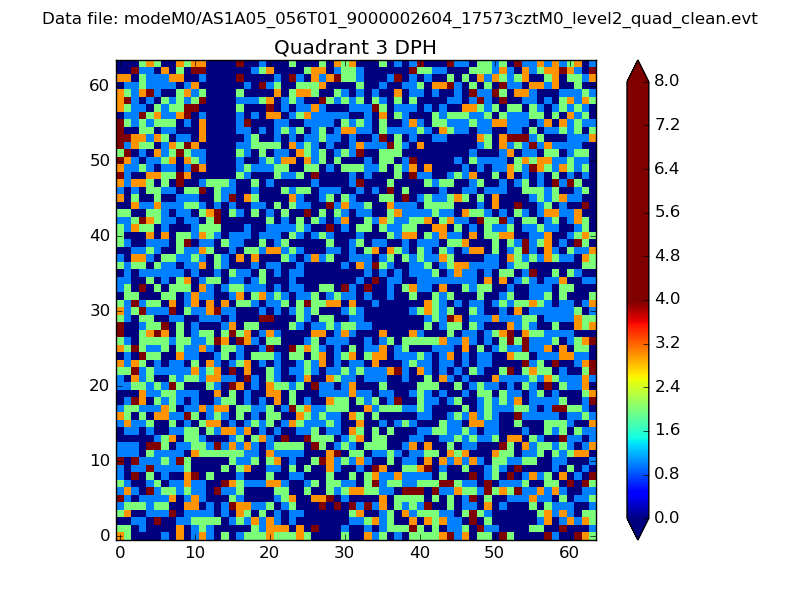 |
 |
Quadrant C |
| Plot type | Count rate plots | Images |
|---|---|---|
| Comparison with Poisson distribution Blue bars denote a histogram of data divided into 1 sec bins. Red curve is a Poisson curve with rate = median count rate of data. |
 |
 |
| Quadrant-wise count rates Data is divided into 100 sec bins |
 |
|
| Module-wise count rates for Quadrant A Data is divided into 100 sec bins |
 |
 |
| Module-wise count rates for Quadrant B Data is divided into 100 sec bins |
 |
 |
| Module-wise count rates for Quadrant C Data is divided into 100 sec bins |
 |
 |
| Module-wise count rates for Quadrant D Data is divided into 100 sec bins |
 |
 |
| Parameter | Plot |
|---|---|
| CZT HV Monitor | 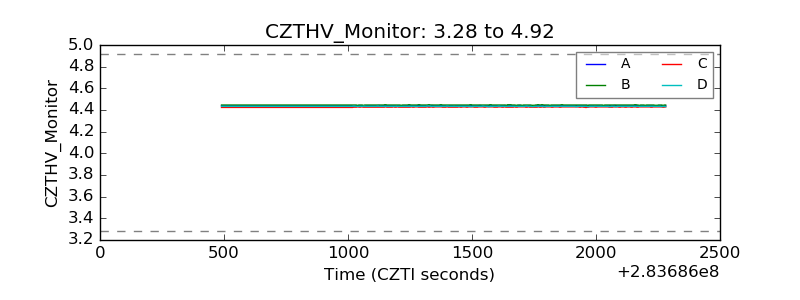 |
| D_VDD | 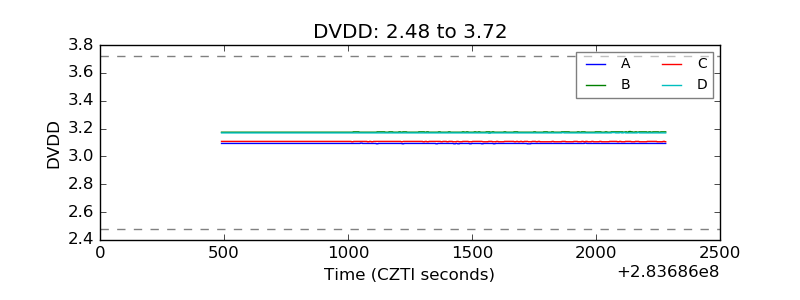 |
| Temperature 1 | 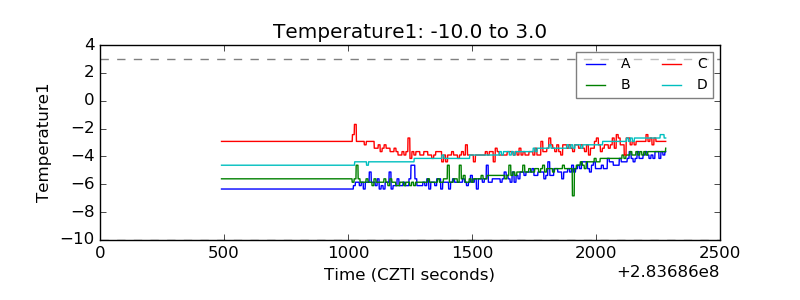 |
| Veto HV Monitor | 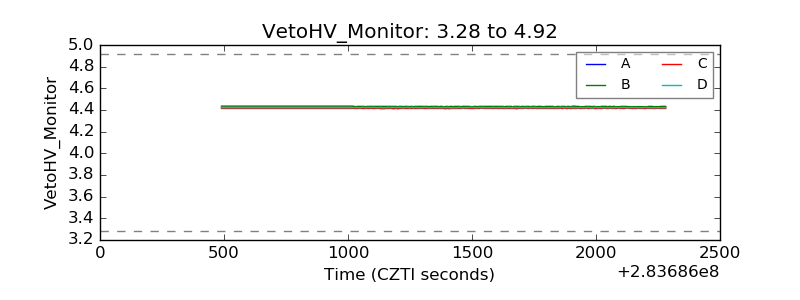 |
| Veto LLD | 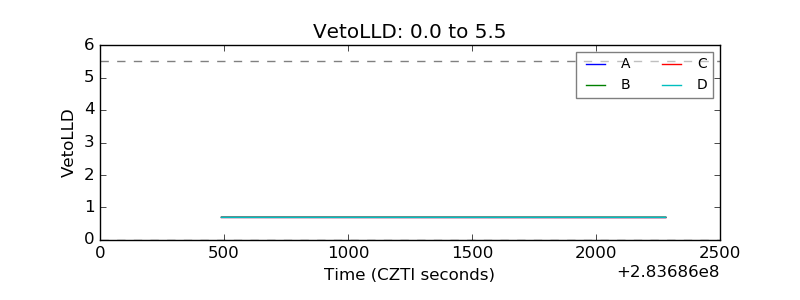 |
| Alpha Counter | 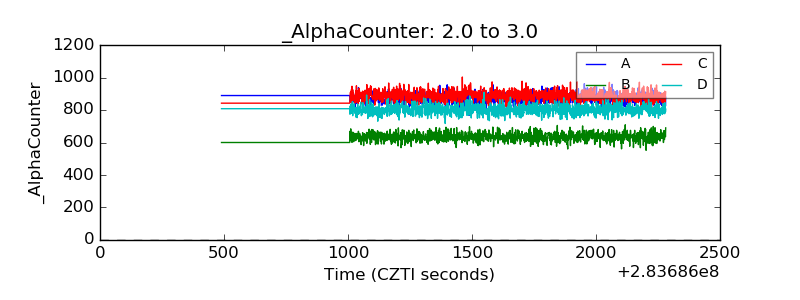 |
| _CPM_Rate |  |
| CZT Counter | 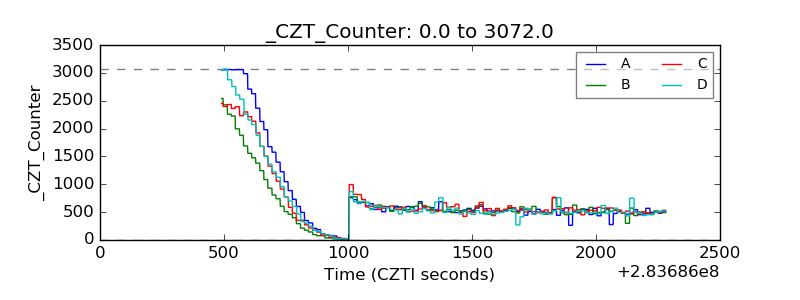 |
| +2.5 Volts monitor |  |
| +5 Volts monitor |  |
| _ROLL_ROT | 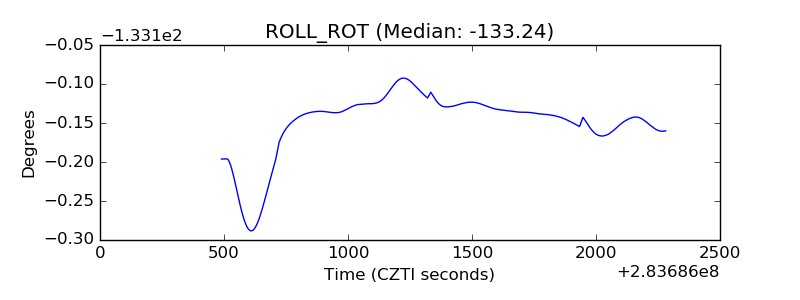 |
| _Roll_DEC | 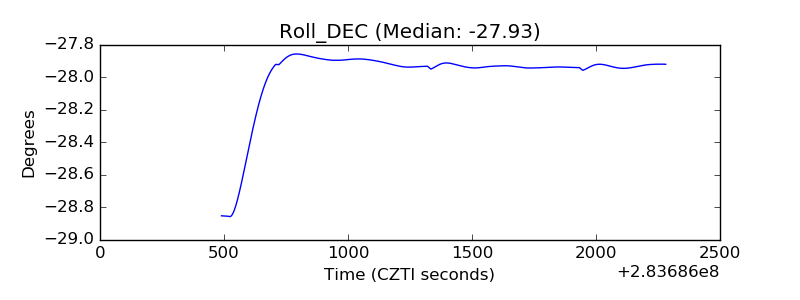 |
| _Roll_RA | 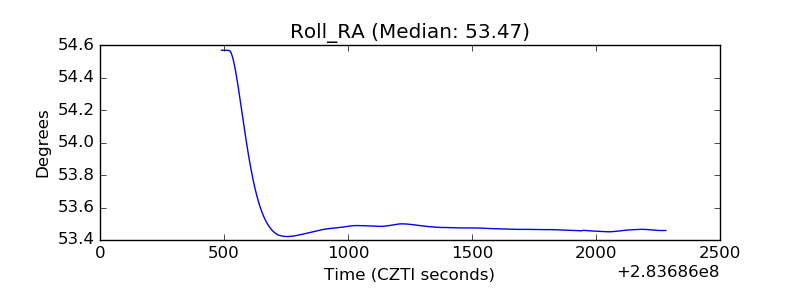 |
| Veto Counter | 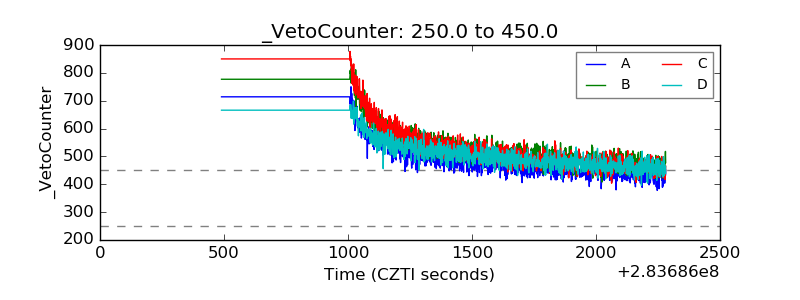 |