| Param | Original file | Final file |
|---|---|---|
| Filename | modeM0/AS1A05_056T01_9000002604_17576cztM0_level2.evt | modeM0/AS1A05_056T01_9000002604_17576cztM0_level2_quad_clean.evt |
| Size (bytes) | 600,105,600 | 94,199,040 |
| Size | 572.3 MB | 89.8 MB |
| Events in quadrant A | 6,089,093 | 501,556 |
| Events in quadrant B | 3,814,652 | 621,567 |
| Events in quadrant C | 3,898,990 | 595,000 |
| Events in quadrant D | 3,848,725 | 598,451 |
| Mode M9 | |||
|---|---|---|---|
| Quadrant | BADHDUFLAG | Total packets | Discarded packets |
| A | 0 | 9 | 0 |
| B | 0 | 9 | 0 |
| C | 0 | 9 | 0 |
| D | 0 | 9 | 0 |
| Mode M0 | |||
|---|---|---|---|
| Quadrant | BADHDUFLAG | Total packets | Discarded packets |
| A | 0 | 23032 | 2 |
| B | 0 | 16354 | 2 |
| C | 0 | 16607 | 2 |
| D | 0 | 16722 | 2 |
| Mode SS | |||
|---|---|---|---|
| Quadrant | BADHDUFLAG | Total packets | Discarded packets |
| A | 0 | 156 | 0 |
| B | 0 | 156 | 0 |
| C | 0 | 156 | 0 |
| D | 0 | 156 | 0 |
| Quadrant | Total seconds | Saturated seconds | Saturation percentage |
|---|---|---|---|
| A | 7707 | 1374 | 17.827949% |
| B | 7707 | 241 | 3.127027% |
| C | 7707 | 237 | 3.075127% |
| D | 7707 | 132 | 1.712729% |
Noise dominated data is calculated using 1-second bins in cleaned event files. If a bin has >2000 counts, and if more than 50% of those come from <1% of pixels, then it is considered to be noise-dominated and hence unusable.
| Quadrant | # 1 sec bins | Bins with >0 counts | Bins with >2000 counts | High rate bins dominated by noise | Noise dominated (total time) | Noise dominated (detector-on time) | Marked lightcurve |
|---|---|---|---|---|---|---|---|
| A | 8562 | 7708 | 939 | 939 | 10.97% | 12.18% | 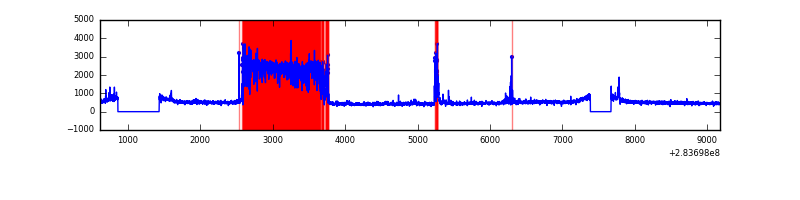 |
| B | 8562 | 7708 | 0 | 0 | 0.00% | 0.00% | 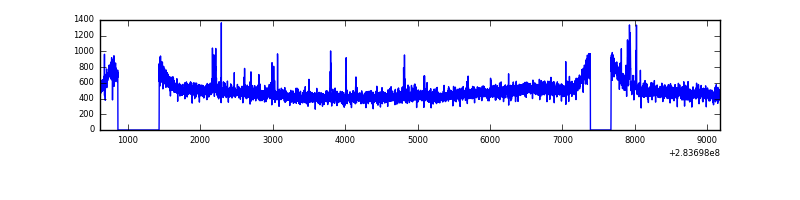 |
| C | 8562 | 7709 | 0 | 0 | 0.00% | 0.00% | 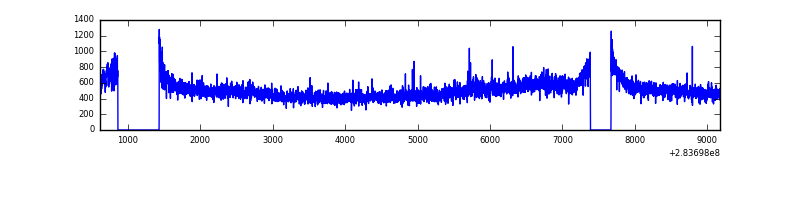 |
| D | 8562 | 7709 | 28 | 28 | 0.33% | 0.36% | 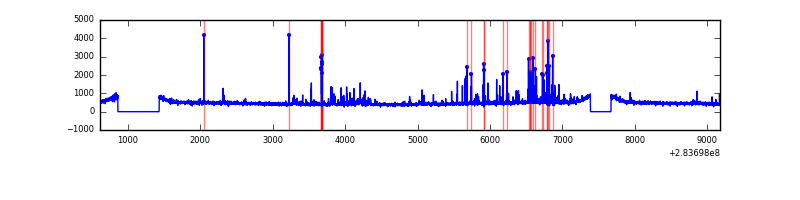 |
Top three noisy pixels from each quadrant. If the there are fewer than three noisy pixels in the level2.evt file, extra rows are filled as -1
| Pixel properties | Quadrant properties | ||||||
|---|---|---|---|---|---|---|---|
| Quadrant | DetID | PixID | Counts | Sigma | Mean | Median | Sigma |
| A | 14 | 237 | 2779995 | 15685.1 | 861 | 842 | 177.2 |
| A | 0 | 226 | 7444 | 37.26 | 861 | 842 | 177.2 |
| A | 3 | 137 | 6835 | 33.82 | 861 | 842 | 177.2 |
| B | 0 | 230 | 47443 | 247.68 | 956 | 929 | 187.8 |
| B | 12 | 111 | 22876 | 116.86 | 956 | 929 | 187.8 |
| B | 11 | 111 | 20031 | 101.71 | 956 | 929 | 187.8 |
| C | 3 | 233 | 183952 | 854.58 | 912 | 916 | 214.2 |
| C | 14 | 238 | 139882 | 648.82 | 912 | 916 | 214.2 |
| C | 0 | 207 | 14332 | 62.64 | 912 | 916 | 214.2 |
| D | 5 | 222 | 198508 | 873.7 | 936 | 908 | 226.2 |
| D | 13 | 189 | 88202 | 385.97 | 936 | 908 | 226.2 |
| D | 2 | 234 | 29494 | 126.39 | 936 | 908 | 226.2 |
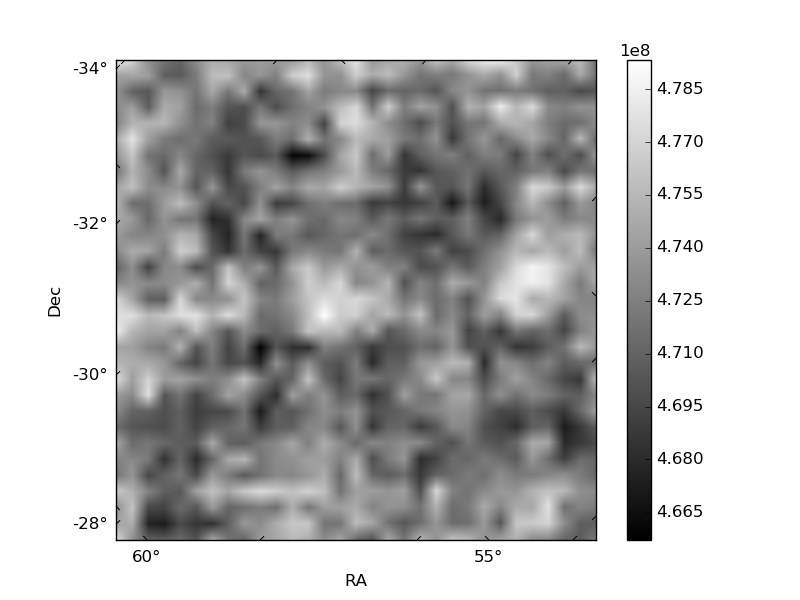
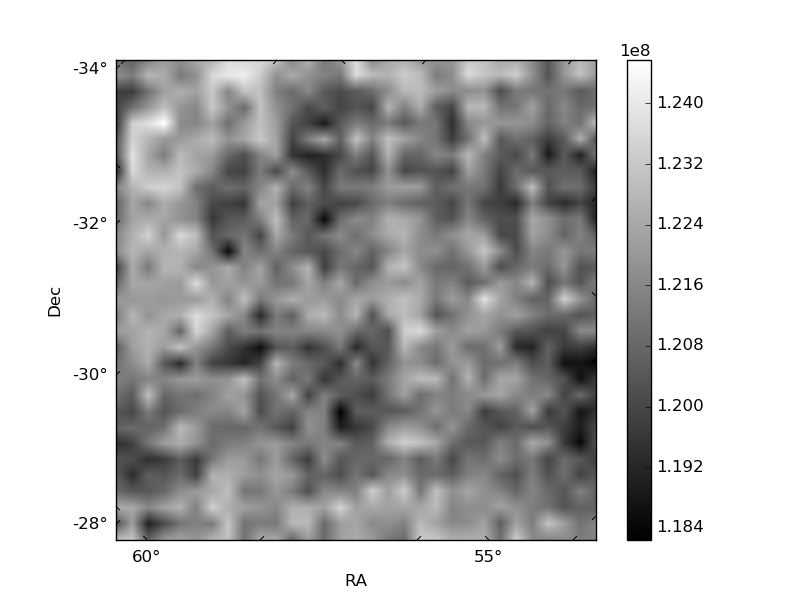
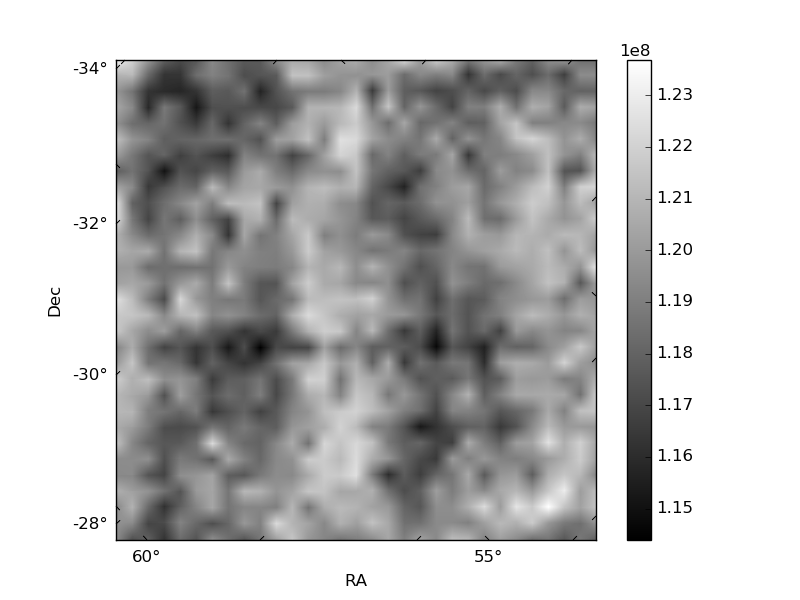
Histogram calculated using DETX and DETY for each event in the final _common_clean file
| Quadrant A | 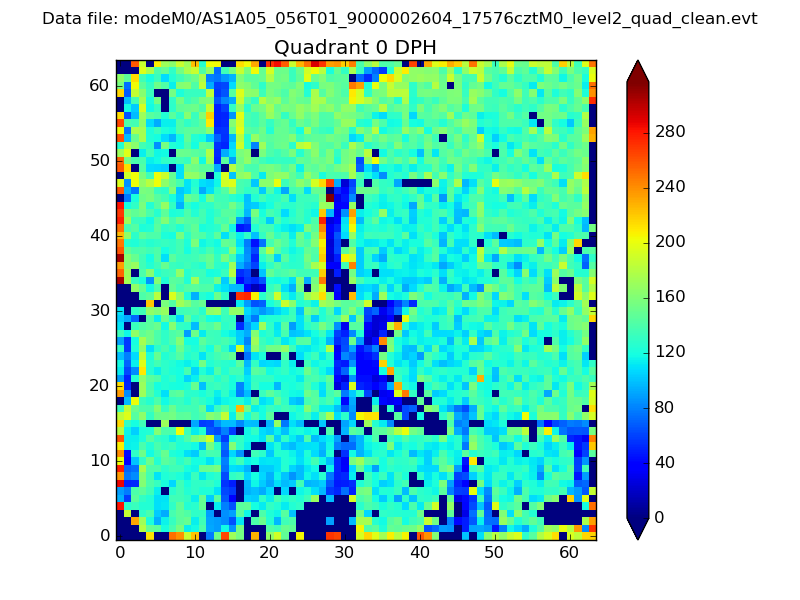 |
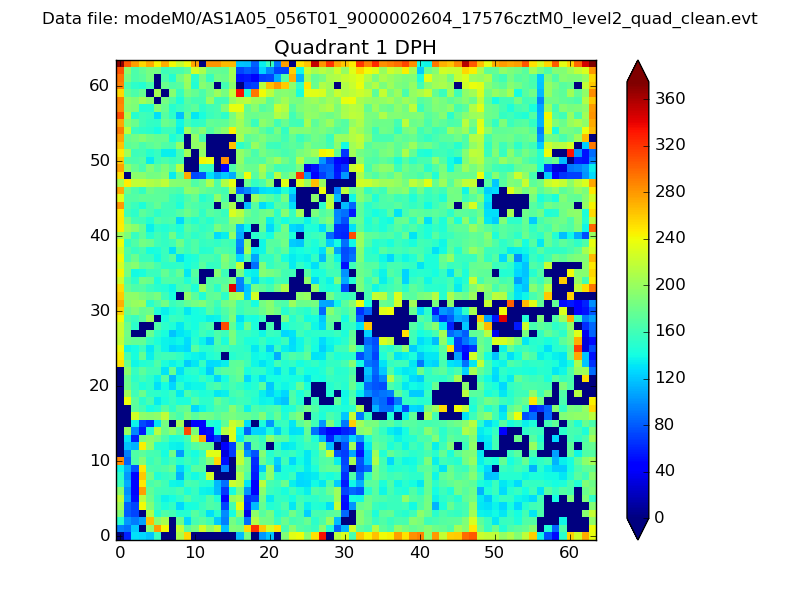 |
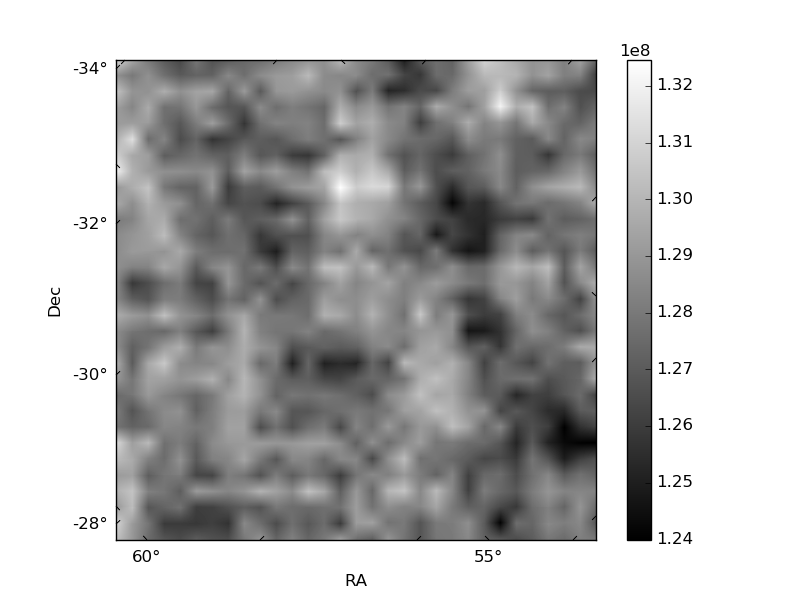
Quadrant B |
|---|---|---|---|
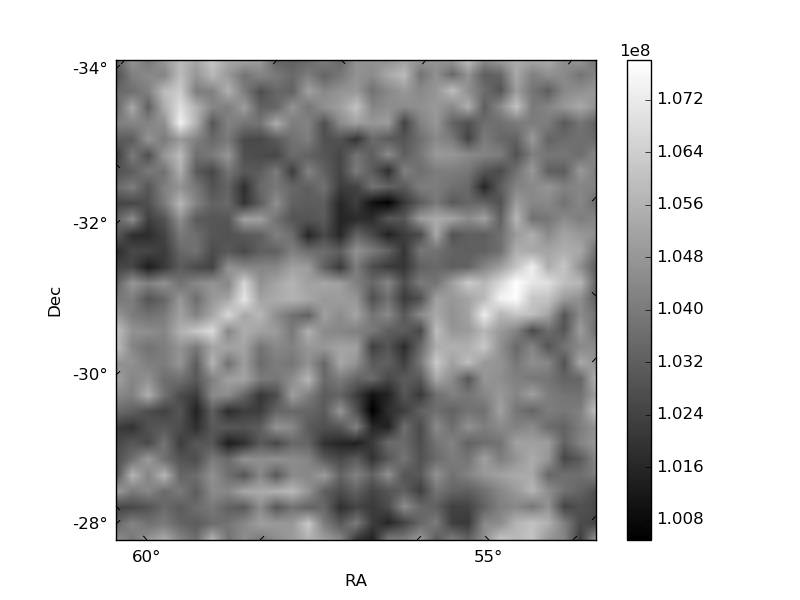
| Quadrant D | 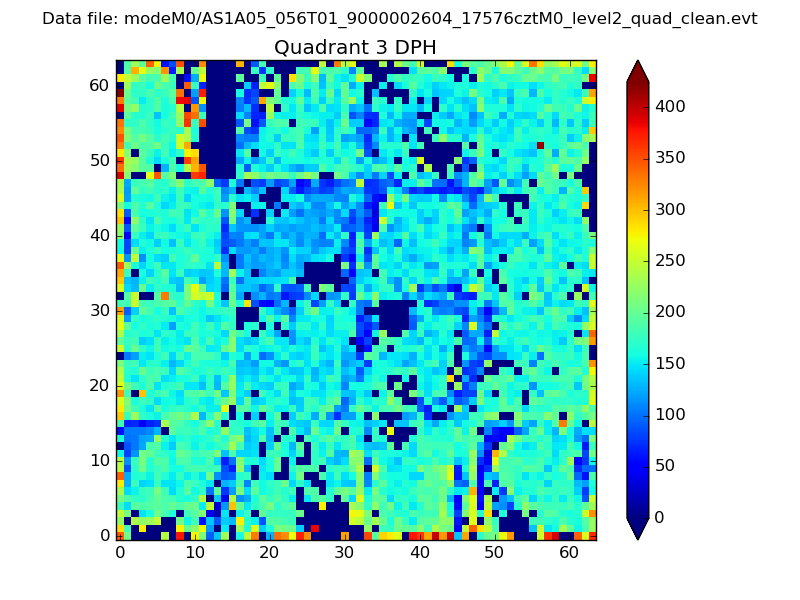 |
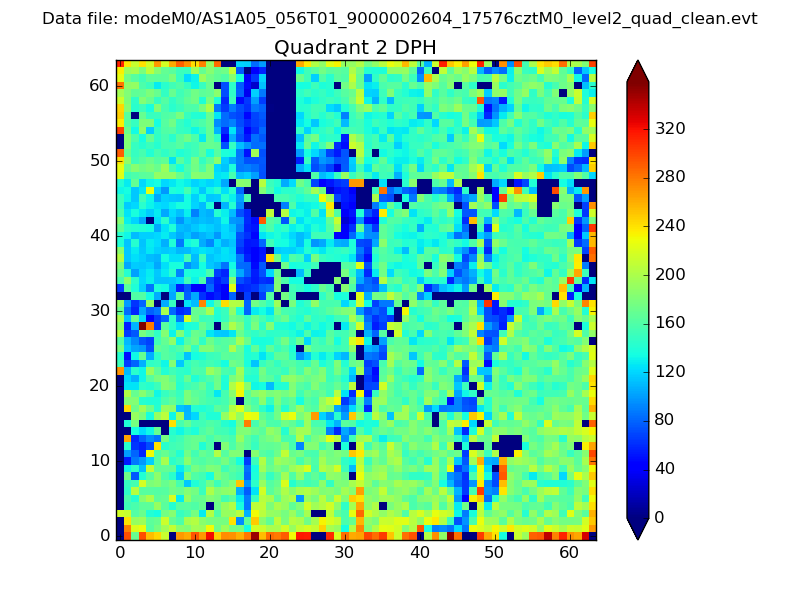 |
Quadrant C |
| Plot type | Count rate plots | Images |
|---|---|---|
| Comparison with Poisson distribution Blue bars denote a histogram of data divided into 1 sec bins. Red curve is a Poisson curve with rate = median count rate of data. |
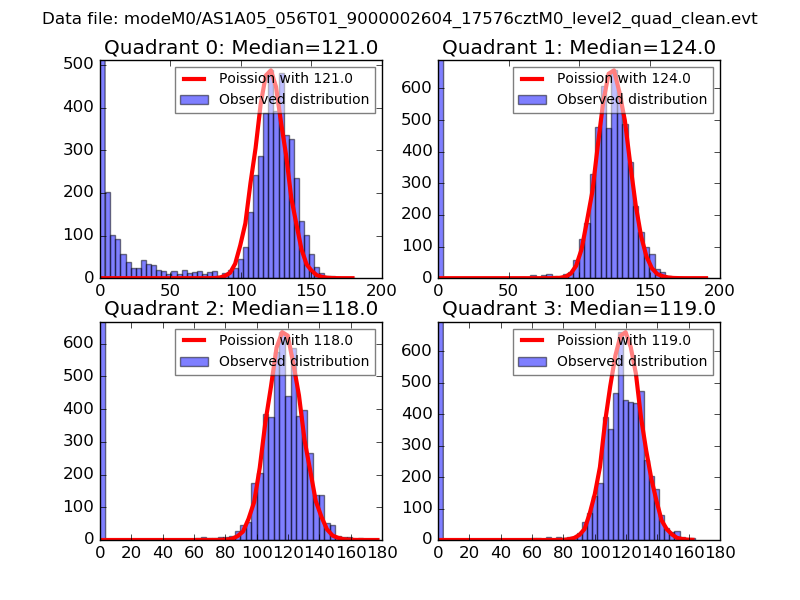 |
 |
| Quadrant-wise count rates Data is divided into 100 sec bins |
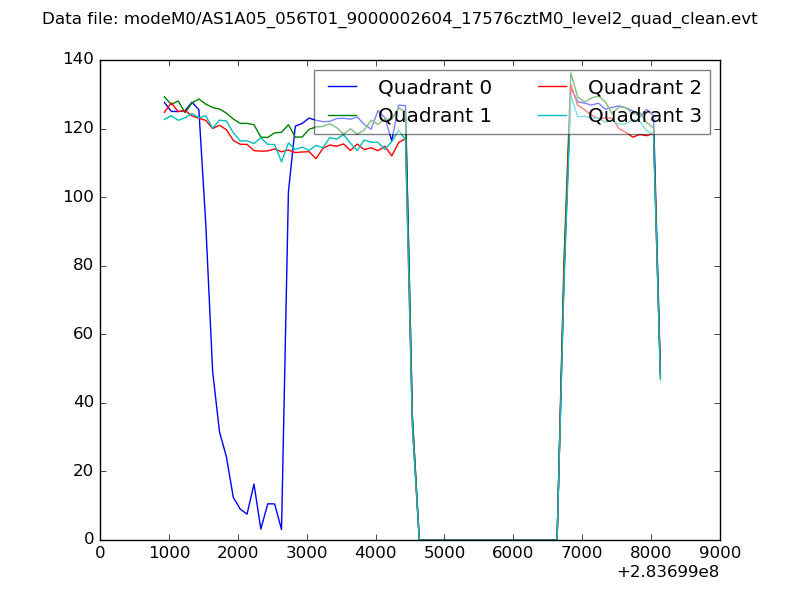 |
|
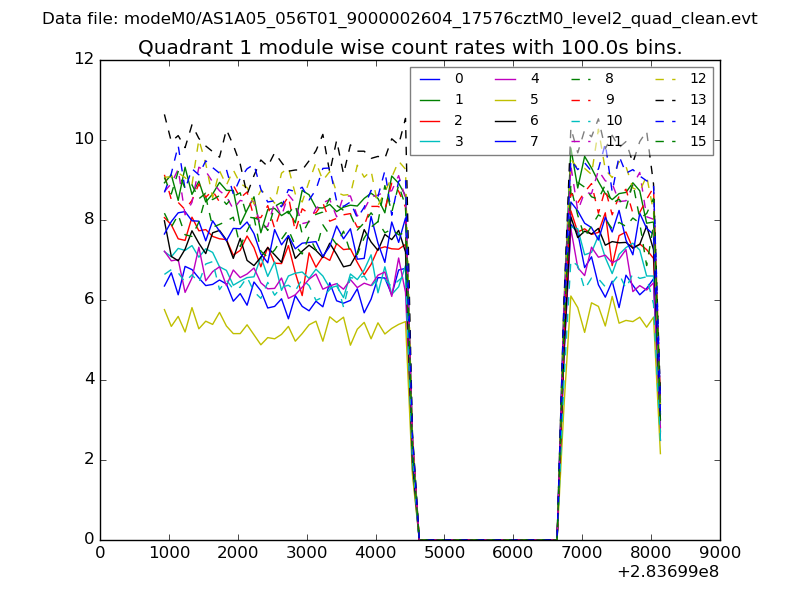
| Module-wise count rates for Quadrant A Data is divided into 100 sec bins |
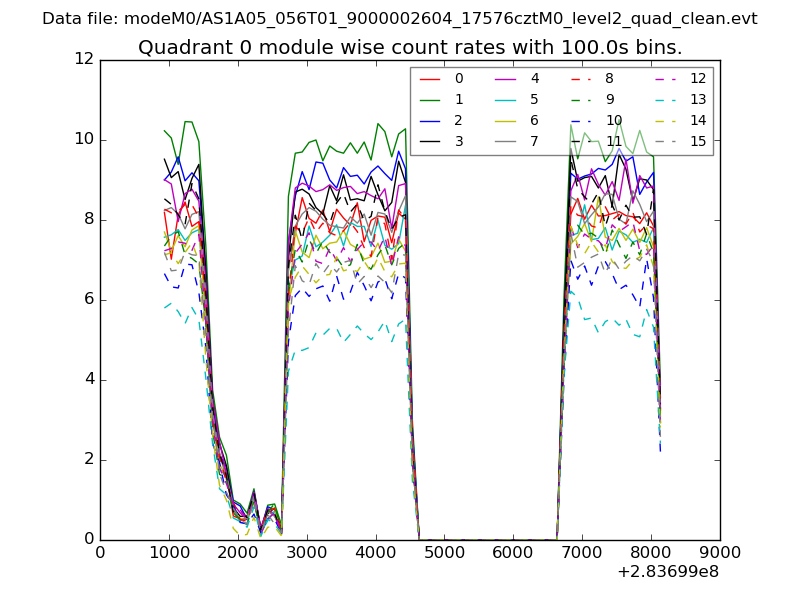 |
 |
| Module-wise count rates for Quadrant B Data is divided into 100 sec bins |
 |
 |
| Module-wise count rates for Quadrant C Data is divided into 100 sec bins |
 |
 |
| Module-wise count rates for Quadrant D Data is divided into 100 sec bins |
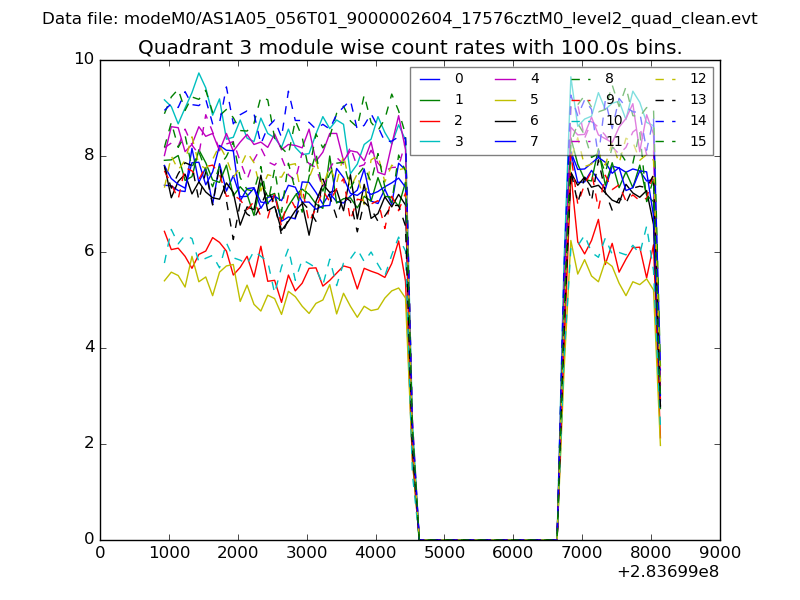 |
 |
| Parameter | Plot |
|---|---|
| CZT HV Monitor | 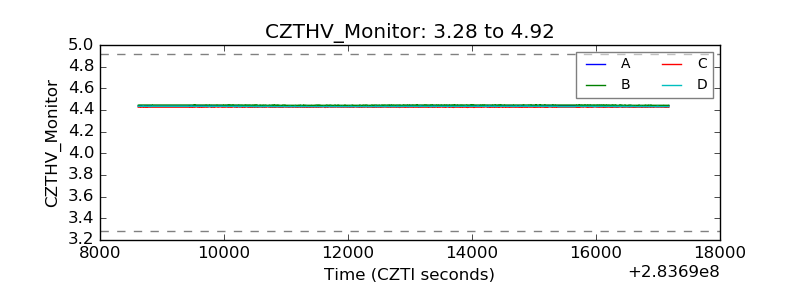 |
| D_VDD | 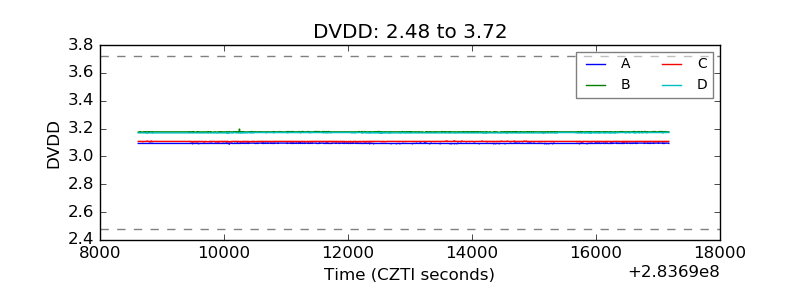 |
| Temperature 1 | 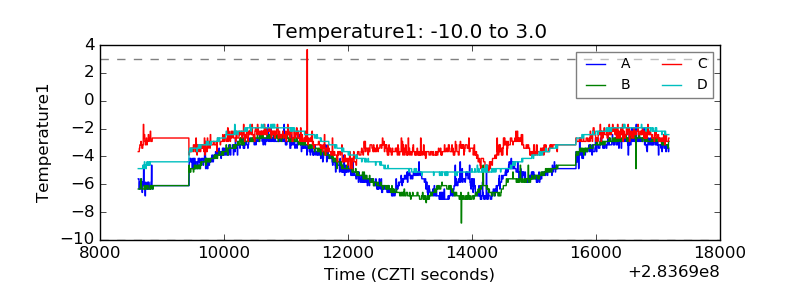 |
| Veto HV Monitor | 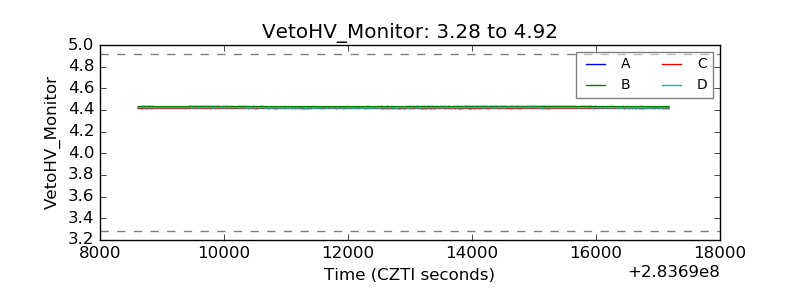 |
| Veto LLD | 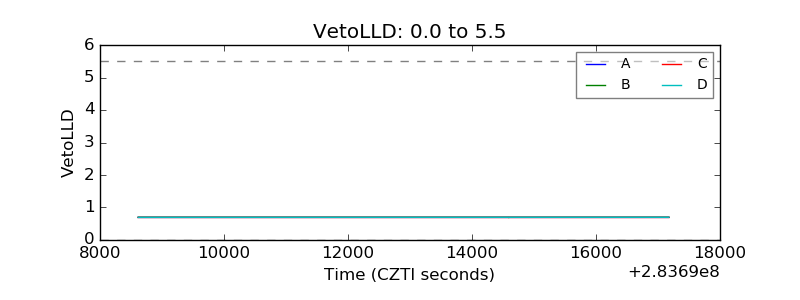 |
| Alpha Counter |  |
| _CPM_Rate | 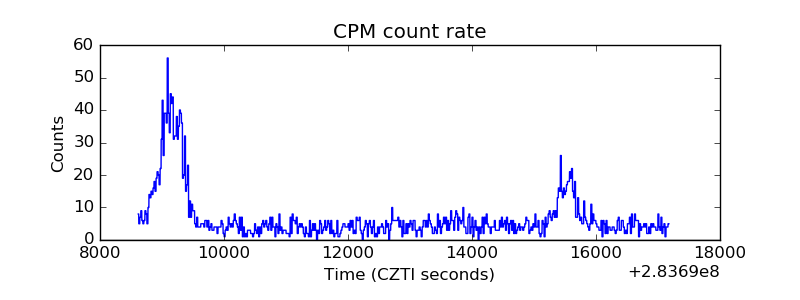 |
| CZT Counter |  |
| +2.5 Volts monitor |  |
| +5 Volts monitor | 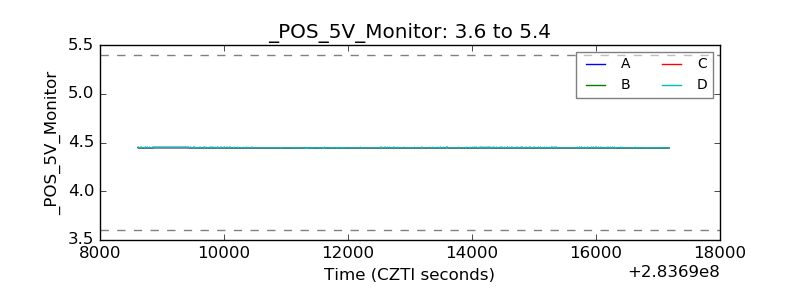 |
| _ROLL_ROT | 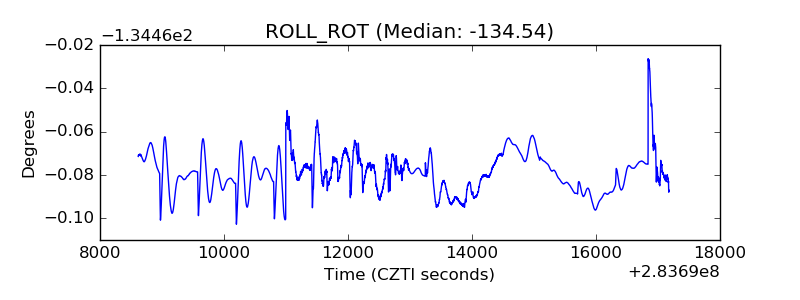 |
| _Roll_DEC | 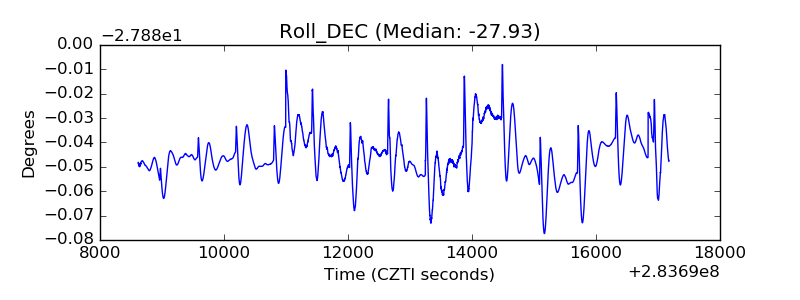 |
| _Roll_RA |  |
| Veto Counter | 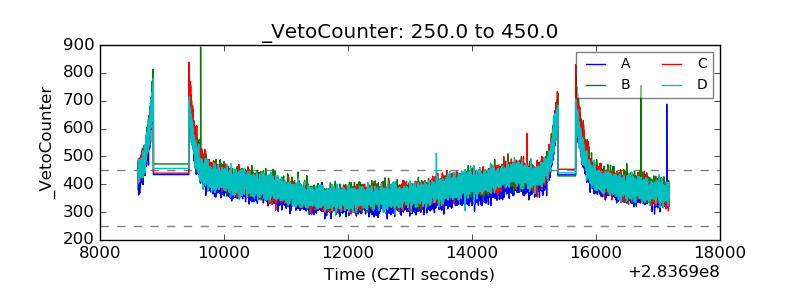 |