| Param | Original file | Final file |
|---|---|---|
| Filename | modeM0/AS1A05_056T01_9000002604_17577cztM0_level2.evt | modeM0/AS1A05_056T01_9000002604_17577cztM0_level2_quad_clean.evt |
| Size (bytes) | 508,999,680 | 100,131,840 |
| Size | 485.4 MB | 95.5 MB |
| Events in quadrant A | 3,924,898 | 641,489 |
| Events in quadrant B | 3,630,787 | 639,900 |
| Events in quadrant C | 3,814,322 | 611,510 |
| Events in quadrant D | 3,532,940 | 615,093 |
| Mode M9 | |||
|---|---|---|---|
| Quadrant | BADHDUFLAG | Total packets | Discarded packets |
| A | 0 | 6 | 0 |
| B | 0 | 6 | 0 |
| C | 0 | 6 | 0 |
| D | 0 | 6 | 0 |
| Mode M0 | |||
|---|---|---|---|
| Quadrant | BADHDUFLAG | Total packets | Discarded packets |
| A | 0 | 16608 | 3 |
| B | 0 | 15777 | 2 |
| C | 0 | 16248 | 2 |
| D | 0 | 15831 | 2 |
| Mode SS | |||
|---|---|---|---|
| Quadrant | BADHDUFLAG | Total packets | Discarded packets |
| A | 0 | 156 | 0 |
| B | 0 | 156 | 0 |
| C | 0 | 156 | 0 |
| D | 0 | 156 | 0 |
| Quadrant | Total seconds | Saturated seconds | Saturation percentage |
|---|---|---|---|
| A | 7534 | 167 | 2.216618% |
| B | 7535 | 122 | 1.619111% |
| C | 7535 | 151 | 2.003981% |
| D | 7535 | 48 | 0.637027% |
Noise dominated data is calculated using 1-second bins in cleaned event files. If a bin has >2000 counts, and if more than 50% of those come from <1% of pixels, then it is considered to be noise-dominated and hence unusable.
| Quadrant | # 1 sec bins | Bins with >0 counts | Bins with >2000 counts | High rate bins dominated by noise | Noise dominated (total time) | Noise dominated (detector-on time) | Marked lightcurve |
|---|---|---|---|---|---|---|---|
| A | 8139 | 7537 | 44 | 44 | 0.54% | 0.58% | 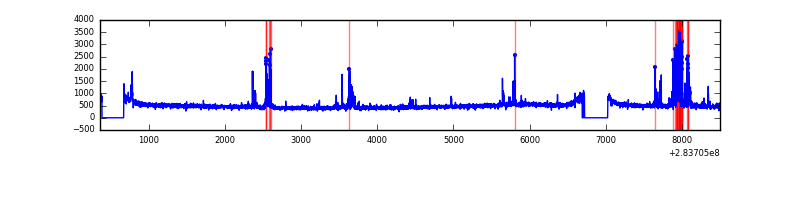 |
| B | 8140 | 7538 | 0 | 0 | 0.00% | 0.00% | 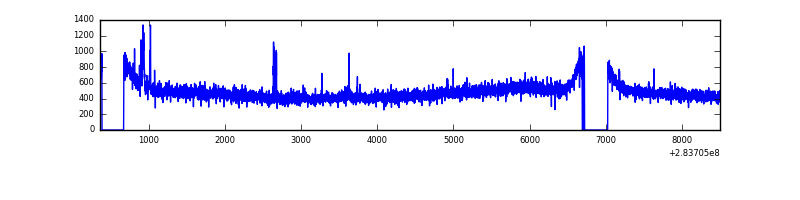 |
| C | 8140 | 7538 | 0 | 0 | 0.00% | 0.00% | 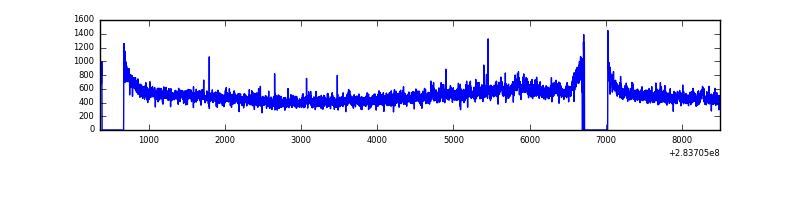 |
| D | 8140 | 7538 | 9 | 9 | 0.11% | 0.12% | 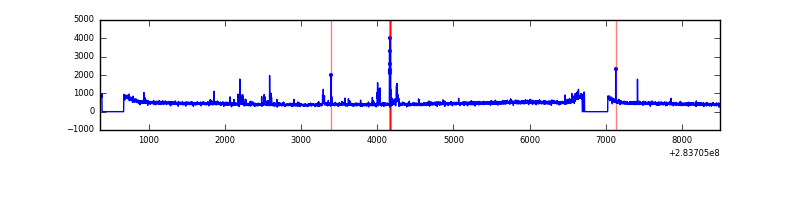 |
Top three noisy pixels from each quadrant. If the there are fewer than three noisy pixels in the level2.evt file, extra rows are filled as -1
| Pixel properties | Quadrant properties | ||||||
|---|---|---|---|---|---|---|---|
| Quadrant | DetID | PixID | Counts | Sigma | Mean | Median | Sigma |
| A | 14 | 237 | 378541 | 1999.57 | 923 | 902 | 188.9 |
| A | 0 | 226 | 8075 | 37.98 | 923 | 902 | 188.9 |
| A | 3 | 137 | 7268 | 33.71 | 923 | 902 | 188.9 |
| B | 0 | 230 | 28703 | 155.04 | 918 | 892 | 179.4 |
| B | 12 | 111 | 21952 | 117.4 | 918 | 892 | 179.4 |
| B | 11 | 111 | 19010 | 101.0 | 918 | 892 | 179.4 |
| C | 3 | 233 | 269472 | 1304.45 | 872 | 878 | 205.9 |
| C | 14 | 238 | 134819 | 650.5 | 872 | 878 | 205.9 |
| C | 0 | 207 | 9323 | 41.01 | 872 | 878 | 205.9 |
| D | 13 | 189 | 116756 | 528.03 | 894 | 866 | 219.5 |
| D | 2 | 234 | 29619 | 131.01 | 894 | 866 | 219.5 |
| D | 5 | 222 | 25792 | 113.57 | 894 | 866 | 219.5 |
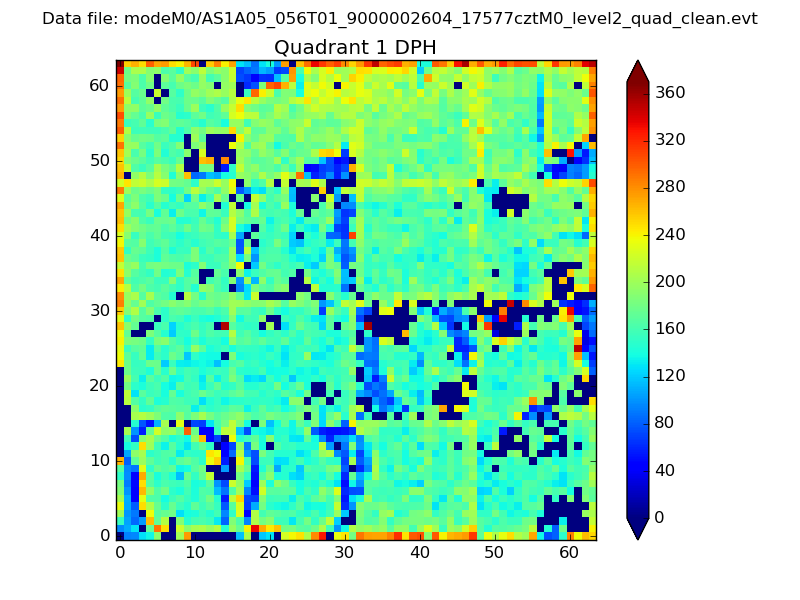
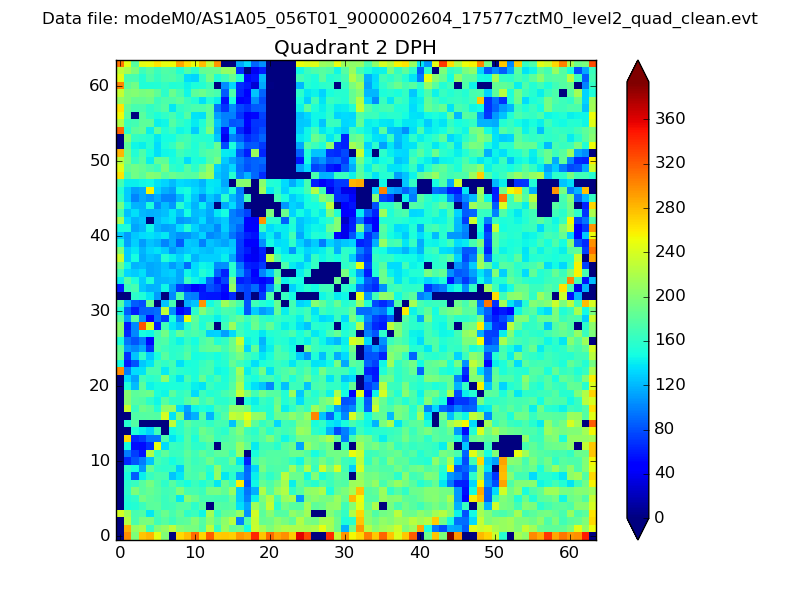
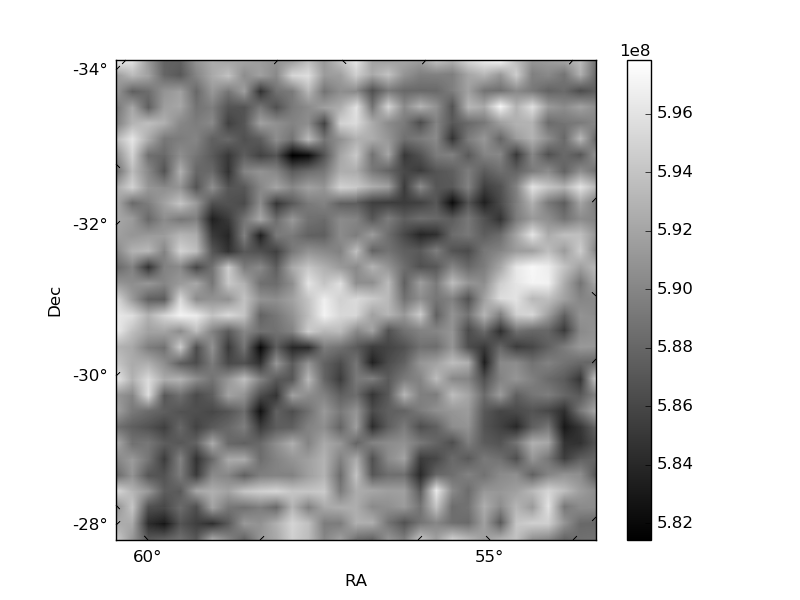
Histogram calculated using DETX and DETY for each event in the final _common_clean file
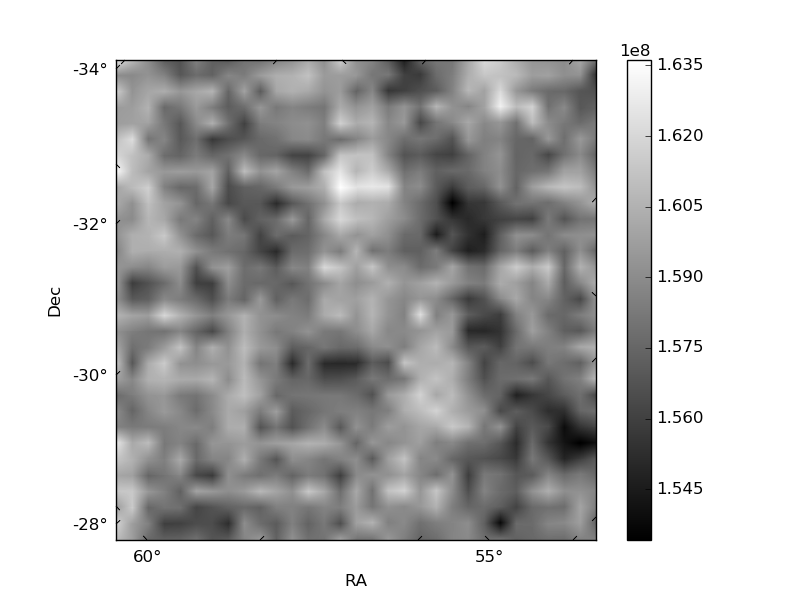
| Quadrant A |  |
 |
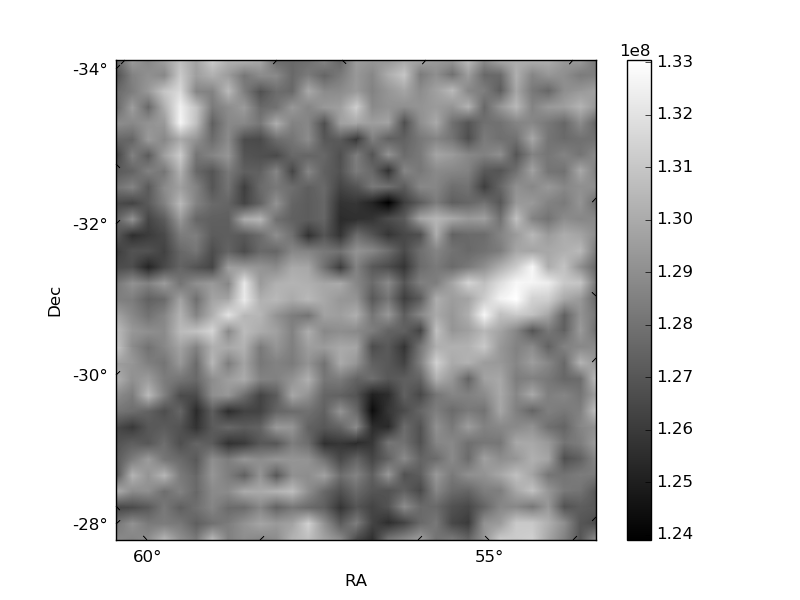
Quadrant B |
|---|---|---|---|
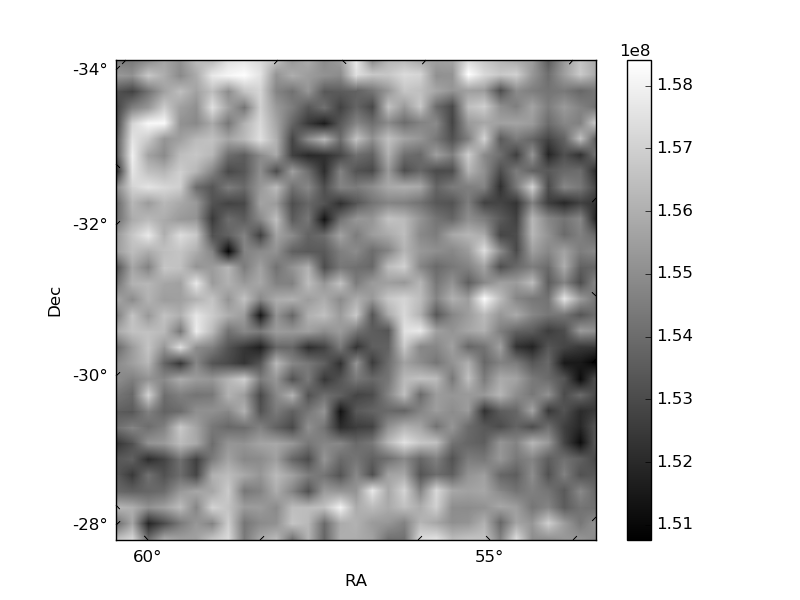
| Quadrant D | 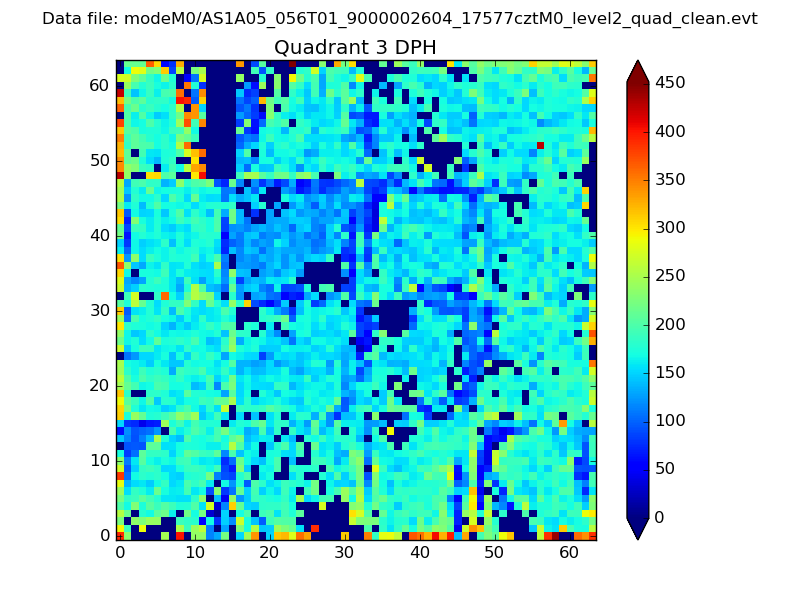 |
 |
Quadrant C |
| Plot type | Count rate plots | Images |
|---|---|---|
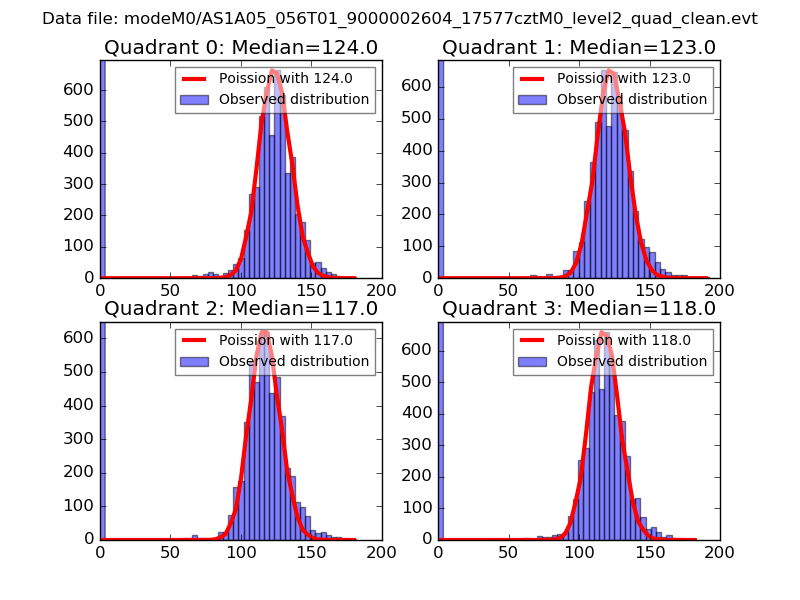
| Comparison with Poisson distribution Blue bars denote a histogram of data divided into 1 sec bins. Red curve is a Poisson curve with rate = median count rate of data. |
 |
 |
| Quadrant-wise count rates Data is divided into 100 sec bins |
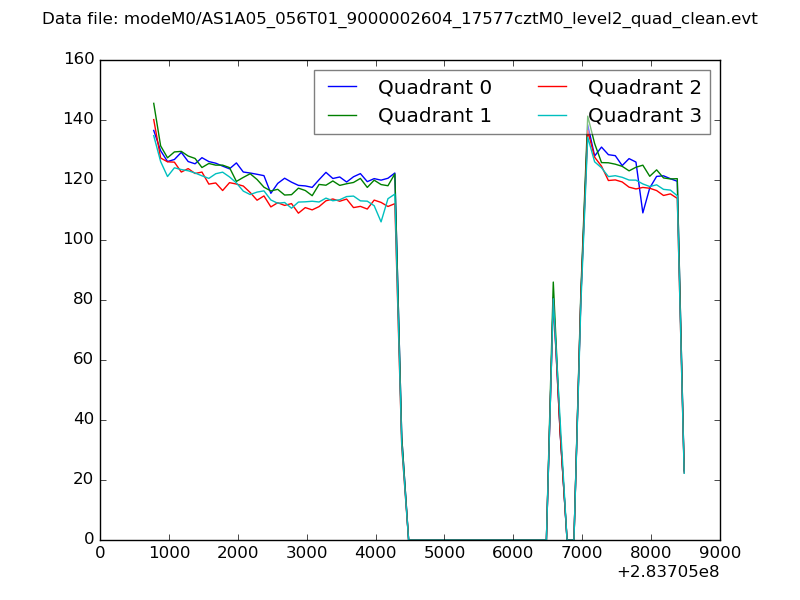 |
|
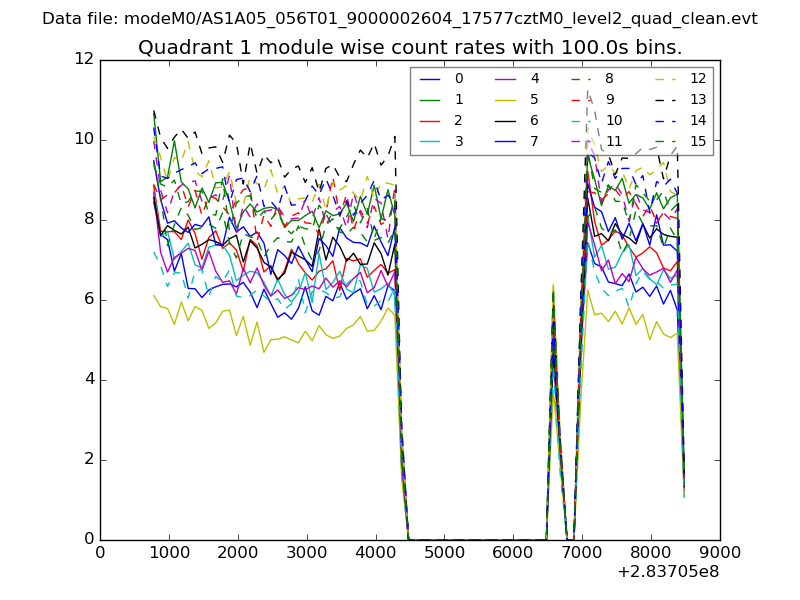
| Module-wise count rates for Quadrant A Data is divided into 100 sec bins |
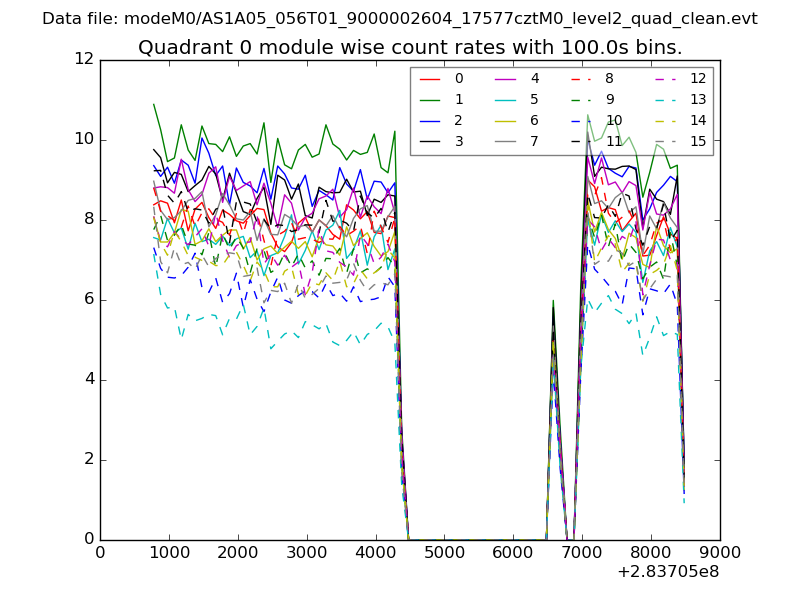 |
 |
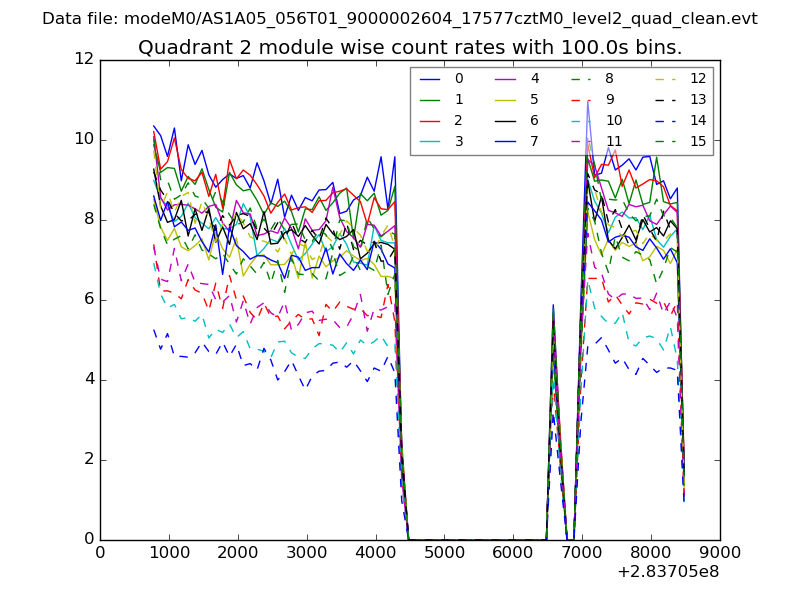
| Module-wise count rates for Quadrant B Data is divided into 100 sec bins |
 |
 |
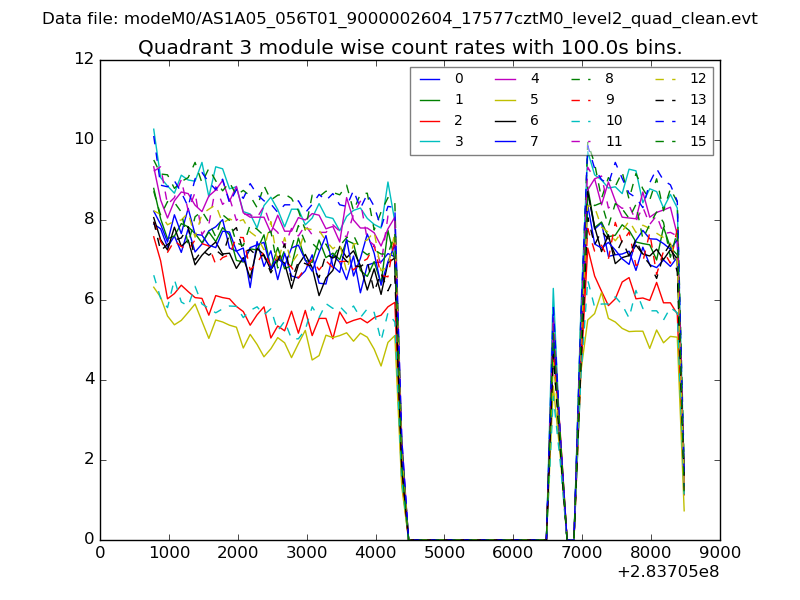
| Module-wise count rates for Quadrant C Data is divided into 100 sec bins |
 |
 |
| Module-wise count rates for Quadrant D Data is divided into 100 sec bins |
 |
 |
| Parameter | Plot |
|---|---|
| CZT HV Monitor | 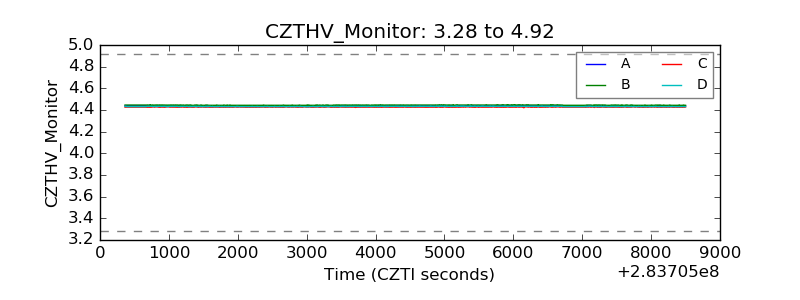 |
| D_VDD |  |
| Temperature 1 | 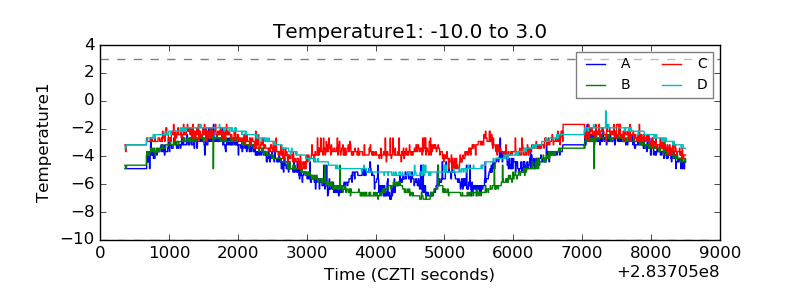 |
| Veto HV Monitor | 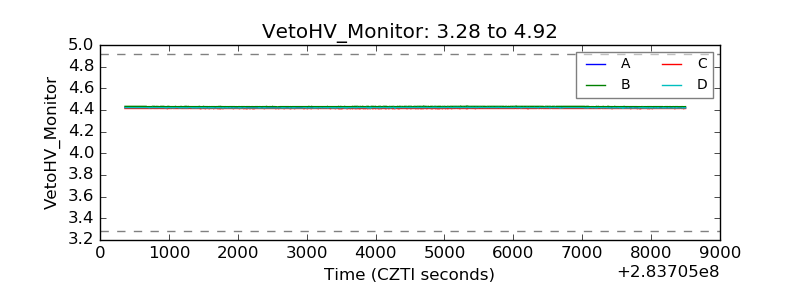 |
| Veto LLD | 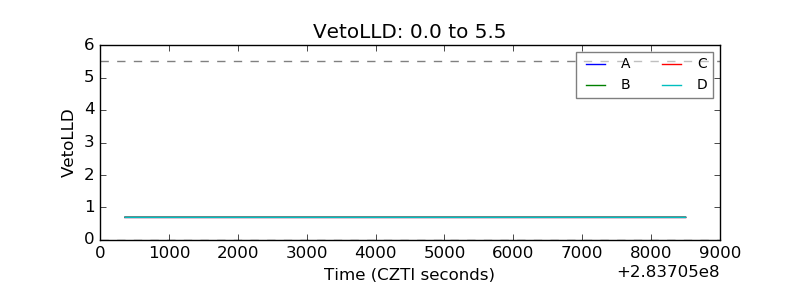 |
| Alpha Counter | 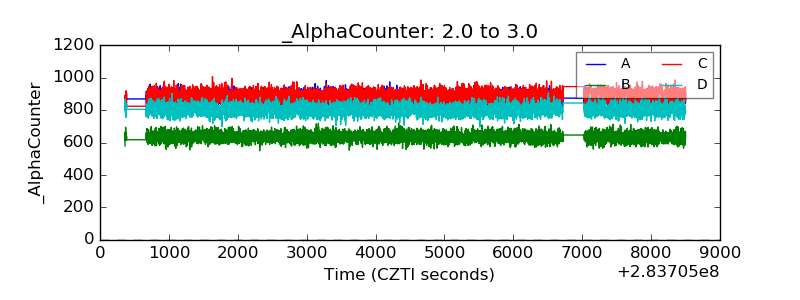 |
| _CPM_Rate | 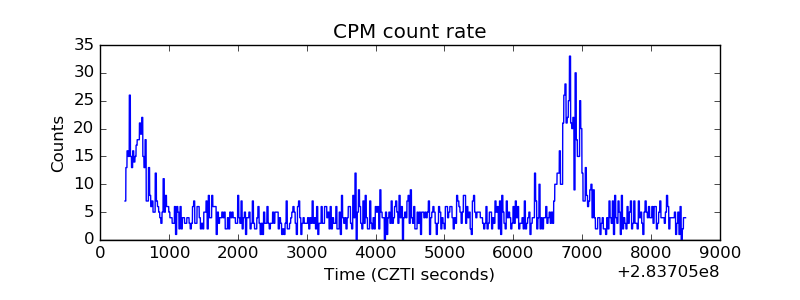 |
| CZT Counter | 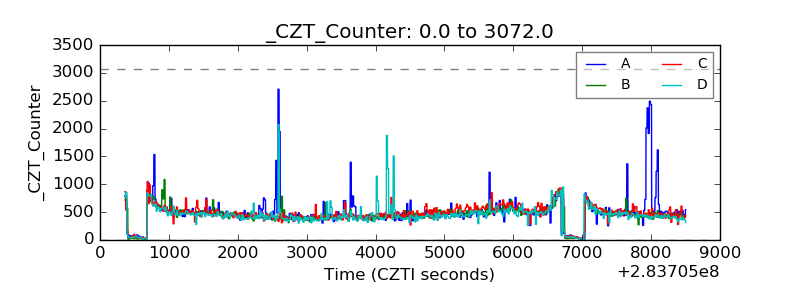 |
| +2.5 Volts monitor |  |
| +5 Volts monitor |  |
| _ROLL_ROT | 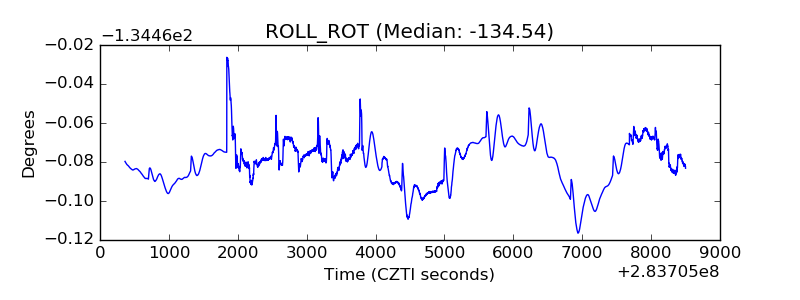 |
| _Roll_DEC | 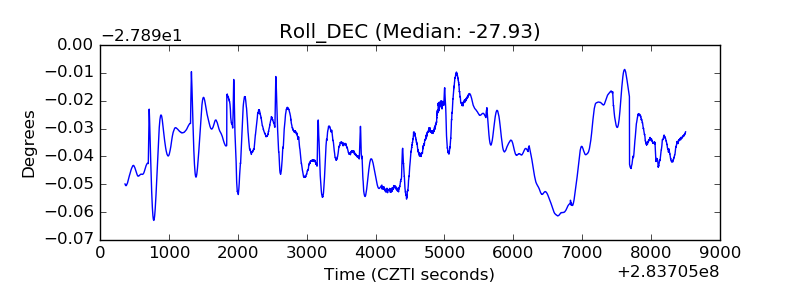 |
| _Roll_RA | 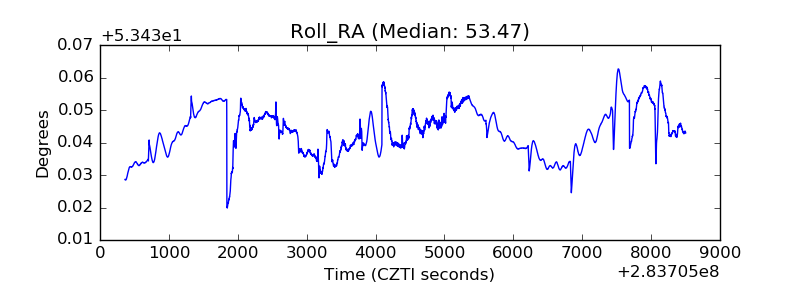 |
| Veto Counter | 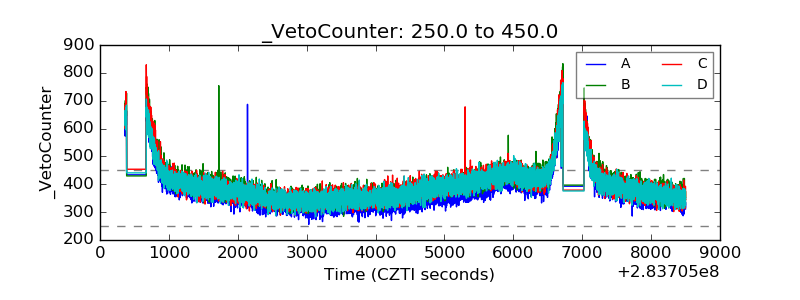 |