| Param | Original file | Final file |
|---|---|---|
| Filename | modeM0/AS1A05_056T01_9000002604_17580cztM0_level2.evt | modeM0/AS1A05_056T01_9000002604_17580cztM0_level2_quad_clean.evt |
| Size (bytes) | 1,240,038,720 | 230,063,040 |
| Size | 1.2 GB | 219.4 MB |
| Events in quadrant A | 10,094,527 | 1,451,965 |
| Events in quadrant B | 8,597,740 | 1,461,220 |
| Events in quadrant C | 9,065,056 | 1,388,246 |
| Events in quadrant D | 8,550,416 | 1,396,142 |
| Mode M9 | |||
|---|---|---|---|
| Quadrant | BADHDUFLAG | Total packets | Discarded packets |
| A | 0 | 19 | 0 |
| B | 0 | 19 | 0 |
| C | 0 | 19 | 0 |
| D | 0 | 19 | 0 |
| Mode M0 | |||
|---|---|---|---|
| Quadrant | BADHDUFLAG | Total packets | Discarded packets |
| A | 0 | 42223 | 4 |
| B | 0 | 37781 | 4 |
| C | 0 | 38573 | 4 |
| D | 0 | 38732 | 4 |
| Mode SS | |||
|---|---|---|---|
| Quadrant | BADHDUFLAG | Total packets | Discarded packets |
| A | 0 | 374 | 0 |
| B | 0 | 374 | 0 |
| C | 0 | 374 | 0 |
| D | 0 | 374 | 0 |
| Quadrant | Total seconds | Saturated seconds | Saturation percentage |
|---|---|---|---|
| A | 18438 | 428 | 2.321293% |
| B | 18439 | 100 | 0.542329% |
| C | 18439 | 165 | 0.894842% |
| D | 18439 | 78 | 0.423016% |
Noise dominated data is calculated using 1-second bins in cleaned event files. If a bin has >2000 counts, and if more than 50% of those come from <1% of pixels, then it is considered to be noise-dominated and hence unusable.
| Quadrant | # 1 sec bins | Bins with >0 counts | Bins with >2000 counts | High rate bins dominated by noise | Noise dominated (total time) | Noise dominated (detector-on time) | Marked lightcurve |
|---|---|---|---|---|---|---|---|
| A | 20328 | 18441 | 267 | 267 | 1.31% | 1.45% | 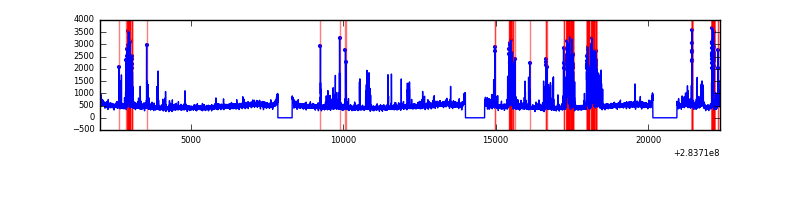 |
| B | 20329 | 18442 | 0 | 0 | 0.00% | 0.00% | 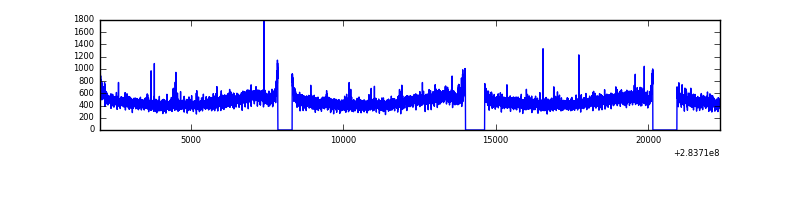 |
| C | 20329 | 18442 | 0 | 0 | 0.00% | 0.00% | 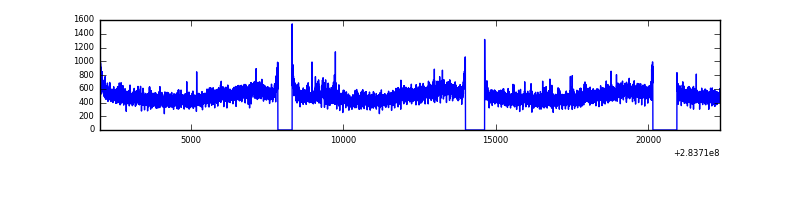 |
| D | 20329 | 18442 | 38 | 38 | 0.19% | 0.21% | 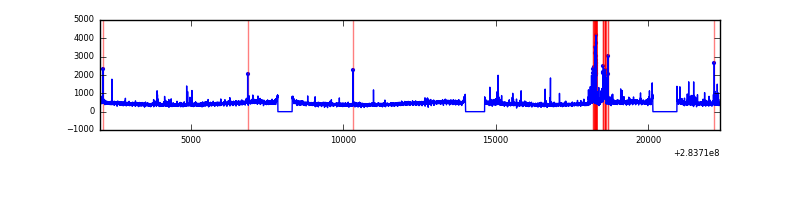 |
Top three noisy pixels from each quadrant. If the there are fewer than three noisy pixels in the level2.evt file, extra rows are filled as -1
| Pixel properties | Quadrant properties | ||||||
|---|---|---|---|---|---|---|---|
| Quadrant | DetID | PixID | Counts | Sigma | Mean | Median | Sigma |
| A | 14 | 237 | 1709896 | 3887.69 | 2176 | 2128 | 439.3 |
| A | 6 | 16 | 23381 | 48.38 | 2176 | 2128 | 439.3 |
| A | 0 | 226 | 18902 | 38.19 | 2176 | 2128 | 439.3 |
| B | 12 | 111 | 52307 | 120.56 | 2182 | 2123 | 416.3 |
| B | 11 | 111 | 45493 | 104.19 | 2182 | 2123 | 416.3 |
| B | 14 | 111 | 38655 | 87.76 | 2182 | 2123 | 416.3 |
| C | 3 | 233 | 587513 | 1198.06 | 2086 | 2097 | 488.6 |
| C | 14 | 238 | 320039 | 650.67 | 2086 | 2097 | 488.6 |
| C | 0 | 207 | 23790 | 44.39 | 2086 | 2097 | 488.6 |
| D | 5 | 222 | 361078 | 694.93 | 2120 | 2061 | 516.6 |
| D | 4 | 239 | 93807 | 177.59 | 2120 | 2061 | 516.6 |
| D | 2 | 234 | 69569 | 130.67 | 2120 | 2061 | 516.6 |
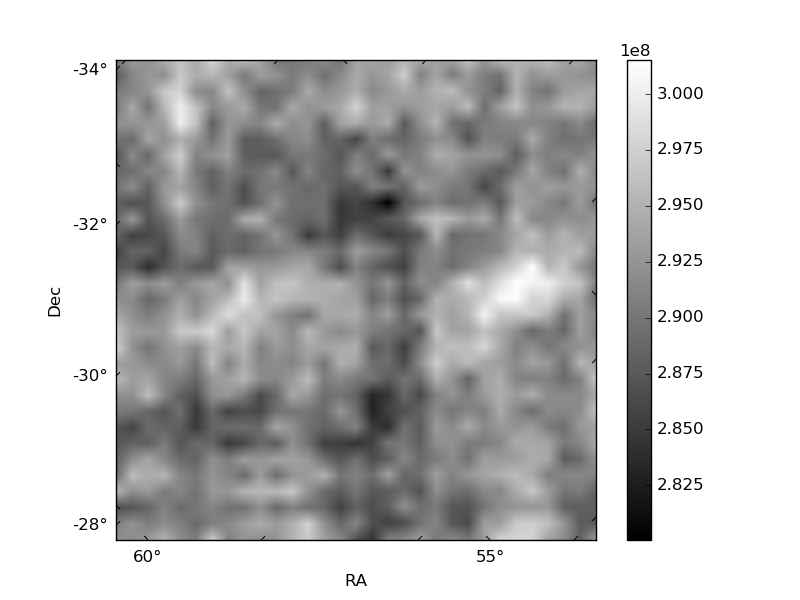
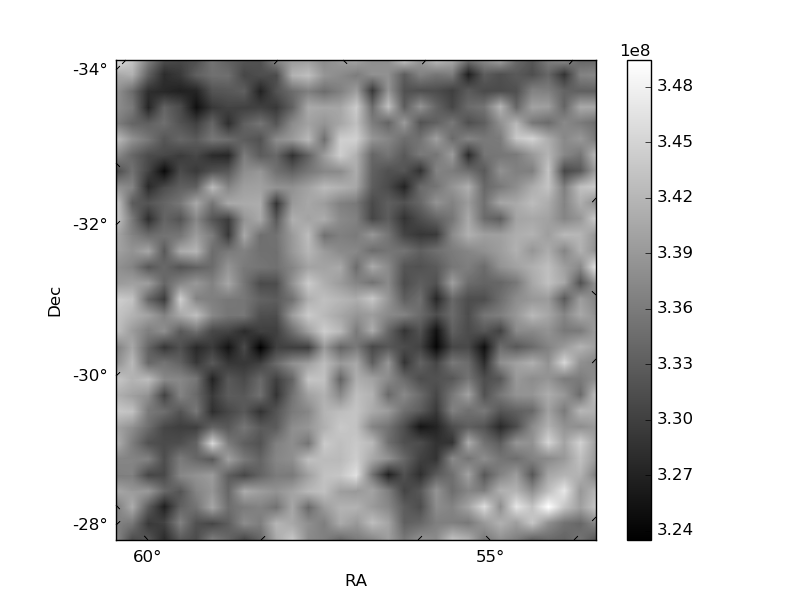
Histogram calculated using DETX and DETY for each event in the final _common_clean file
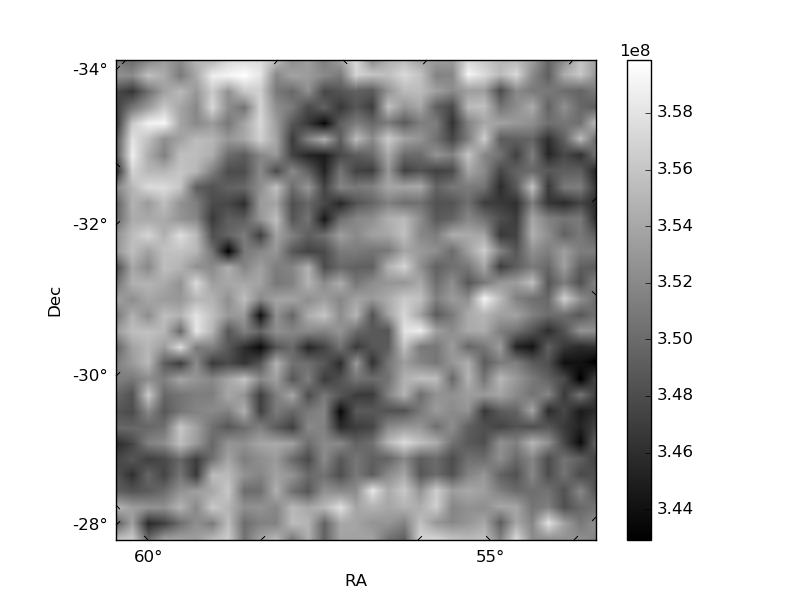
| Quadrant A | 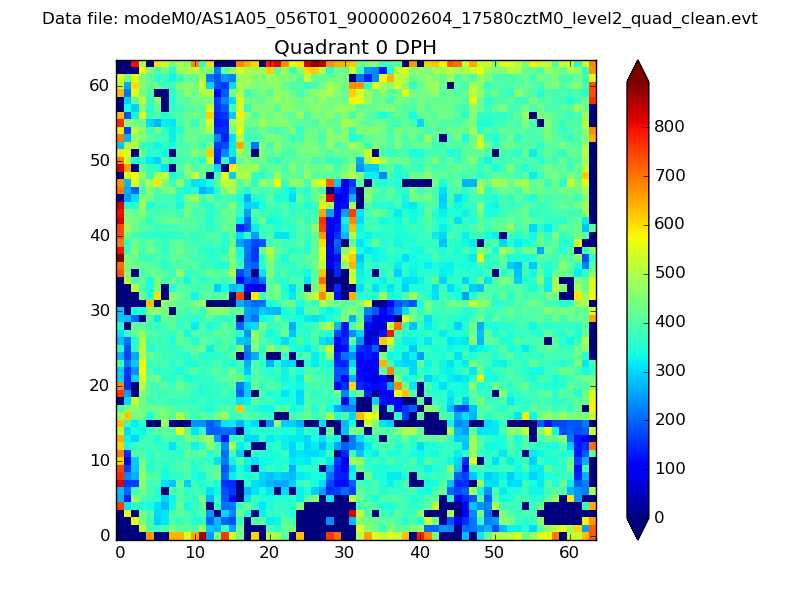 |
 |
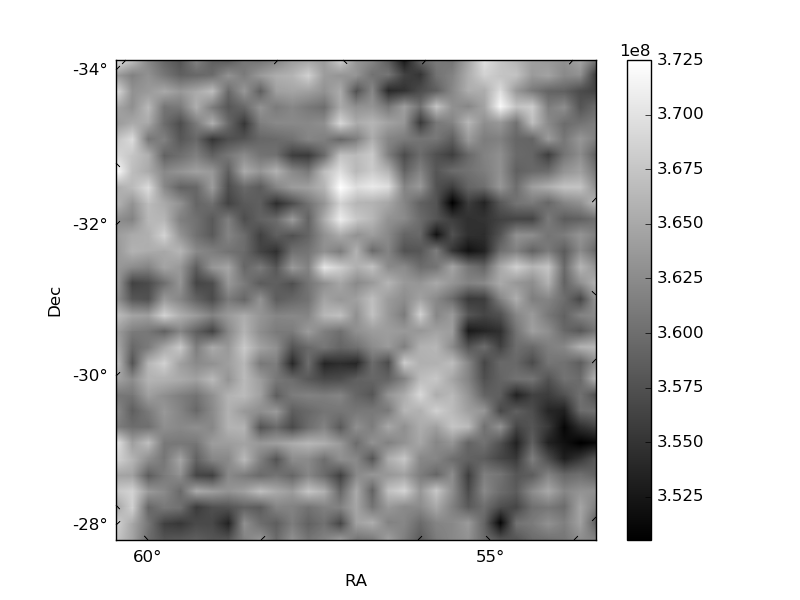
Quadrant B |
|---|---|---|---|
| Quadrant D | 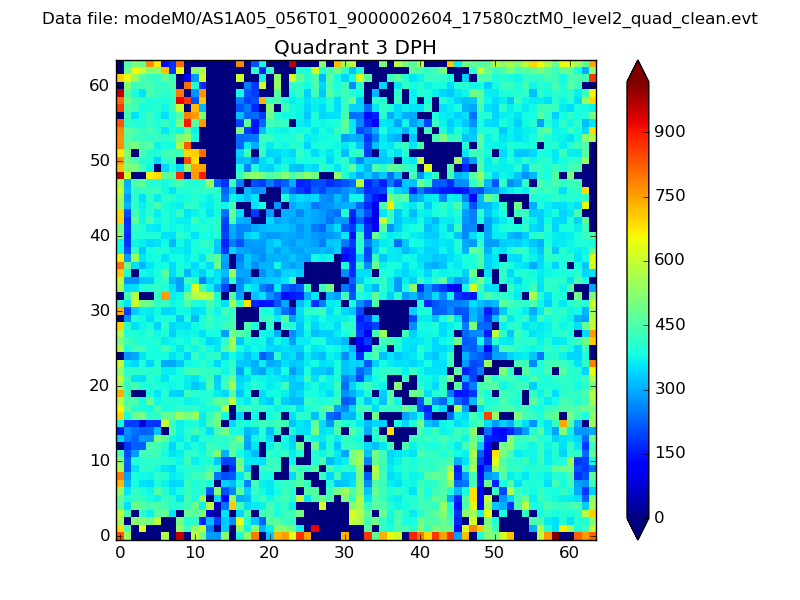 |
 |
Quadrant C |
| Plot type | Count rate plots | Images |
|---|---|---|
| Comparison with Poisson distribution Blue bars denote a histogram of data divided into 1 sec bins. Red curve is a Poisson curve with rate = median count rate of data. |
 |
 |
| Quadrant-wise count rates Data is divided into 100 sec bins |
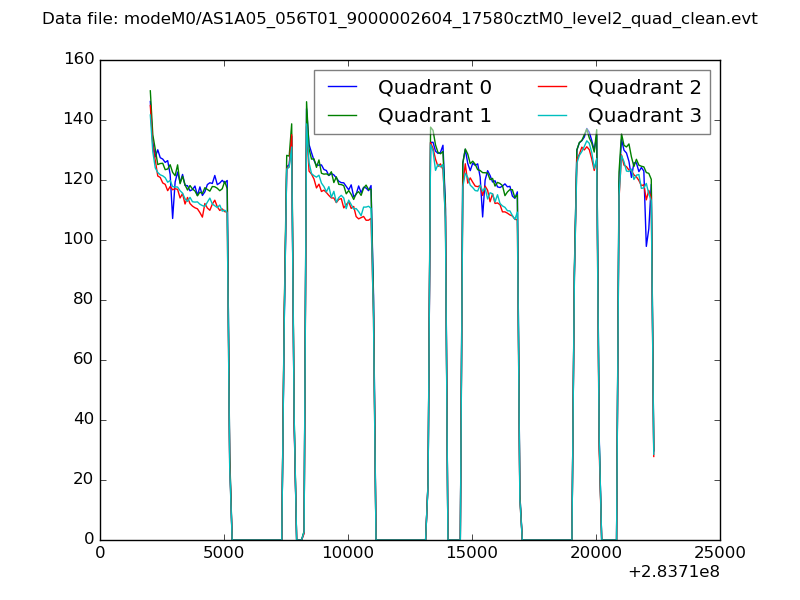 |
|
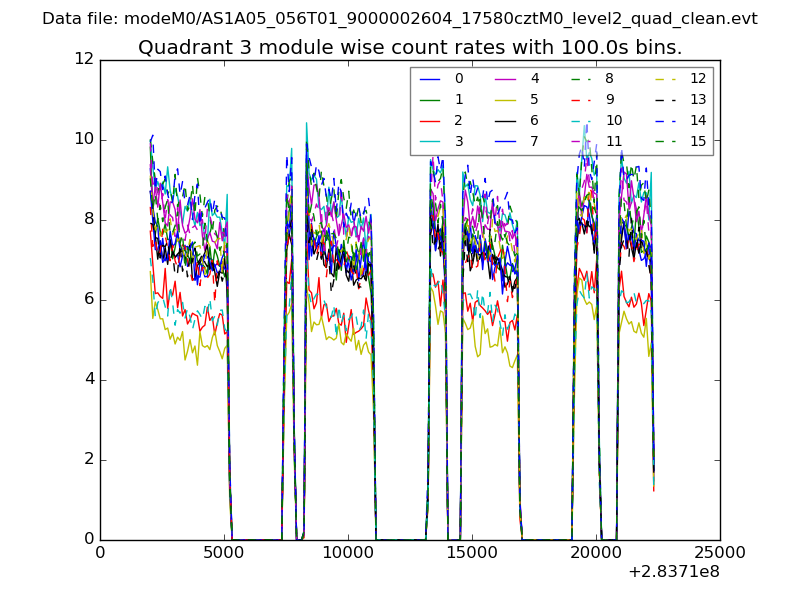
| Module-wise count rates for Quadrant A Data is divided into 100 sec bins |
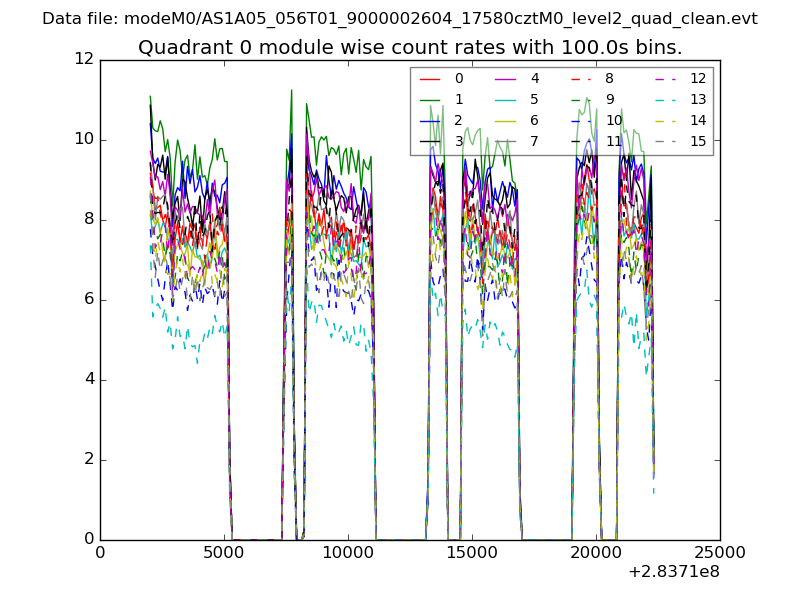 |
 |
| Module-wise count rates for Quadrant B Data is divided into 100 sec bins |
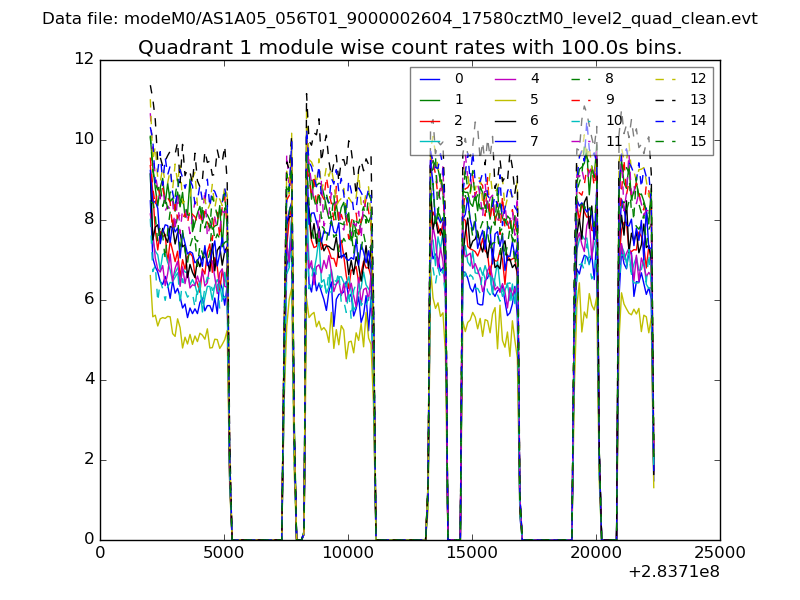 |
 |
| Module-wise count rates for Quadrant C Data is divided into 100 sec bins |
 |
 |
| Module-wise count rates for Quadrant D Data is divided into 100 sec bins |
 |
 |
| Parameter | Plot |
|---|---|
| CZT HV Monitor |  |
| D_VDD | 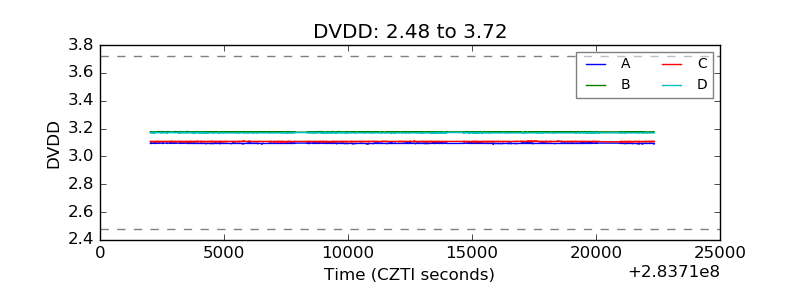 |
| Temperature 1 | 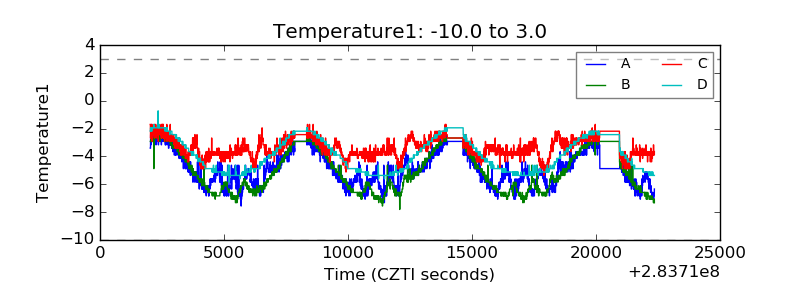 |
| Veto HV Monitor | 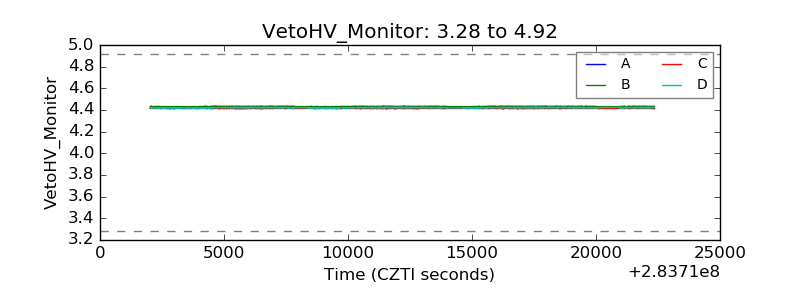 |
| Veto LLD | 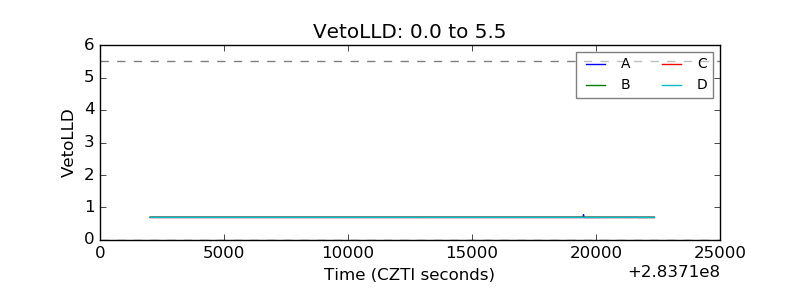 |
| Alpha Counter |  |
| _CPM_Rate | 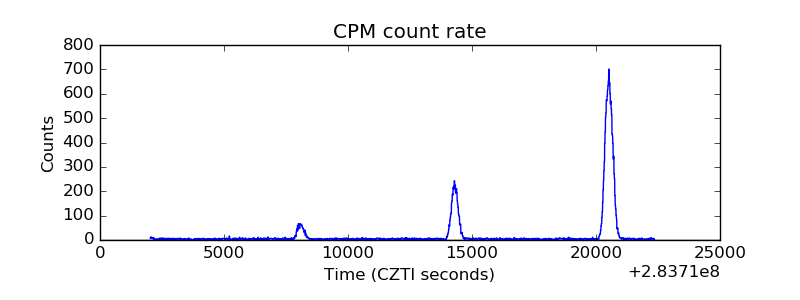 |
| CZT Counter | 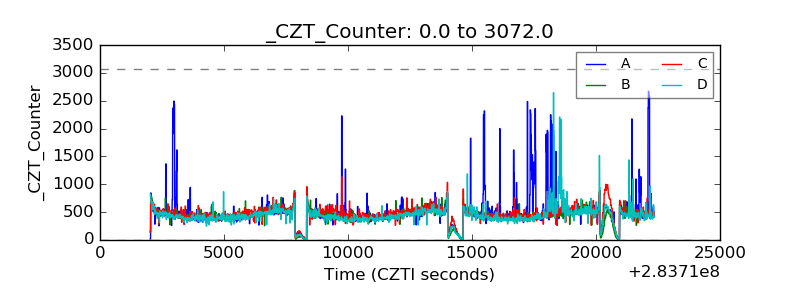 |
| +2.5 Volts monitor |  |
| +5 Volts monitor |  |
| _ROLL_ROT | 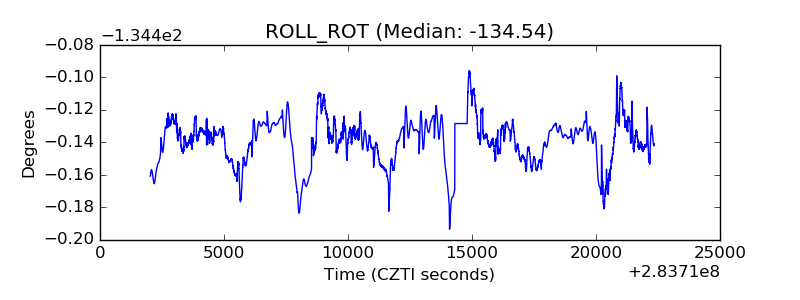 |
| _Roll_DEC | 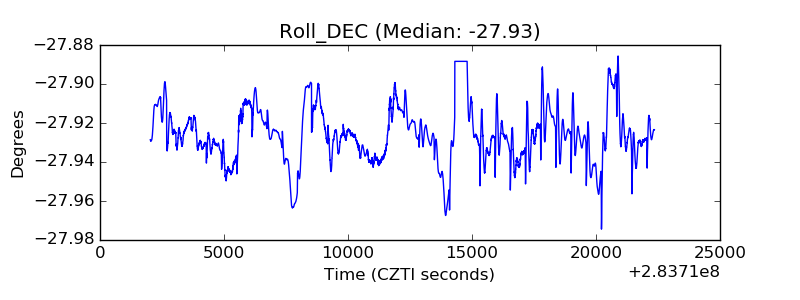 |
| _Roll_RA | 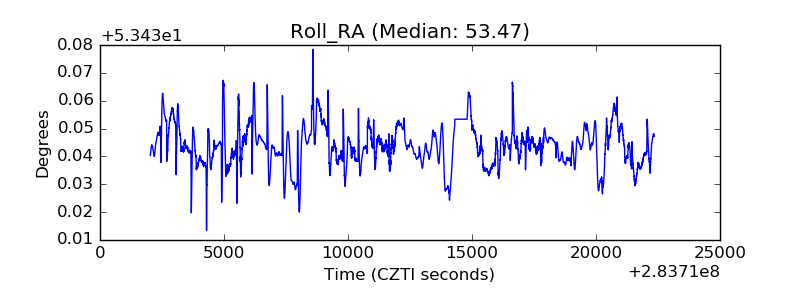 |
| Veto Counter | 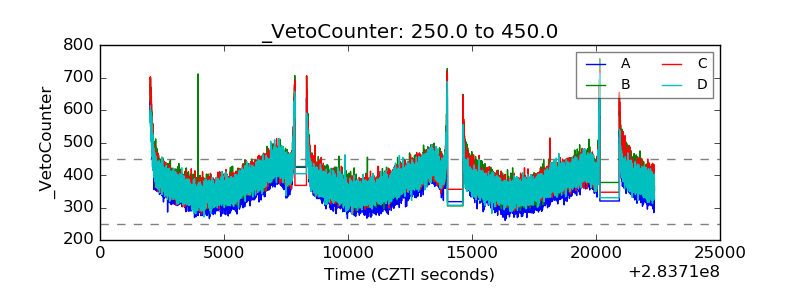 |