| Param | Original file | Final file |
|---|---|---|
| Filename | modeM0/AS1A05_056T01_9000002604_17581cztM0_level2.evt | modeM0/AS1A05_056T01_9000002604_17581cztM0_level2_quad_clean.evt |
| Size (bytes) | 472,101,120 | 91,699,200 |
| Size | 450.2 MB | 87.5 MB |
| Events in quadrant A | 3,447,327 | 586,653 |
| Events in quadrant B | 3,155,673 | 592,098 |
| Events in quadrant C | 3,351,321 | 564,115 |
| Events in quadrant D | 3,884,789 | 563,711 |
| Mode M9 | |||
|---|---|---|---|
| Quadrant | BADHDUFLAG | Total packets | Discarded packets |
| A | 0 | 13 | 0 |
| B | 0 | 14 | 0 |
| C | 0 | 14 | 0 |
| D | 0 | 14 | 0 |
| Mode M0 | |||
|---|---|---|---|
| Quadrant | BADHDUFLAG | Total packets | Discarded packets |
| A | 0 | 14667 | 2 |
| B | 0 | 13704 | 3 |
| C | 0 | 13857 | 2 |
| D | 0 | 16073 | 2 |
| Mode SS | |||
|---|---|---|---|
| Quadrant | BADHDUFLAG | Total packets | Discarded packets |
| A | 0 | 136 | 0 |
| B | 0 | 136 | 0 |
| C | 0 | 136 | 0 |
| D | 0 | 136 | 0 |
| Quadrant | Total seconds | Saturated seconds | Saturation percentage |
|---|---|---|---|
| A | 6752 | 92 | 1.362559% |
| B | 6751 | 21 | 0.311065% |
| C | 6751 | 41 | 0.607317% |
| D | 6751 | 233 | 3.451341% |
Noise dominated data is calculated using 1-second bins in cleaned event files. If a bin has >2000 counts, and if more than 50% of those come from <1% of pixels, then it is considered to be noise-dominated and hence unusable.
| Quadrant | # 1 sec bins | Bins with >0 counts | Bins with >2000 counts | High rate bins dominated by noise | Noise dominated (total time) | Noise dominated (detector-on time) | Marked lightcurve |
|---|---|---|---|---|---|---|---|
| A | 7697 | 6753 | 60 | 60 | 0.78% | 0.89% | 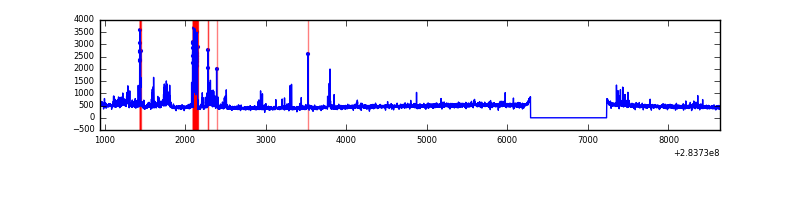 |
| B | 7696 | 6752 | 1 | 1 | 0.01% | 0.01% | 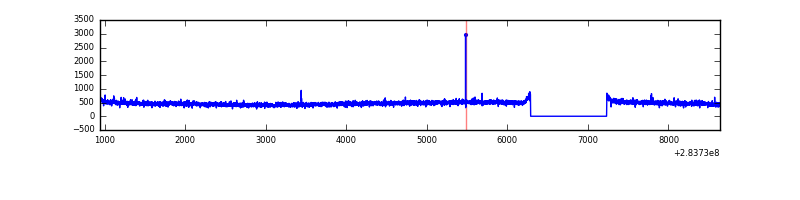 |
| C | 7696 | 6752 | 0 | 0 | 0.00% | 0.00% | 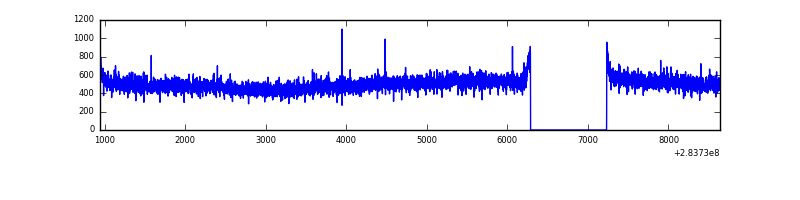 |
| D | 7696 | 6752 | 200 | 200 | 2.60% | 2.96% | 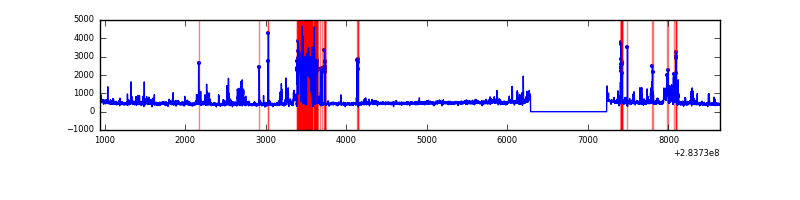 |
Top three noisy pixels from each quadrant. If the there are fewer than three noisy pixels in the level2.evt file, extra rows are filled as -1
| Pixel properties | Quadrant properties | ||||||
|---|---|---|---|---|---|---|---|
| Quadrant | DetID | PixID | Counts | Sigma | Mean | Median | Sigma |
| A | 14 | 237 | 372910 | 2294.49 | 797 | 779 | 162.2 |
| A | 0 | 226 | 6737 | 36.74 | 797 | 779 | 162.2 |
| A | 3 | 137 | 6005 | 32.22 | 797 | 779 | 162.2 |
| B | 12 | 111 | 19031 | 118.73 | 802 | 781 | 153.7 |
| B | 11 | 111 | 16456 | 101.97 | 802 | 781 | 153.7 |
| B | 14 | 111 | 14339 | 88.2 | 802 | 781 | 153.7 |
| C | 3 | 233 | 214252 | 1173.95 | 771 | 777 | 181.8 |
| C | 14 | 238 | 119894 | 655.05 | 771 | 777 | 181.8 |
| C | 5 | 218 | 6183 | 29.73 | 771 | 777 | 181.8 |
| D | 5 | 222 | 784022 | 4157.63 | 768 | 747 | 188.4 |
| D | 4 | 239 | 98156 | 517.05 | 768 | 747 | 188.4 |
| D | 13 | 189 | 84906 | 446.72 | 768 | 747 | 188.4 |
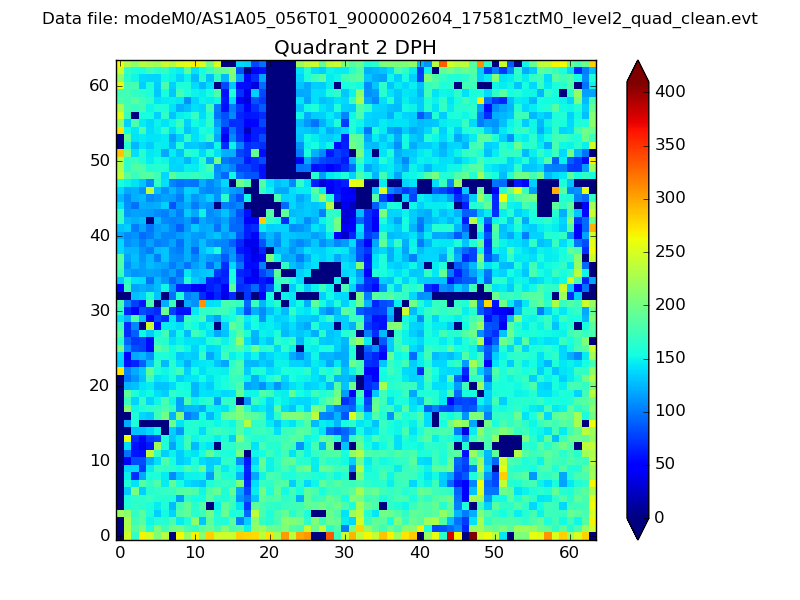
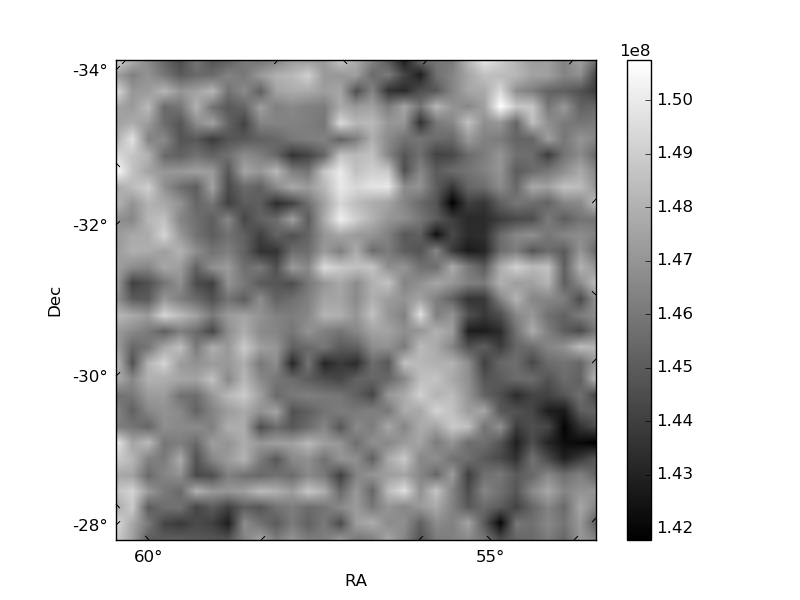
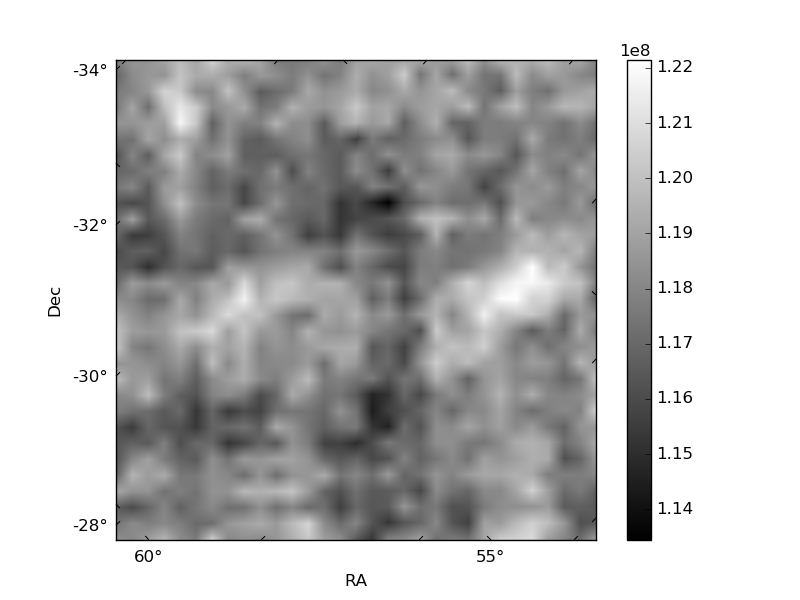
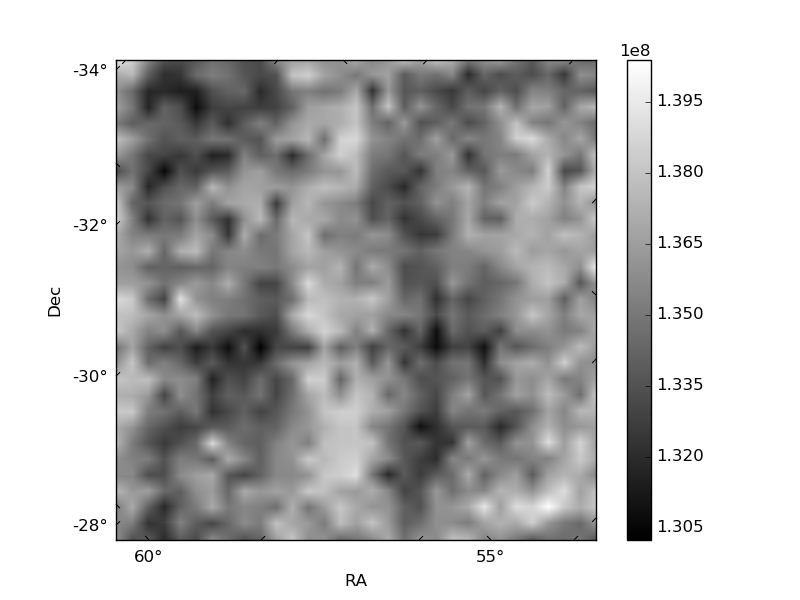
Histogram calculated using DETX and DETY for each event in the final _common_clean file
| Quadrant A | 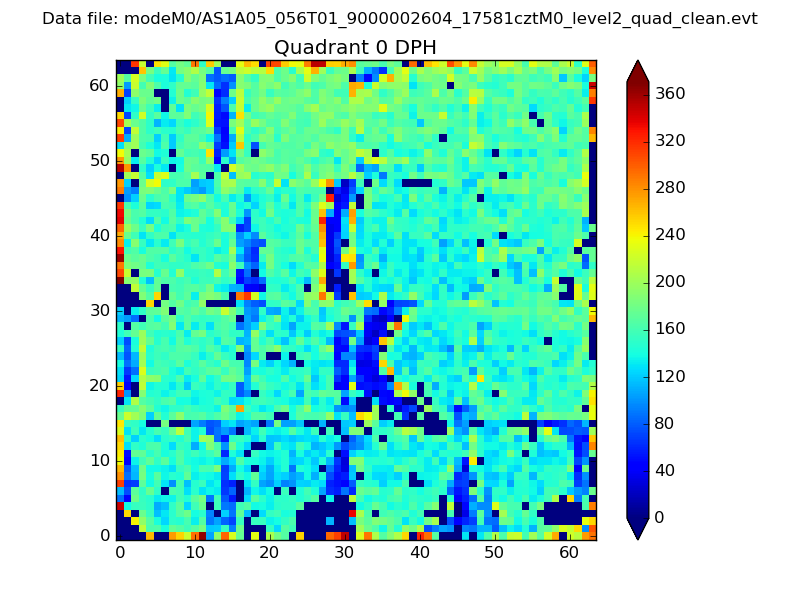 |
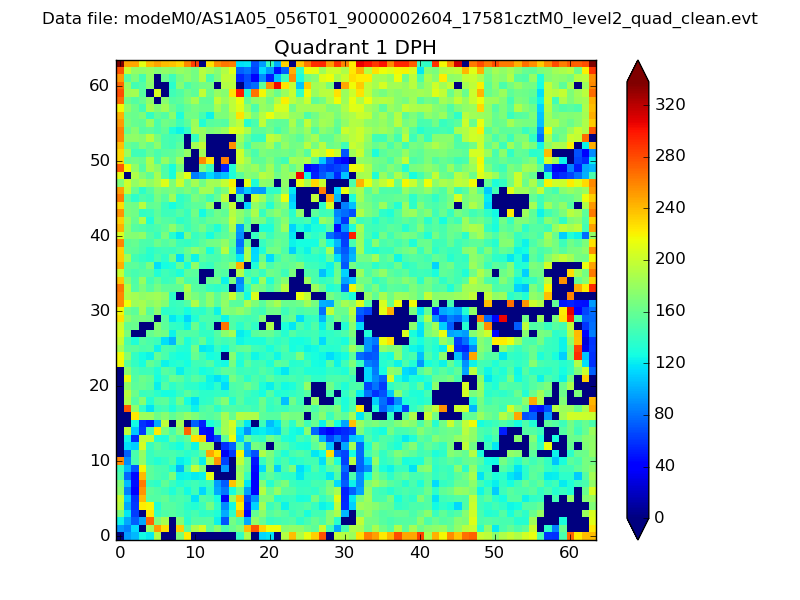 |
Quadrant B |
|---|---|---|---|
| Quadrant D | 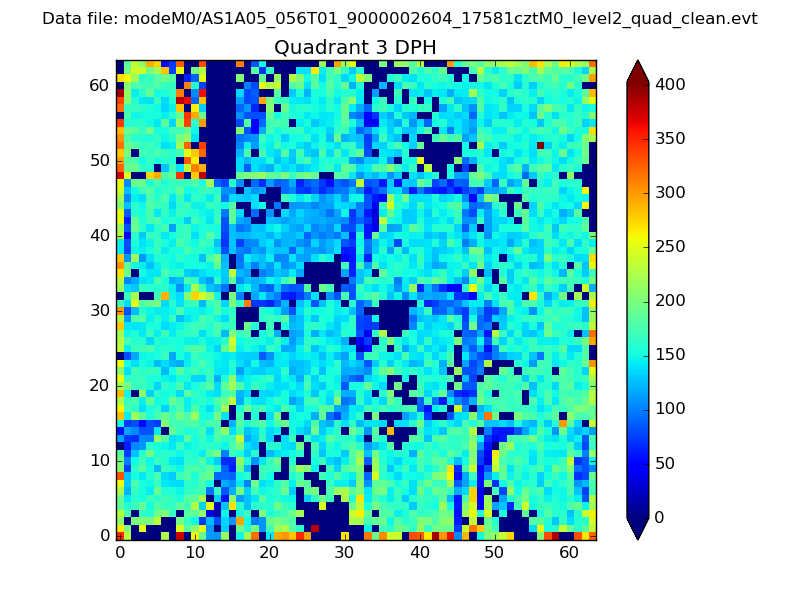 |
 |
Quadrant C |
| Plot type | Count rate plots | Images |
|---|---|---|
| Comparison with Poisson distribution Blue bars denote a histogram of data divided into 1 sec bins. Red curve is a Poisson curve with rate = median count rate of data. |
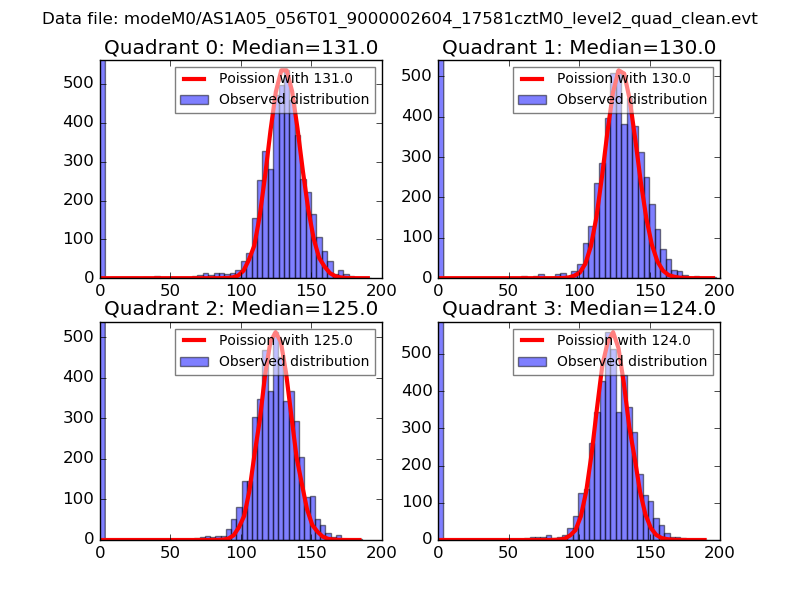 |
 |
| Quadrant-wise count rates Data is divided into 100 sec bins |
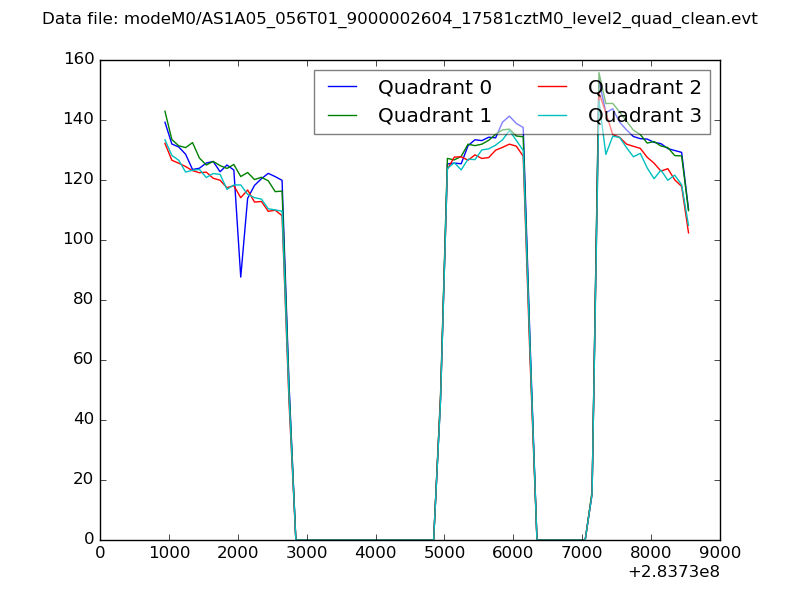 |
|
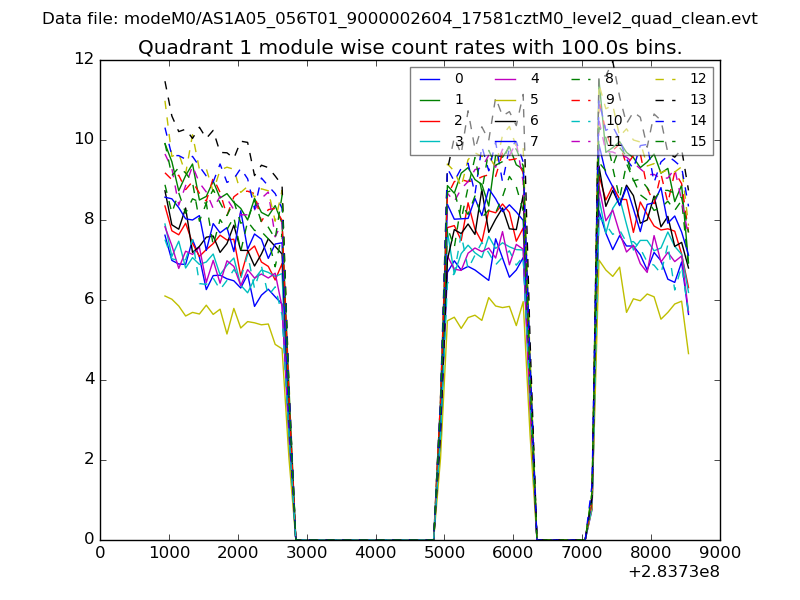
| Module-wise count rates for Quadrant A Data is divided into 100 sec bins |
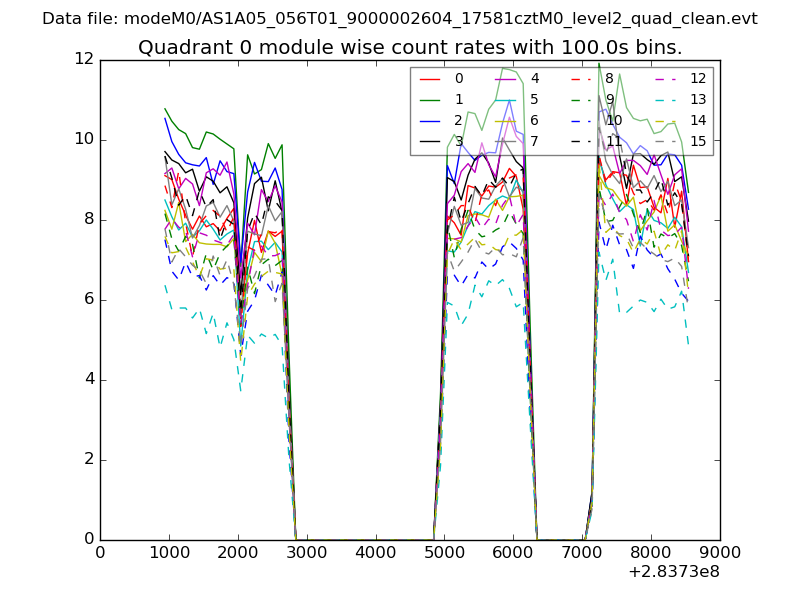 |
 |
| Module-wise count rates for Quadrant B Data is divided into 100 sec bins |
 |
 |
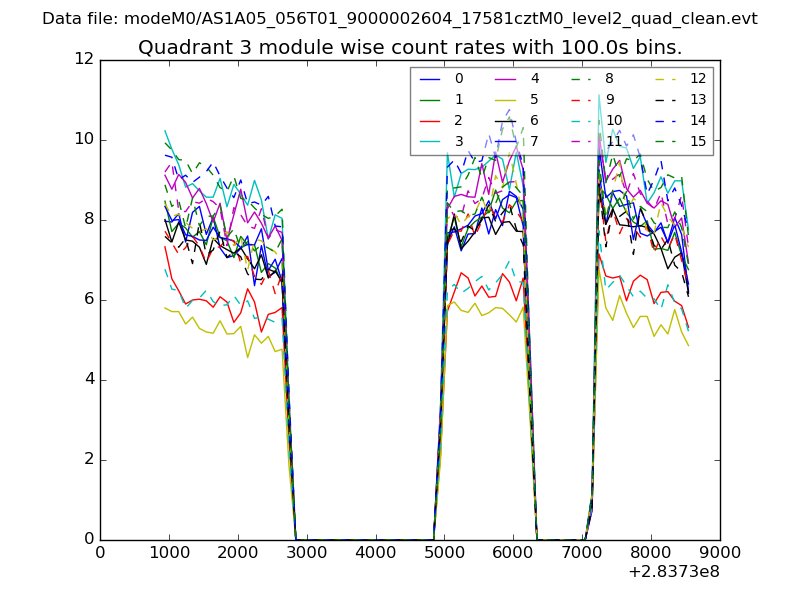
| Module-wise count rates for Quadrant C Data is divided into 100 sec bins |
 |
 |
| Module-wise count rates for Quadrant D Data is divided into 100 sec bins |
 |
 |
| Parameter | Plot |
|---|---|
| CZT HV Monitor | 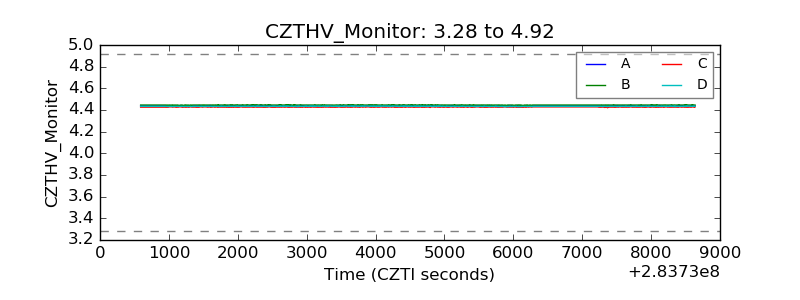 |
| D_VDD | 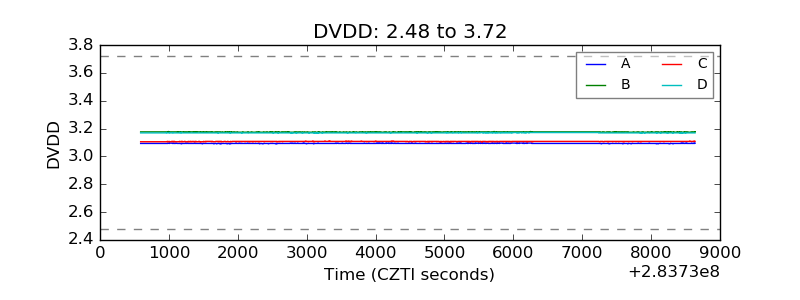 |
| Temperature 1 | 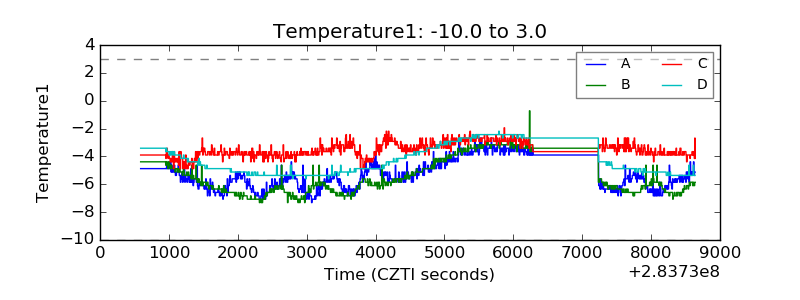 |
| Veto HV Monitor | 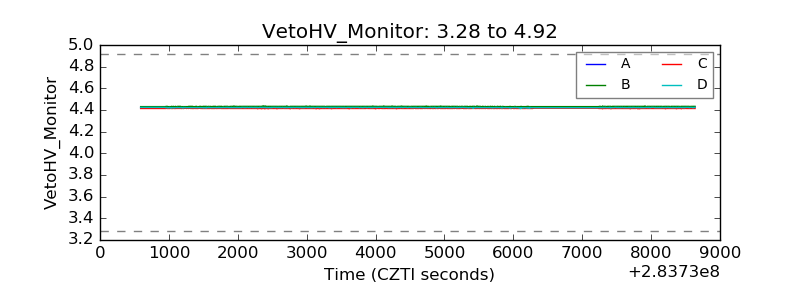 |
| Veto LLD | 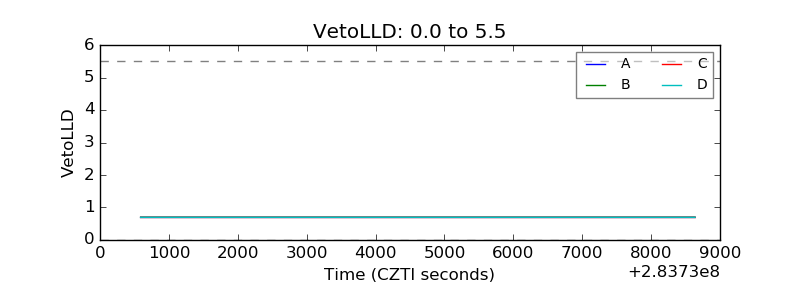 |
| Alpha Counter | 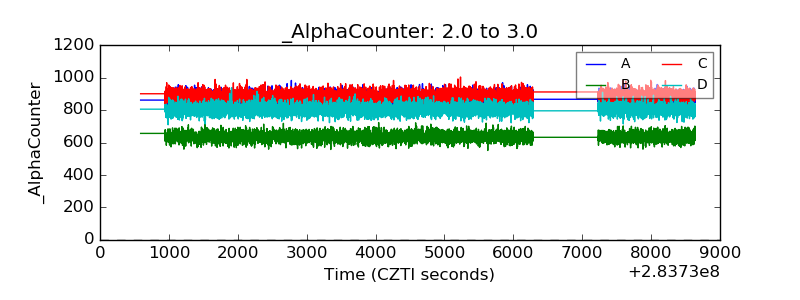 |
| _CPM_Rate | 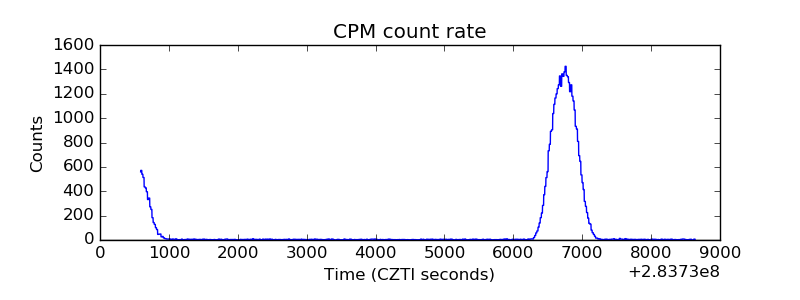 |
| CZT Counter | 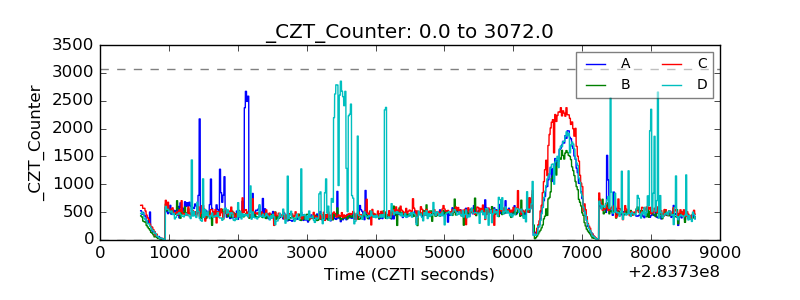 |
| +2.5 Volts monitor |  |
| +5 Volts monitor | 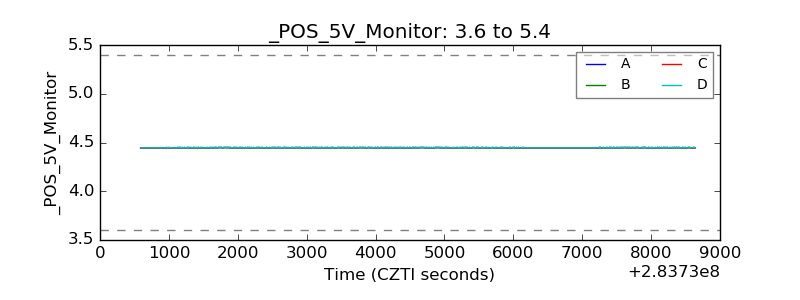 |
| _ROLL_ROT | 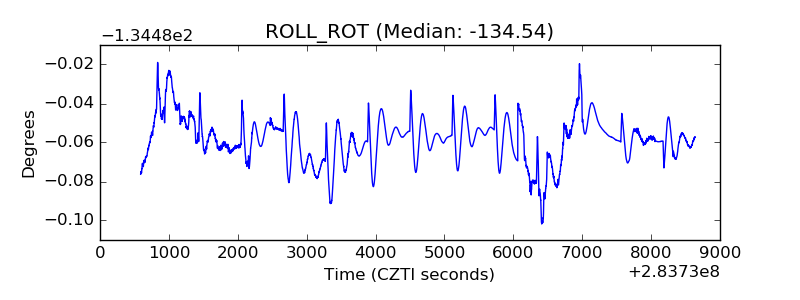 |
| _Roll_DEC | 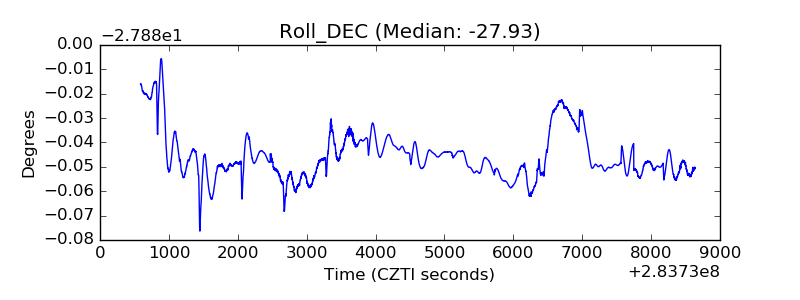 |
| _Roll_RA |  |
| Veto Counter | 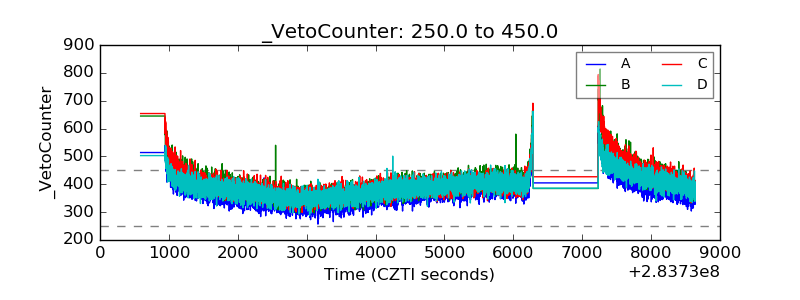 |