| Param | Original file | Final file |
|---|---|---|
| Filename | modeM0/AS1A05_056T01_9000002604_17583cztM0_level2.evt | modeM0/AS1A05_056T01_9000002604_17583cztM0_level2_quad_clean.evt |
| Size (bytes) | 472,472,640 | 94,034,880 |
| Size | 450.6 MB | 89.7 MB |
| Events in quadrant A | 3,318,474 | 604,985 |
| Events in quadrant B | 3,349,610 | 604,516 |
| Events in quadrant C | 3,619,882 | 578,977 |
| Events in quadrant D | 3,550,488 | 576,754 |
| Mode M9 | |||
|---|---|---|---|
| Quadrant | BADHDUFLAG | Total packets | Discarded packets |
| A | 0 | 21 | 0 |
| B | 0 | 21 | 0 |
| C | 0 | 21 | 0 |
| D | 0 | 21 | 0 |
| Mode M0 | |||
|---|---|---|---|
| Quadrant | BADHDUFLAG | Total packets | Discarded packets |
| A | 0 | 14249 | 2 |
| B | 0 | 14217 | 2 |
| C | 0 | 14717 | 2 |
| D | 0 | 15275 | 2 |
| Mode SS | |||
|---|---|---|---|
| Quadrant | BADHDUFLAG | Total packets | Discarded packets |
| A | 0 | 142 | 0 |
| B | 0 | 142 | 0 |
| C | 0 | 142 | 0 |
| D | 0 | 142 | 0 |
| Quadrant | Total seconds | Saturated seconds | Saturation percentage |
|---|---|---|---|
| A | 6927 | 26 | 0.375343% |
| B | 6927 | 37 | 0.534142% |
| C | 6927 | 64 | 0.923921% |
| D | 6927 | 49 | 0.707377% |
Noise dominated data is calculated using 1-second bins in cleaned event files. If a bin has >2000 counts, and if more than 50% of those come from <1% of pixels, then it is considered to be noise-dominated and hence unusable.
| Quadrant | # 1 sec bins | Bins with >0 counts | Bins with >2000 counts | High rate bins dominated by noise | Noise dominated (total time) | Noise dominated (detector-on time) | Marked lightcurve |
|---|---|---|---|---|---|---|---|
| A | 8967 | 6929 | 4 | 4 | 0.04% | 0.06% | 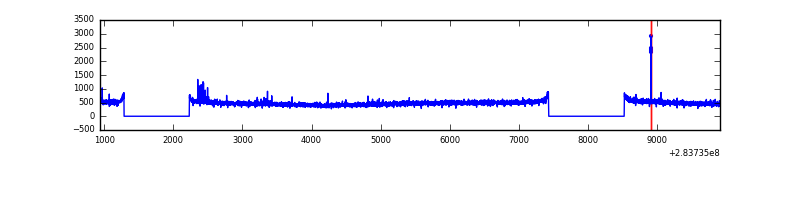 |
| B | 8967 | 6929 | 0 | 0 | 0.00% | 0.00% | 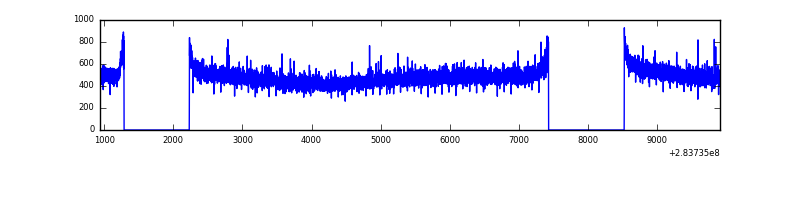 |
| C | 8967 | 6929 | 0 | 0 | 0.00% | 0.00% | 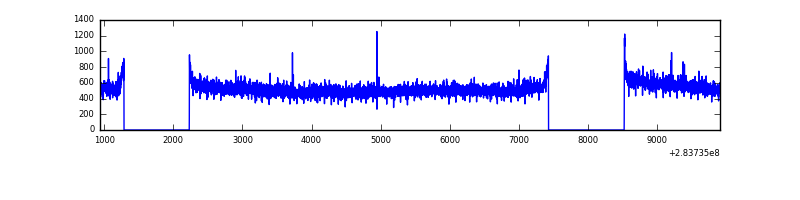 |
| D | 8967 | 6929 | 30 | 30 | 0.33% | 0.43% | 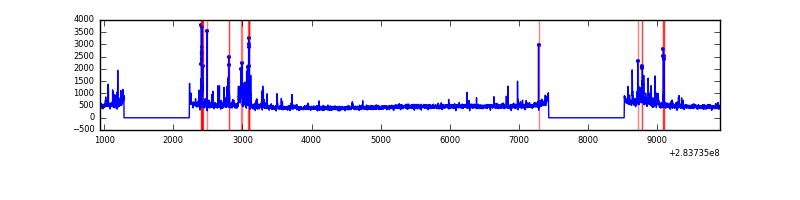 |
Top three noisy pixels from each quadrant. If the there are fewer than three noisy pixels in the level2.evt file, extra rows are filled as -1
| Pixel properties | Quadrant properties | ||||||
|---|---|---|---|---|---|---|---|
| Quadrant | DetID | PixID | Counts | Sigma | Mean | Median | Sigma |
| A | 14 | 237 | 43732 | 251.55 | 852 | 836 | 170.5 |
| A | 0 | 226 | 7303 | 37.92 | 852 | 836 | 170.5 |
| A | 3 | 137 | 6196 | 31.43 | 852 | 836 | 170.5 |
| B | 12 | 111 | 19767 | 115.65 | 854 | 832 | 163.7 |
| B | 11 | 111 | 16897 | 98.12 | 854 | 832 | 163.7 |
| B | 14 | 111 | 14955 | 86.26 | 854 | 832 | 163.7 |
| C | 3 | 233 | 258791 | 1323.1 | 824 | 828 | 195.0 |
| C | 14 | 238 | 127930 | 651.91 | 824 | 828 | 195.0 |
| C | 5 | 218 | 17460 | 85.3 | 824 | 828 | 195.0 |
| D | 5 | 222 | 217346 | 1071.25 | 831 | 805 | 202.1 |
| D | 13 | 189 | 177632 | 874.78 | 831 | 805 | 202.1 |
| D | 2 | 234 | 24070 | 115.09 | 831 | 805 | 202.1 |
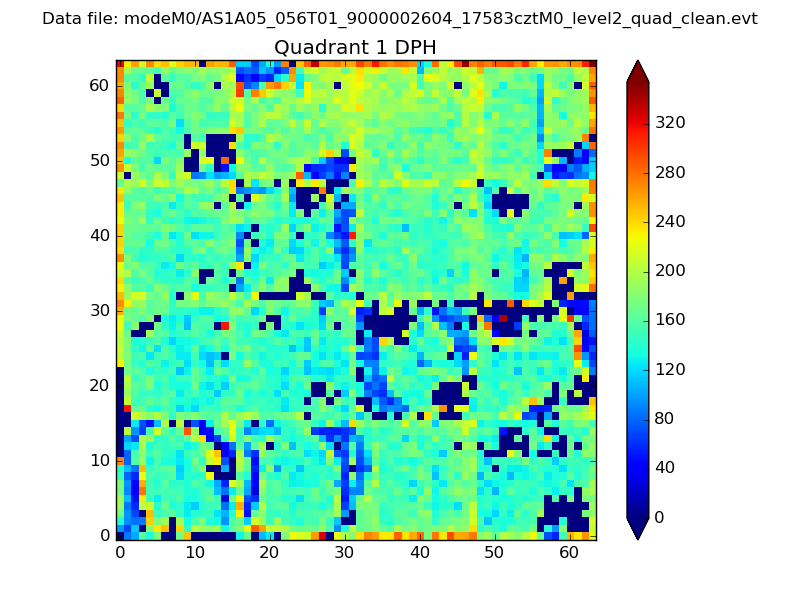
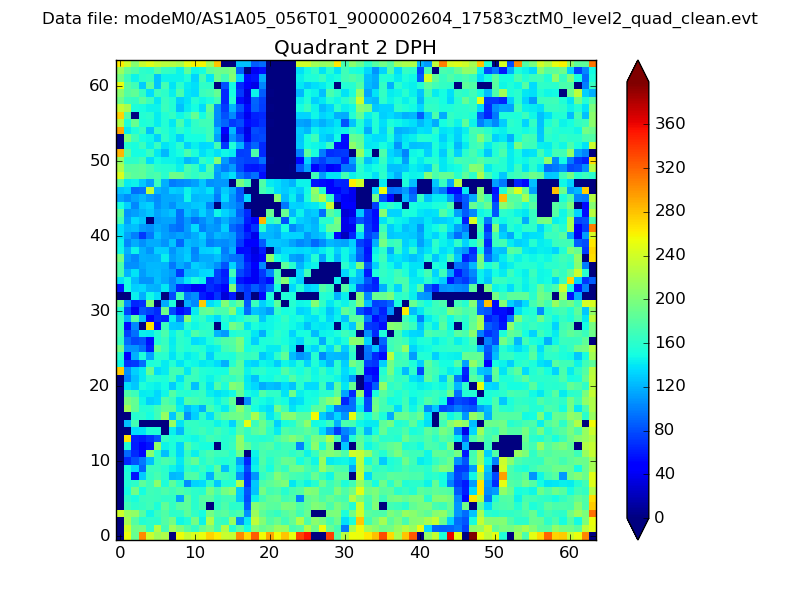
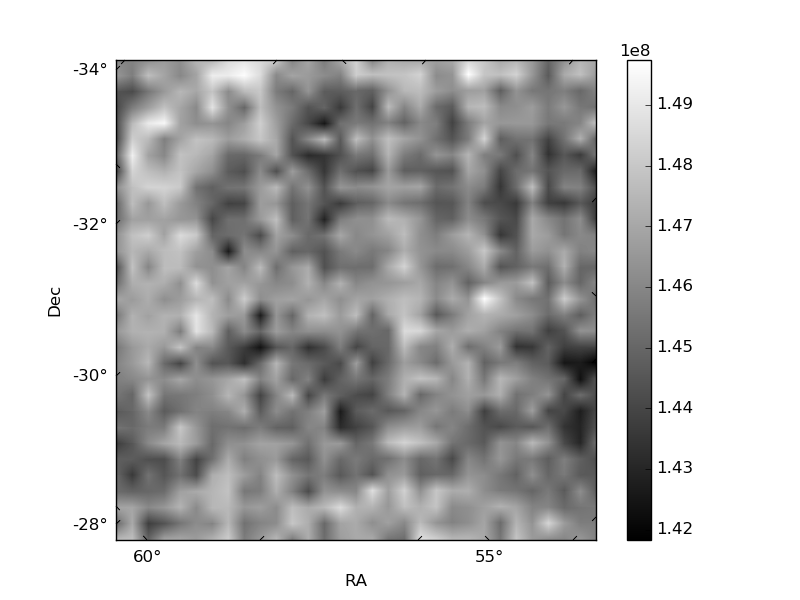
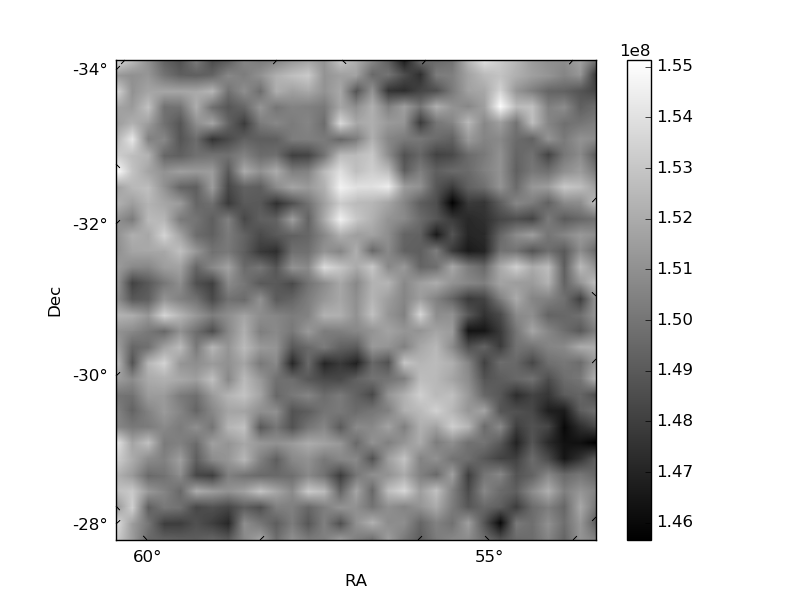
Histogram calculated using DETX and DETY for each event in the final _common_clean file
| Quadrant A |  |
 |
Quadrant B |
|---|---|---|---|
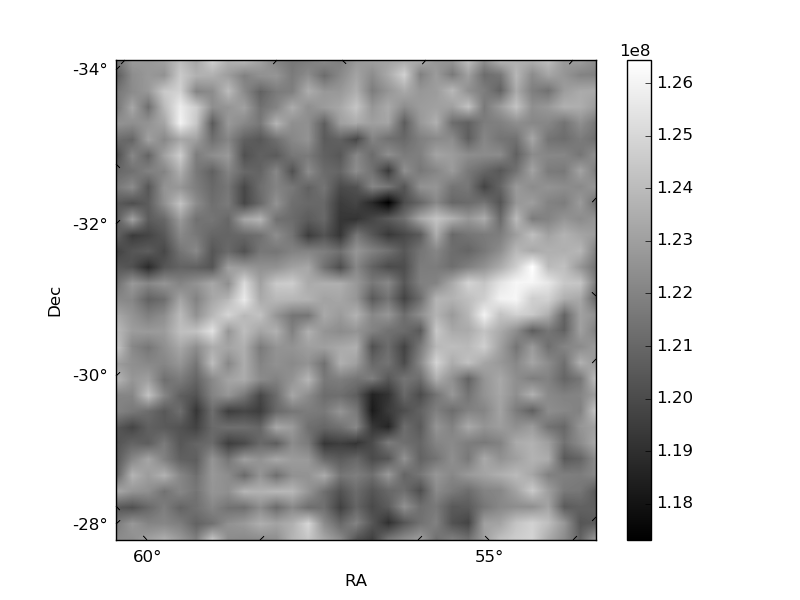
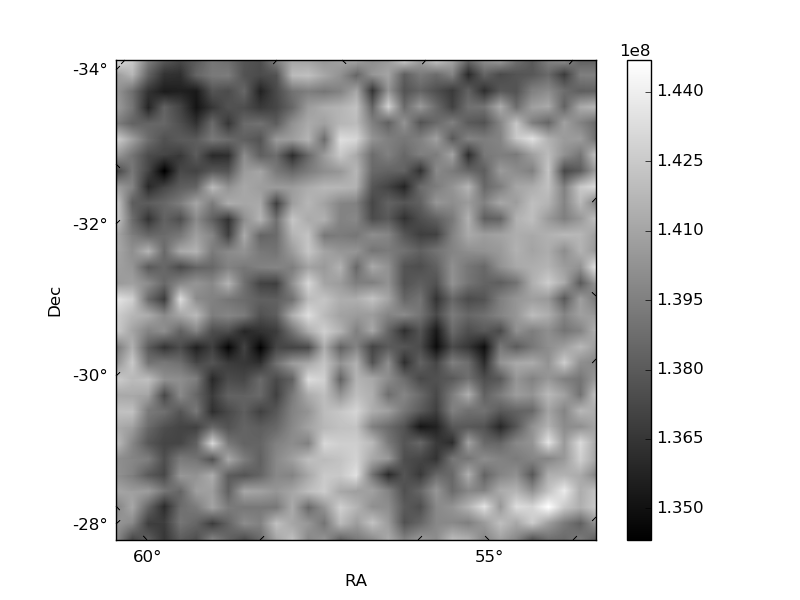
| Quadrant D |  |
 |
Quadrant C |
| Plot type | Count rate plots | Images |
|---|---|---|
| Comparison with Poisson distribution Blue bars denote a histogram of data divided into 1 sec bins. Red curve is a Poisson curve with rate = median count rate of data. |
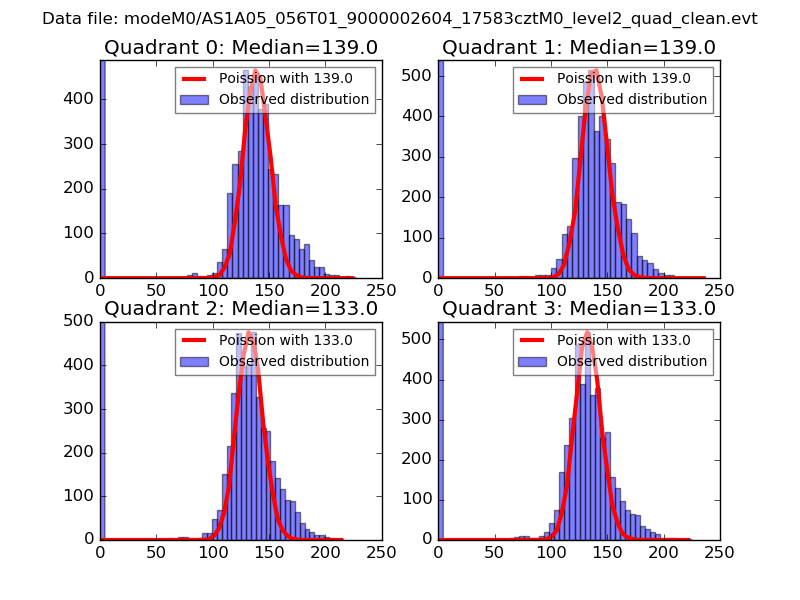 |
 |
| Quadrant-wise count rates Data is divided into 100 sec bins |
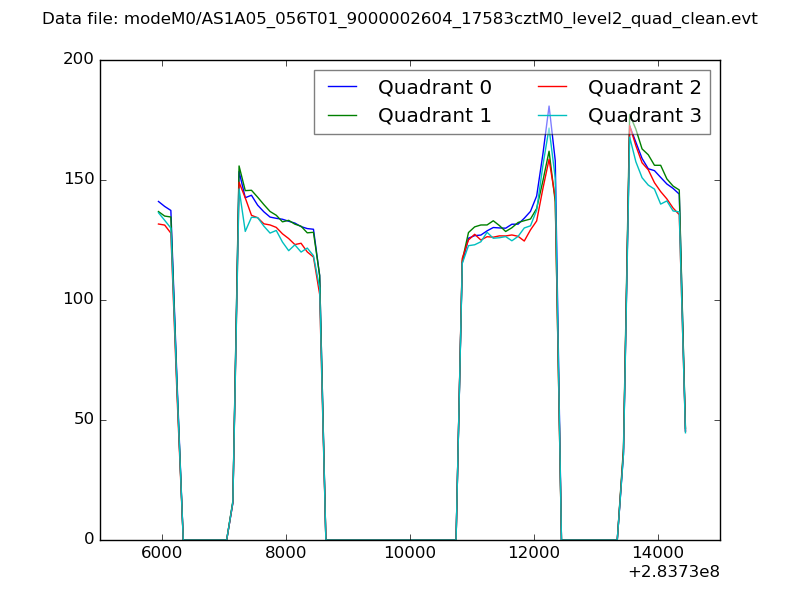 |
|
| Module-wise count rates for Quadrant A Data is divided into 100 sec bins |
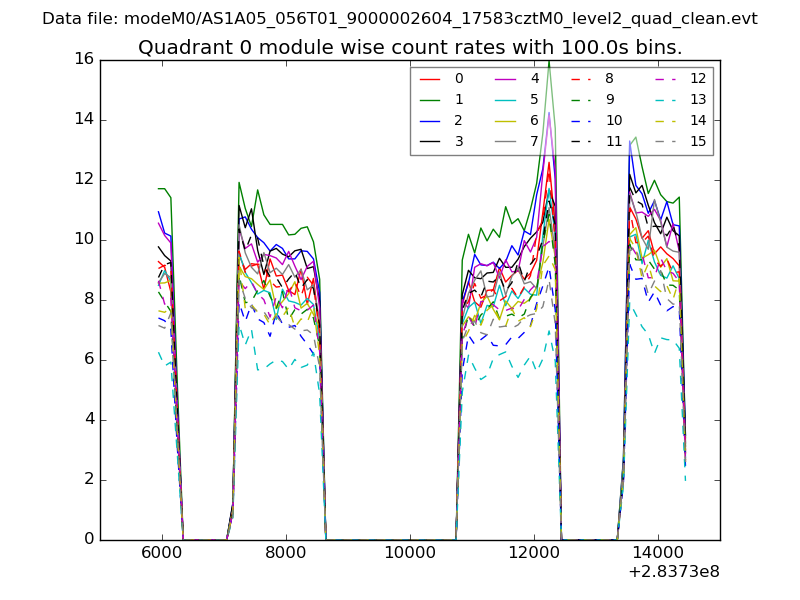 |
 |
| Module-wise count rates for Quadrant B Data is divided into 100 sec bins |
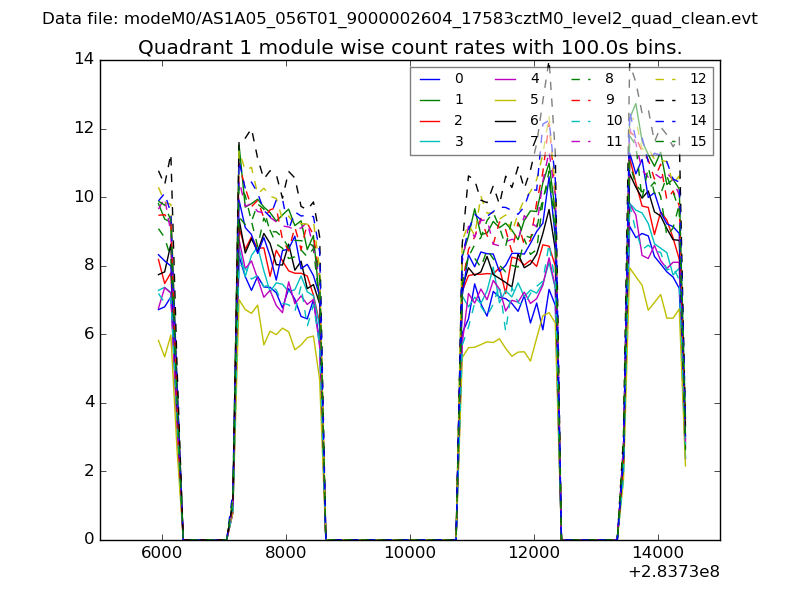 |
 |
| Module-wise count rates for Quadrant C Data is divided into 100 sec bins |
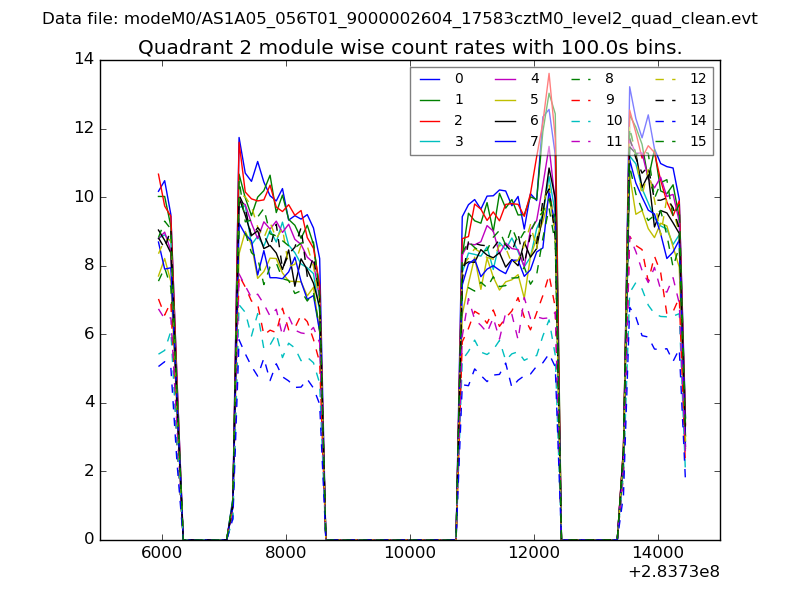 |
 |
| Module-wise count rates for Quadrant D Data is divided into 100 sec bins |
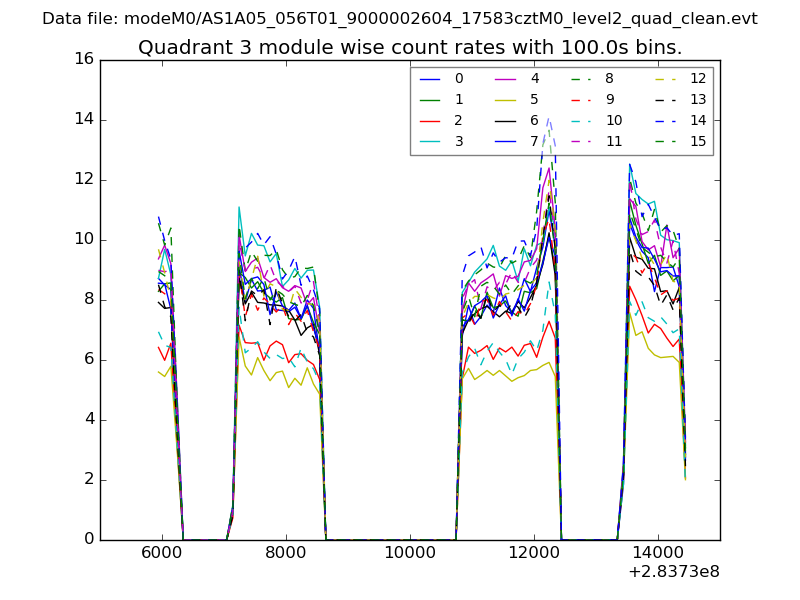 |
 |
| Parameter | Plot |
|---|---|
| CZT HV Monitor | 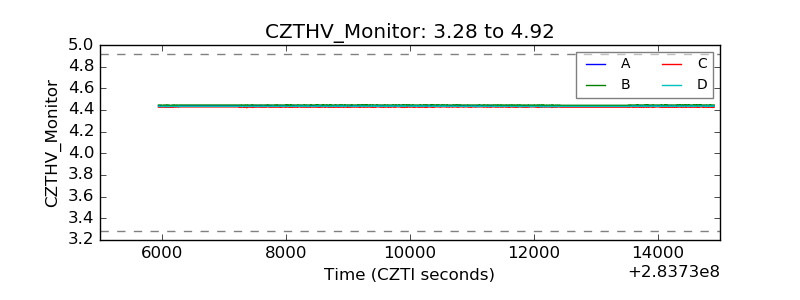 |
| D_VDD | 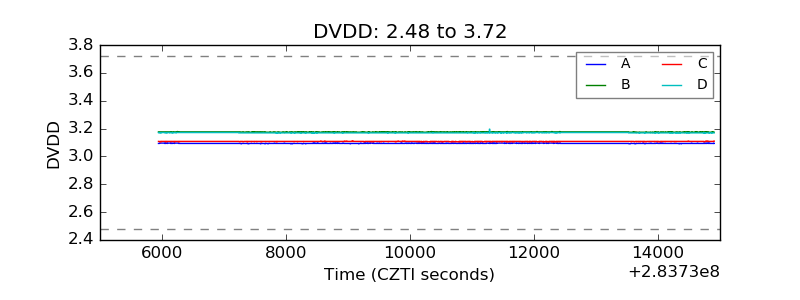 |
| Temperature 1 | 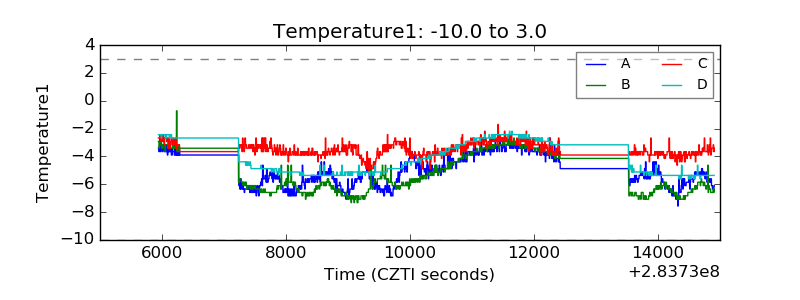 |
| Veto HV Monitor | 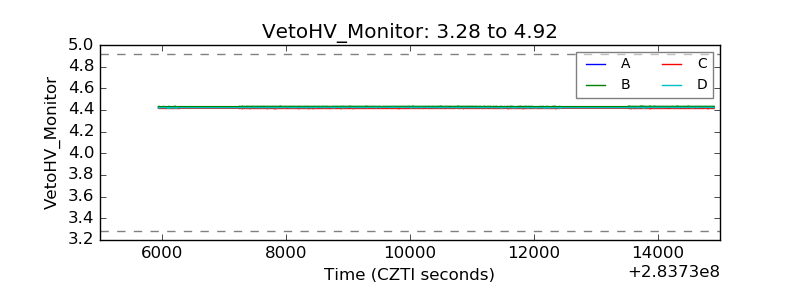 |
| Veto LLD | 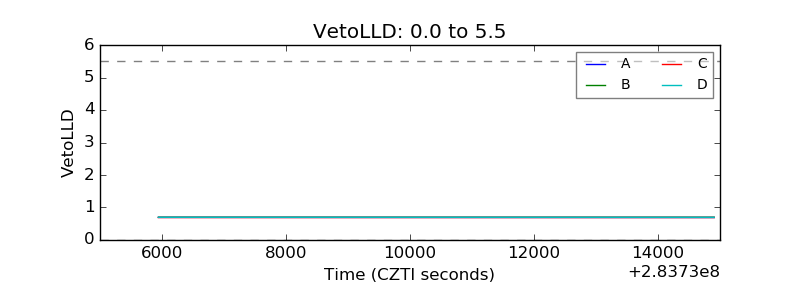 |
| Alpha Counter | 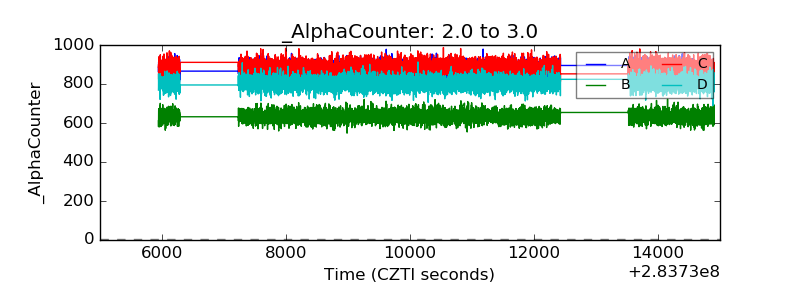 |
| _CPM_Rate | 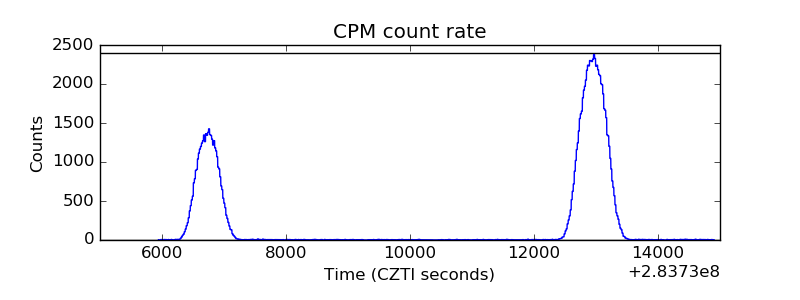 |
| CZT Counter |  |
| +2.5 Volts monitor |  |
| +5 Volts monitor | 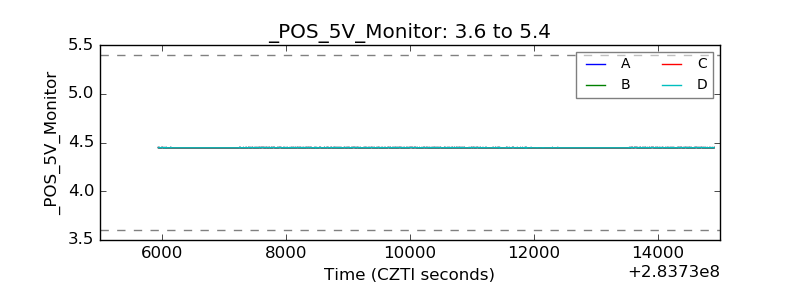 |
| _ROLL_ROT | 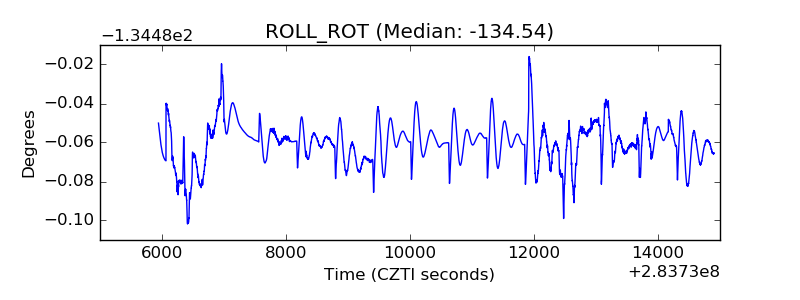 |
| _Roll_DEC | 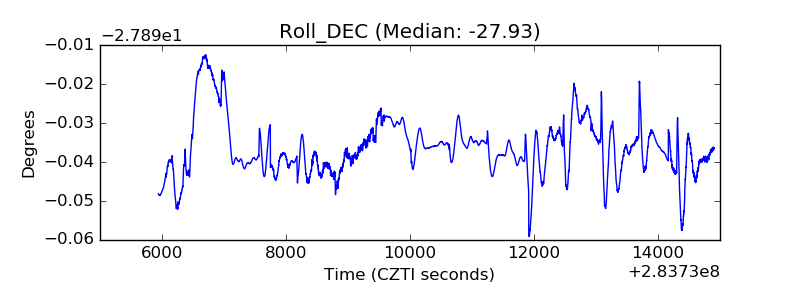 |
| _Roll_RA | 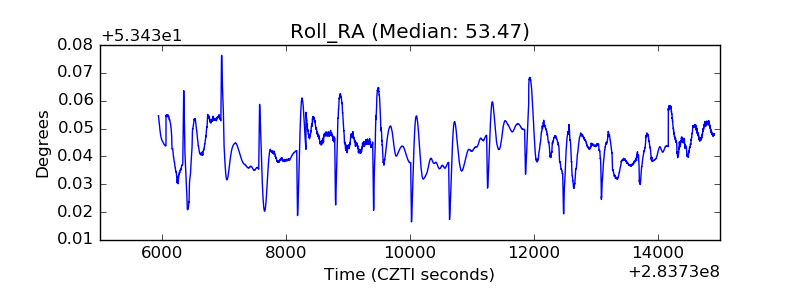 |
| Veto Counter | 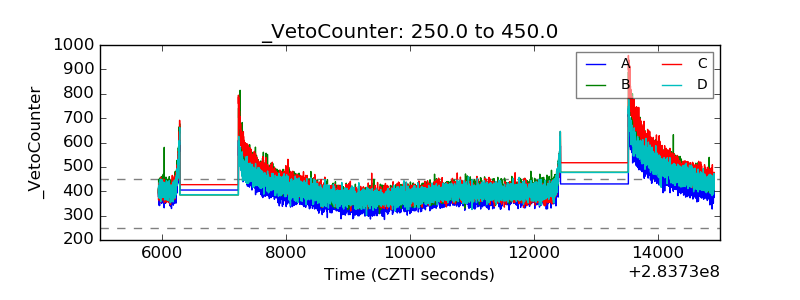 |