| Param | Original file | Final file |
|---|---|---|
| Filename | modeM0/AS1A05_056T01_9000002604_17584cztM0_level2.evt | modeM0/AS1A05_056T01_9000002604_17584cztM0_level2_quad_clean.evt |
| Size (bytes) | 451,316,160 | 79,790,400 |
| Size | 430.4 MB | 76.1 MB |
| Events in quadrant A | 3,165,137 | 499,841 |
| Events in quadrant B | 3,177,989 | 510,035 |
| Events in quadrant C | 3,430,776 | 487,407 |
| Events in quadrant D | 3,464,837 | 477,772 |
| Mode M9 | |||
|---|---|---|---|
| Quadrant | BADHDUFLAG | Total packets | Discarded packets |
| A | 0 | 18 | 0 |
| B | 0 | 19 | 0 |
| C | 0 | 19 | 0 |
| D | 0 | 19 | 0 |
| Mode M0 | |||
|---|---|---|---|
| Quadrant | BADHDUFLAG | Total packets | Discarded packets |
| A | 0 | 13278 | 2 |
| B | 0 | 13250 | 2 |
| C | 0 | 14012 | 2 |
| D | 0 | 14387 | 2 |
| Mode SS | |||
|---|---|---|---|
| Quadrant | BADHDUFLAG | Total packets | Discarded packets |
| A | 0 | 130 | 0 |
| B | 0 | 130 | 0 |
| C | 0 | 130 | 0 |
| D | 0 | 130 | 0 |
| Quadrant | Total seconds | Saturated seconds | Saturation percentage |
|---|---|---|---|
| A | 6315 | 55 | 0.870942% |
| B | 6315 | 61 | 0.965954% |
| C | 6315 | 73 | 1.155978% |
| D | 6315 | 78 | 1.235154% |
Noise dominated data is calculated using 1-second bins in cleaned event files. If a bin has >2000 counts, and if more than 50% of those come from <1% of pixels, then it is considered to be noise-dominated and hence unusable.
| Quadrant | # 1 sec bins | Bins with >0 counts | Bins with >2000 counts | High rate bins dominated by noise | Noise dominated (total time) | Noise dominated (detector-on time) | Marked lightcurve |
|---|---|---|---|---|---|---|---|
| A | 7485 | 6315 | 14 | 14 | 0.19% | 0.22% | 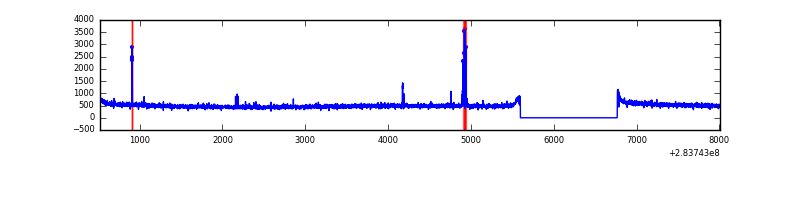 |
| B | 7485 | 6315 | 0 | 0 | 0.00% | 0.00% | 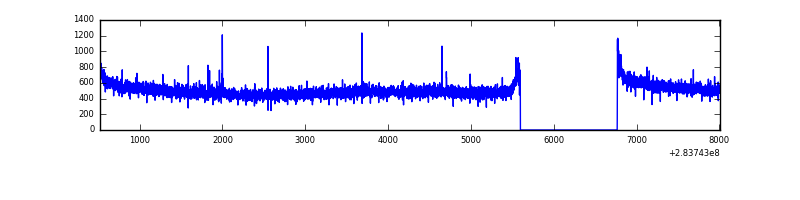 |
| C | 7485 | 6315 | 0 | 0 | 0.00% | 0.00% | 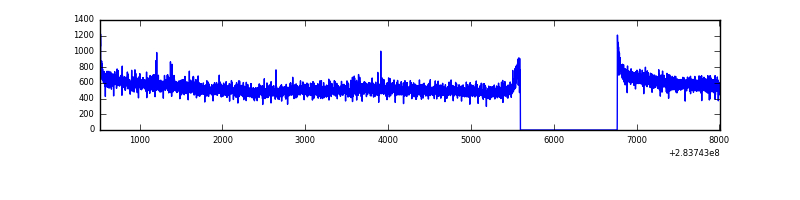 |
| D | 7485 | 6315 | 37 | 37 | 0.49% | 0.59% | 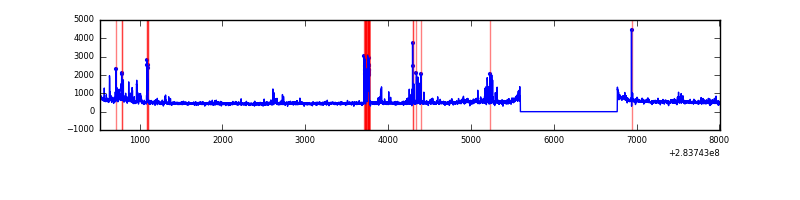 |
Top three noisy pixels from each quadrant. If the there are fewer than three noisy pixels in the level2.evt file, extra rows are filled as -1
| Pixel properties | Quadrant properties | ||||||
|---|---|---|---|---|---|---|---|
| Quadrant | DetID | PixID | Counts | Sigma | Mean | Median | Sigma |
| A | 15 | 174 | 40176 | 244.29 | 805 | 789 | 161.2 |
| A | 14 | 237 | 23826 | 142.88 | 805 | 789 | 161.2 |
| A | 0 | 13 | 8367 | 47.0 | 805 | 789 | 161.2 |
| B | 12 | 111 | 18501 | 116.48 | 812 | 792 | 152.0 |
| B | 11 | 111 | 15848 | 99.03 | 812 | 792 | 152.0 |
| B | 14 | 111 | 13939 | 86.47 | 812 | 792 | 152.0 |
| C | 3 | 233 | 182712 | 990.47 | 787 | 793 | 183.7 |
| C | 14 | 238 | 122483 | 662.55 | 787 | 793 | 183.7 |
| C | 5 | 218 | 48319 | 258.76 | 787 | 793 | 183.7 |
| D | 13 | 189 | 216268 | 1111.76 | 791 | 768 | 193.8 |
| D | 5 | 222 | 116113 | 595.06 | 791 | 768 | 193.8 |
| D | 1 | 52 | 114676 | 587.65 | 791 | 768 | 193.8 |
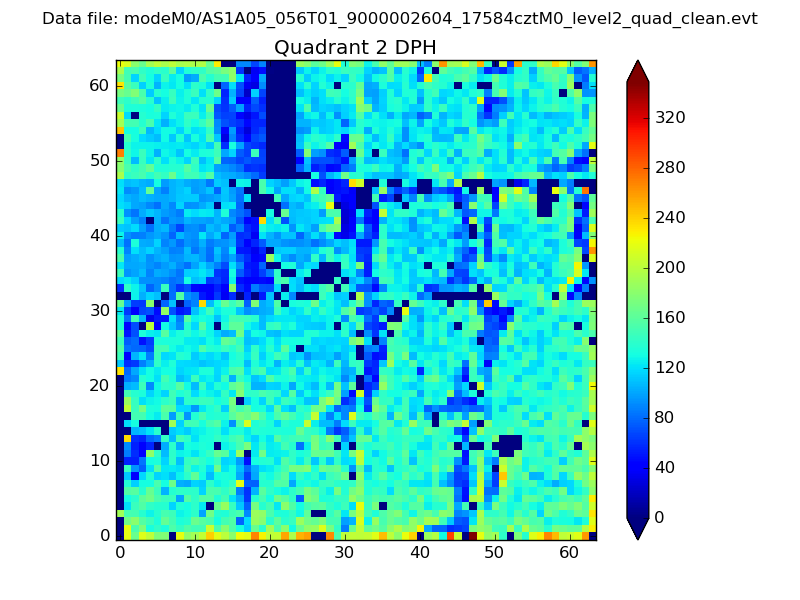
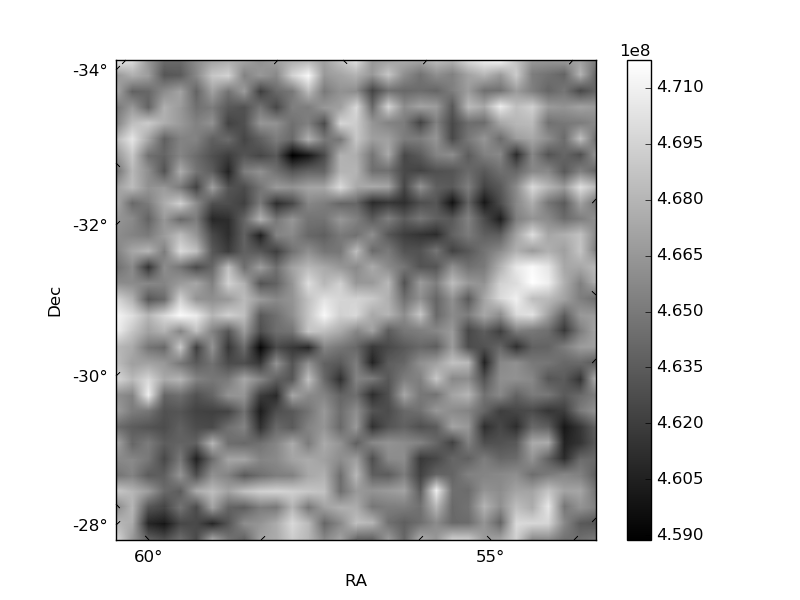
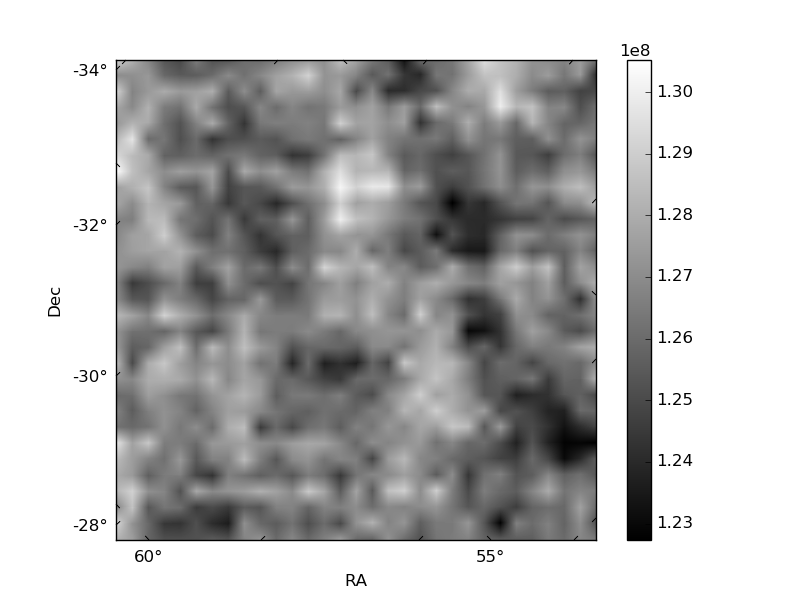
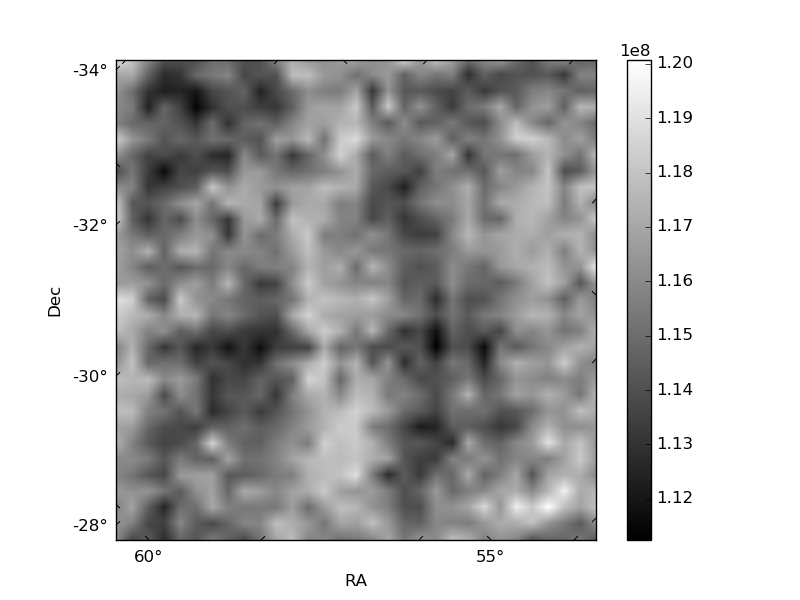
Histogram calculated using DETX and DETY for each event in the final _common_clean file
| Quadrant A | 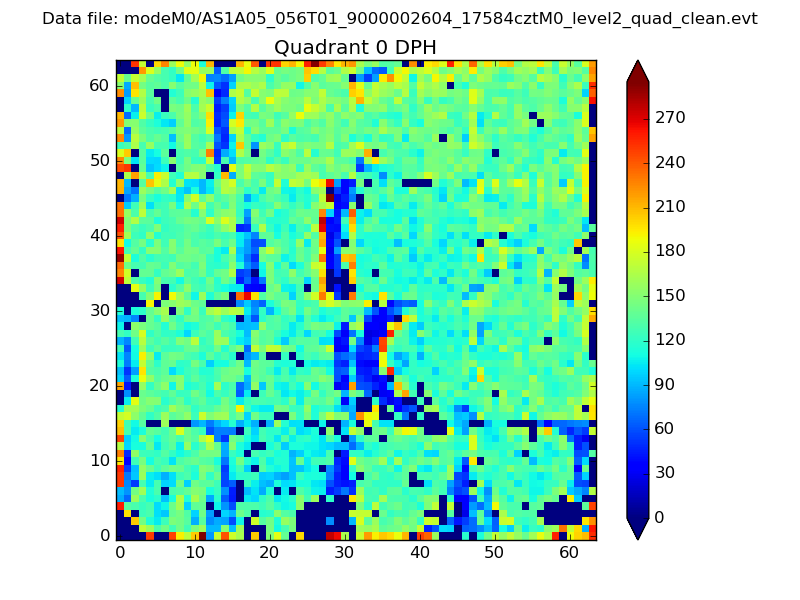 |
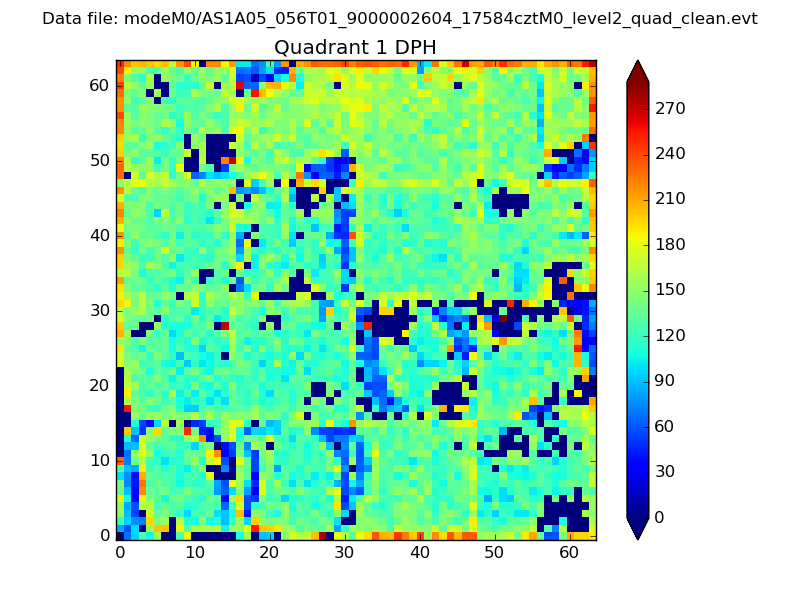 |
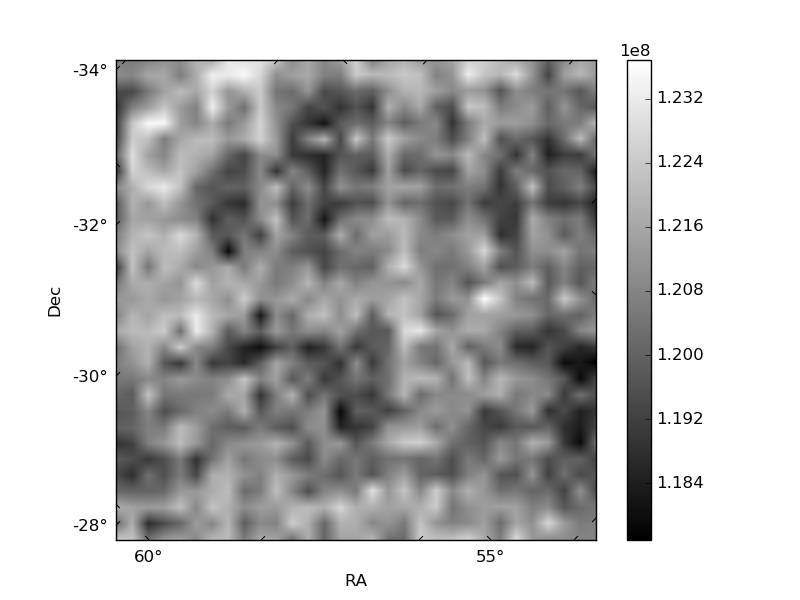
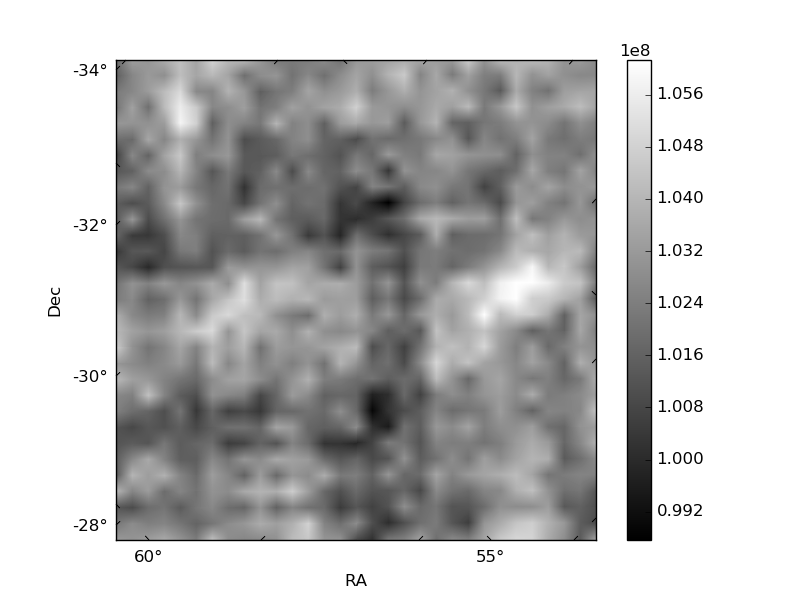
Quadrant B |
|---|---|---|---|
| Quadrant D | 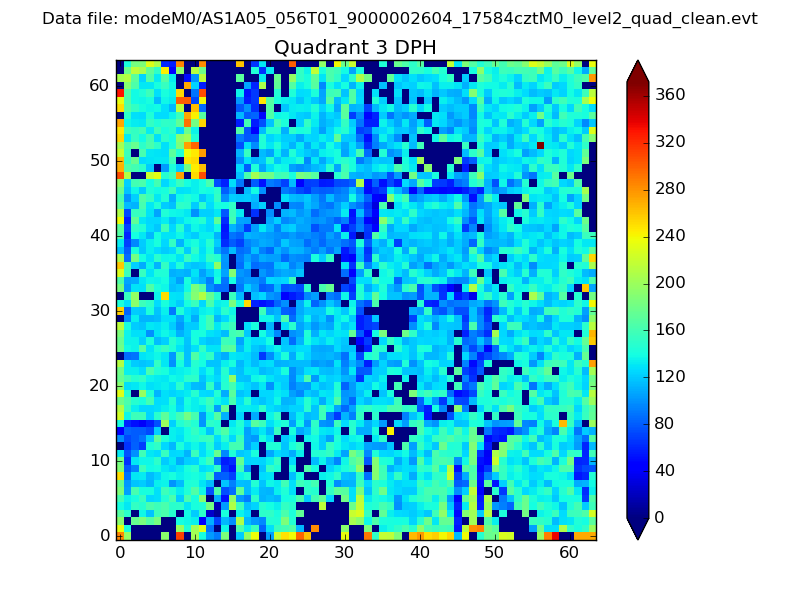 |
 |
Quadrant C |
| Plot type | Count rate plots | Images |
|---|---|---|
| Comparison with Poisson distribution Blue bars denote a histogram of data divided into 1 sec bins. Red curve is a Poisson curve with rate = median count rate of data. |
 |
 |
| Quadrant-wise count rates Data is divided into 100 sec bins |
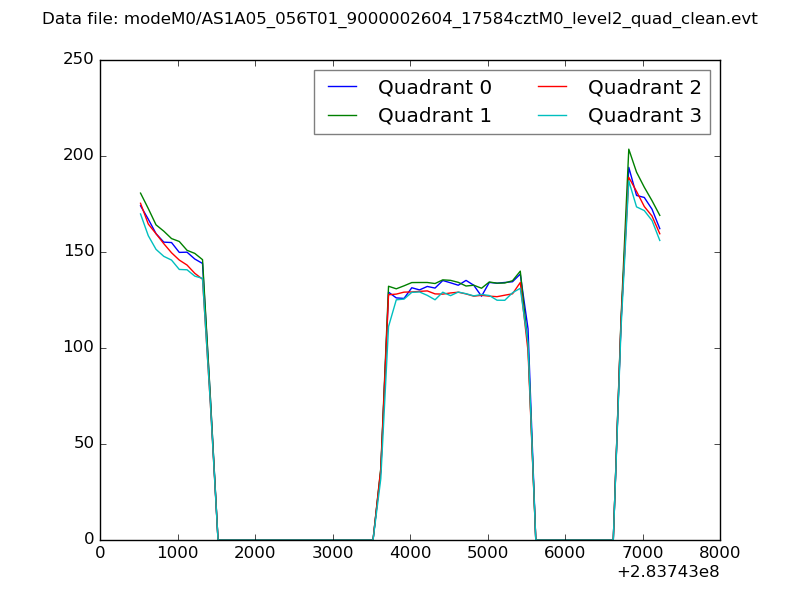 |
|
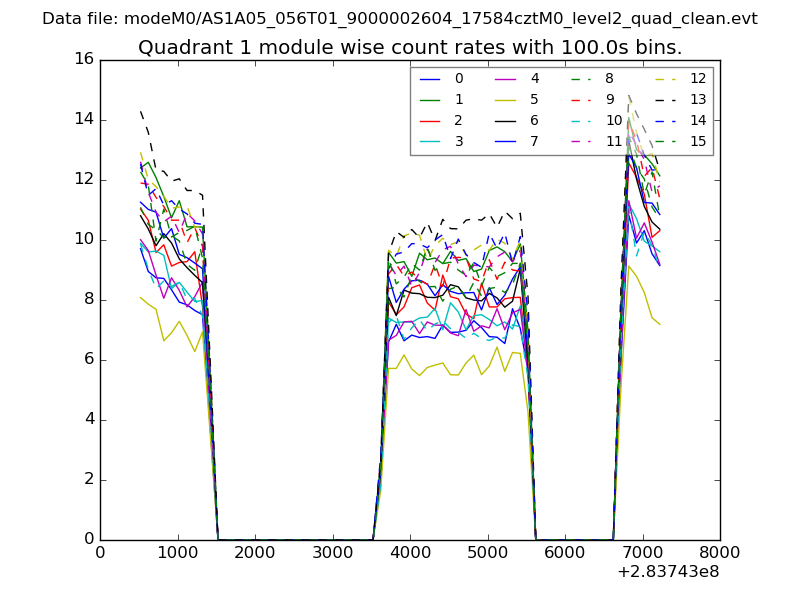
| Module-wise count rates for Quadrant A Data is divided into 100 sec bins |
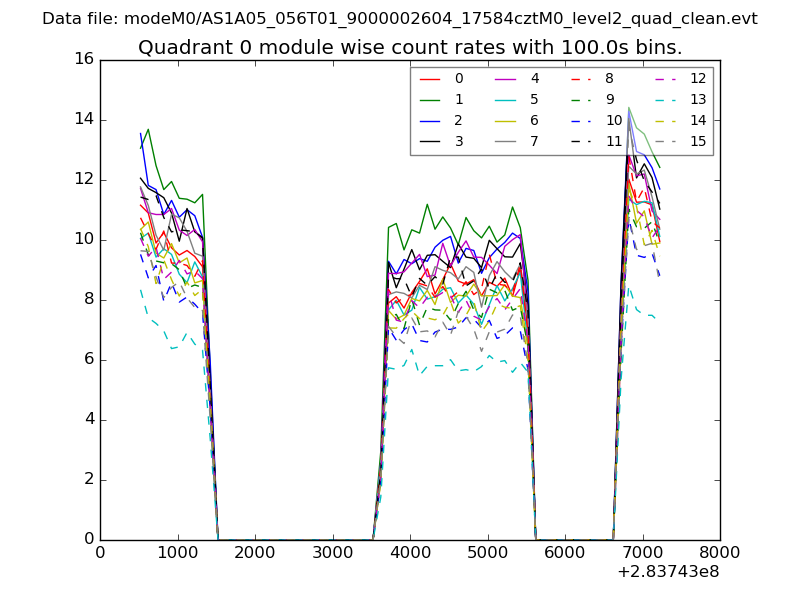 |
 |
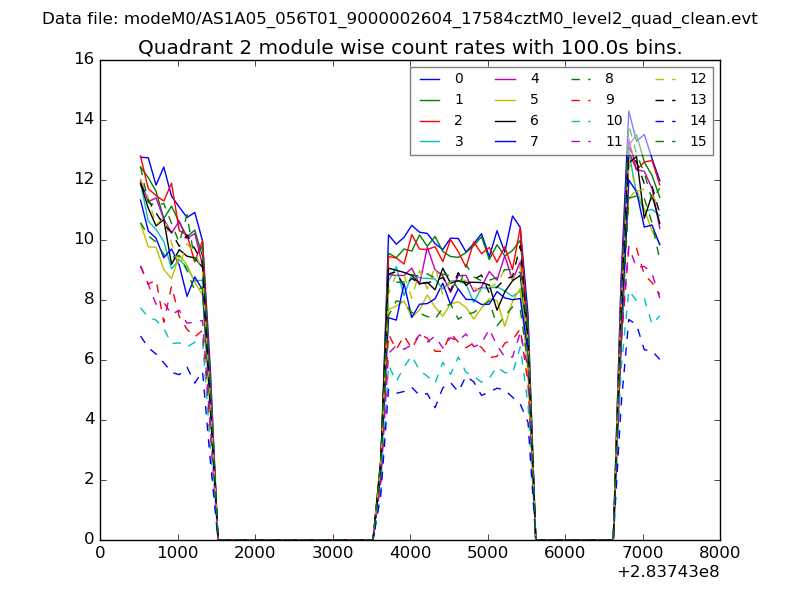
| Module-wise count rates for Quadrant B Data is divided into 100 sec bins |
 |
 |
| Module-wise count rates for Quadrant C Data is divided into 100 sec bins |
 |
 |
| Module-wise count rates for Quadrant D Data is divided into 100 sec bins |
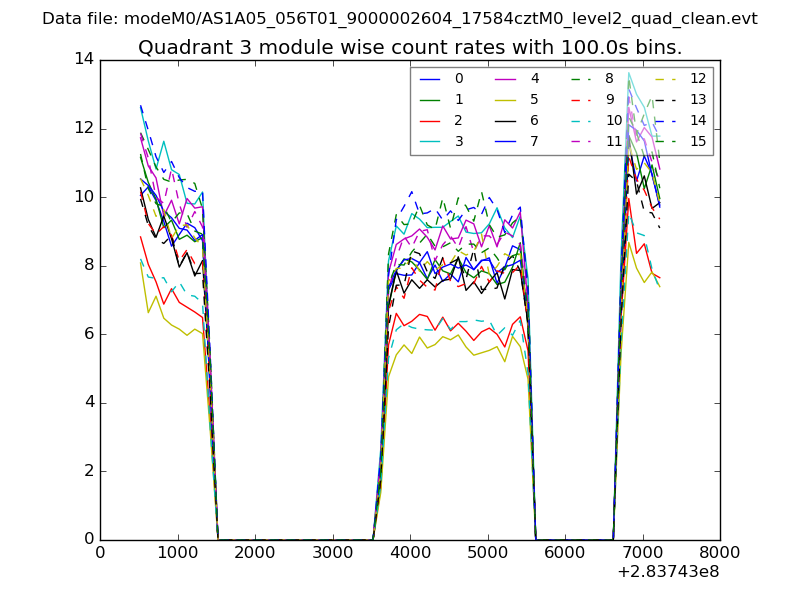 |
 |
| Parameter | Plot |
|---|---|
| CZT HV Monitor | 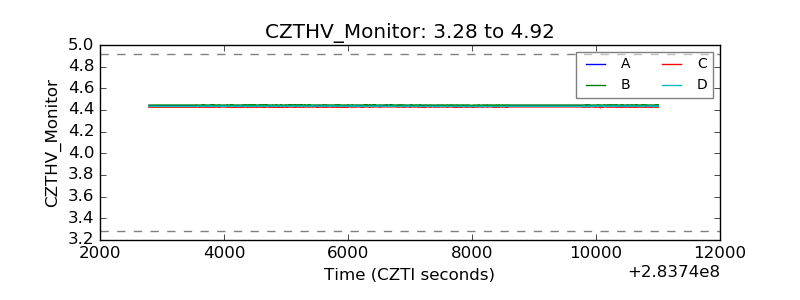 |
| D_VDD | 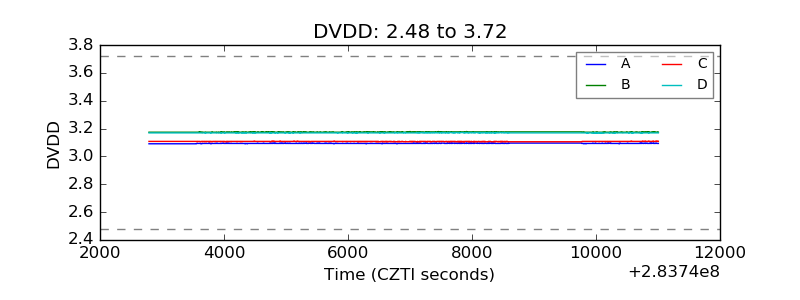 |
| Temperature 1 | 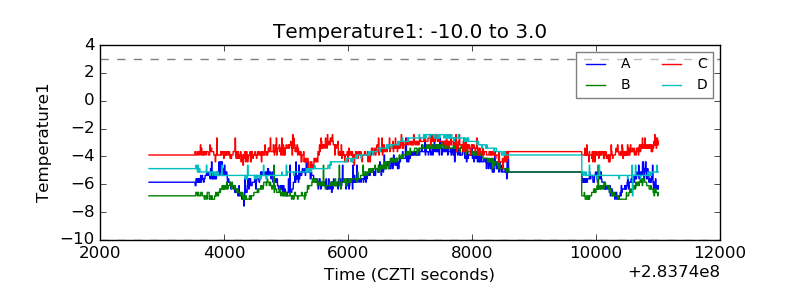 |
| Veto HV Monitor | 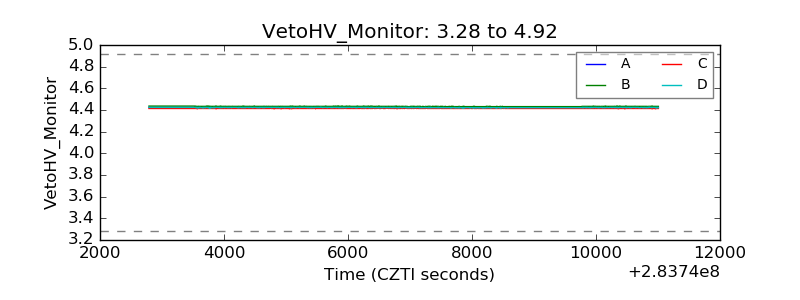 |
| Veto LLD | 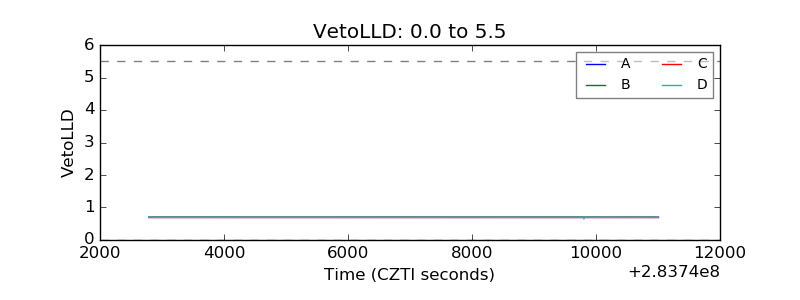 |
| Alpha Counter | 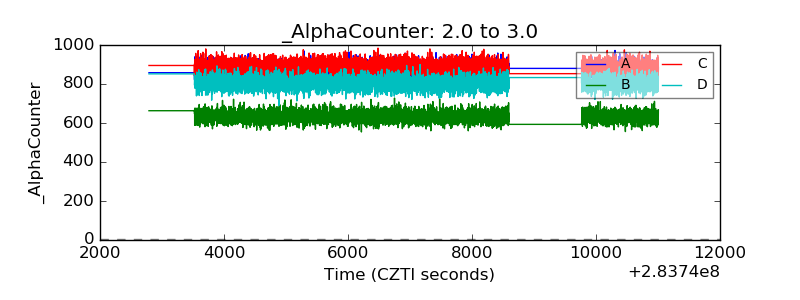 |
| _CPM_Rate | 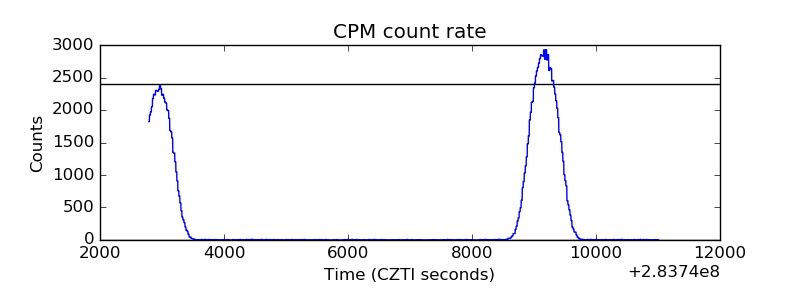 |
| CZT Counter | 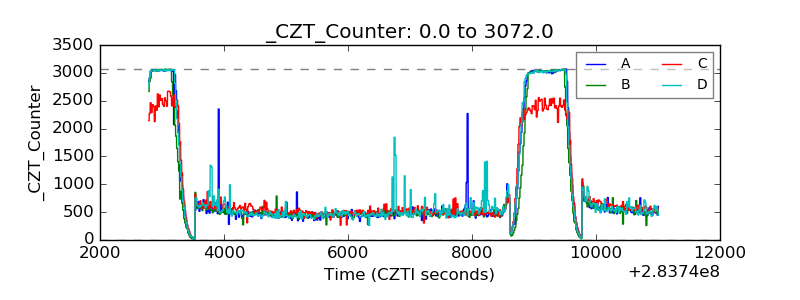 |
| +2.5 Volts monitor |  |
| +5 Volts monitor |  |
| _ROLL_ROT | 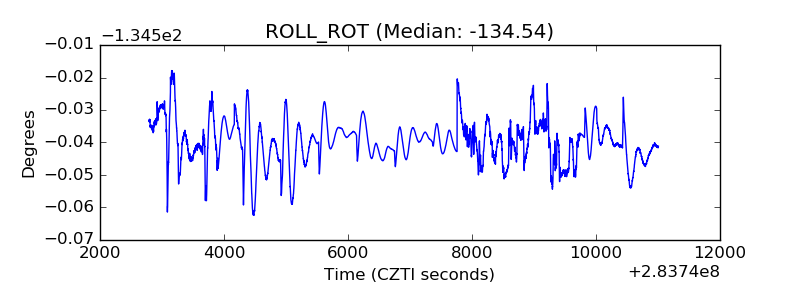 |
| _Roll_DEC | 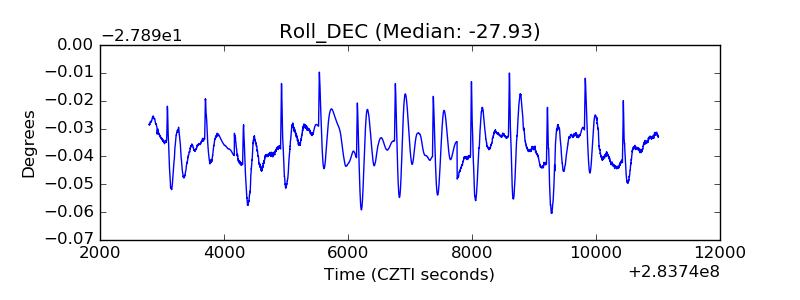 |
| _Roll_RA | 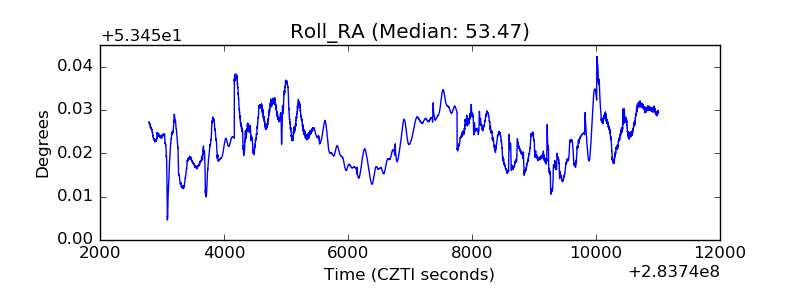 |
| Veto Counter | 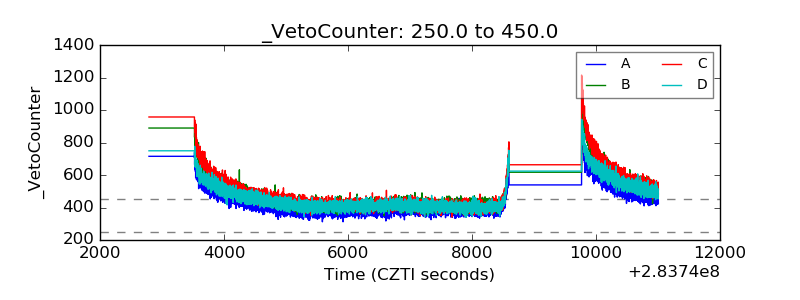 |