| Param | Original file | Final file |
|---|---|---|
| Filename | modeM0/AS1A05_056T01_9000002604_17585cztM0_level2.evt | modeM0/AS1A05_056T01_9000002604_17585cztM0_level2_quad_clean.evt |
| Size (bytes) | 472,887,360 | 70,424,640 |
| Size | 451.0 MB | 67.2 MB |
| Events in quadrant A | 3,829,629 | 427,836 |
| Events in quadrant B | 3,245,443 | 438,038 |
| Events in quadrant C | 3,520,972 | 421,532 |
| Events in quadrant D | 3,307,653 | 415,223 |
| Mode M9 | |||
|---|---|---|---|
| Quadrant | BADHDUFLAG | Total packets | Discarded packets |
| A | 0 | 17 | 0 |
| B | 0 | 18 | 0 |
| C | 0 | 18 | 0 |
| D | 0 | 18 | 0 |
| Mode M0 | |||
|---|---|---|---|
| Quadrant | BADHDUFLAG | Total packets | Discarded packets |
| A | 0 | 15168 | 2 |
| B | 0 | 13332 | 2 |
| C | 0 | 14274 | 2 |
| D | 0 | 13629 | 2 |
| Mode SS | |||
|---|---|---|---|
| Quadrant | BADHDUFLAG | Total packets | Discarded packets |
| A | 0 | 126 | 0 |
| B | 0 | 126 | 0 |
| C | 0 | 126 | 0 |
| D | 0 | 126 | 0 |
| Quadrant | Total seconds | Saturated seconds | Saturation percentage |
|---|---|---|---|
| A | 6151 | 141 | 2.292310% |
| B | 6151 | 52 | 0.845391% |
| C | 6151 | 84 | 1.365632% |
| D | 6150 | 31 | 0.504065% |
Noise dominated data is calculated using 1-second bins in cleaned event files. If a bin has >2000 counts, and if more than 50% of those come from <1% of pixels, then it is considered to be noise-dominated and hence unusable.
| Quadrant | # 1 sec bins | Bins with >0 counts | Bins with >2000 counts | High rate bins dominated by noise | Noise dominated (total time) | Noise dominated (detector-on time) | Marked lightcurve |
|---|---|---|---|---|---|---|---|
| A | 7441 | 6152 | 84 | 84 | 1.13% | 1.37% | 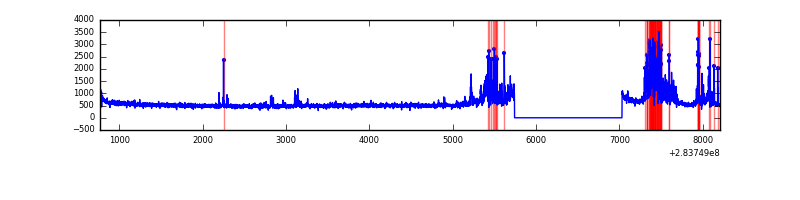 |
| B | 7441 | 6152 | 0 | 0 | 0.00% | 0.00% | 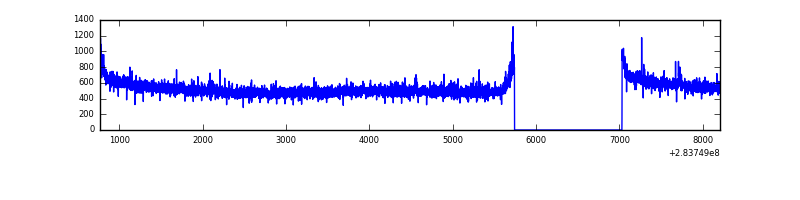 |
| C | 7441 | 6151 | 1 | 1 | 0.01% | 0.02% | 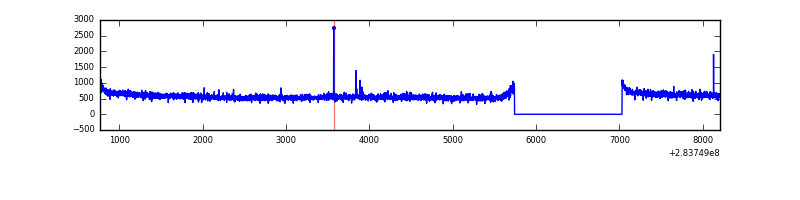 |
| D | 7440 | 6151 | 5 | 5 | 0.07% | 0.08% | 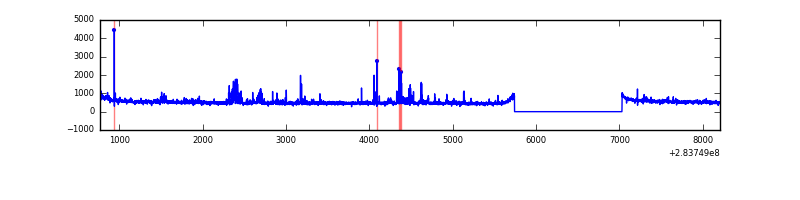 |
Top three noisy pixels from each quadrant. If the there are fewer than three noisy pixels in the level2.evt file, extra rows are filled as -1
| Pixel properties | Quadrant properties | ||||||
|---|---|---|---|---|---|---|---|
| Quadrant | DetID | PixID | Counts | Sigma | Mean | Median | Sigma |
| A | 14 | 237 | 689542 | 4255.15 | 816 | 802 | 161.9 |
| A | 0 | 226 | 7052 | 38.61 | 816 | 802 | 161.9 |
| A | 12 | 194 | 5773 | 30.71 | 816 | 802 | 161.9 |
| B | 12 | 111 | 18310 | 113.95 | 828 | 810 | 153.6 |
| B | 11 | 111 | 15672 | 96.77 | 828 | 810 | 153.6 |
| B | 14 | 111 | 13954 | 85.58 | 828 | 810 | 153.6 |
| C | 3 | 233 | 214667 | 1150.28 | 803 | 811 | 185.9 |
| C | 14 | 238 | 124795 | 666.88 | 803 | 811 | 185.9 |
| C | 5 | 218 | 35929 | 188.89 | 803 | 811 | 185.9 |
| D | 5 | 222 | 167282 | 859.42 | 806 | 783 | 193.7 |
| D | 4 | 239 | 23716 | 118.37 | 806 | 783 | 193.7 |
| D | 2 | 234 | 20698 | 102.79 | 806 | 783 | 193.7 |
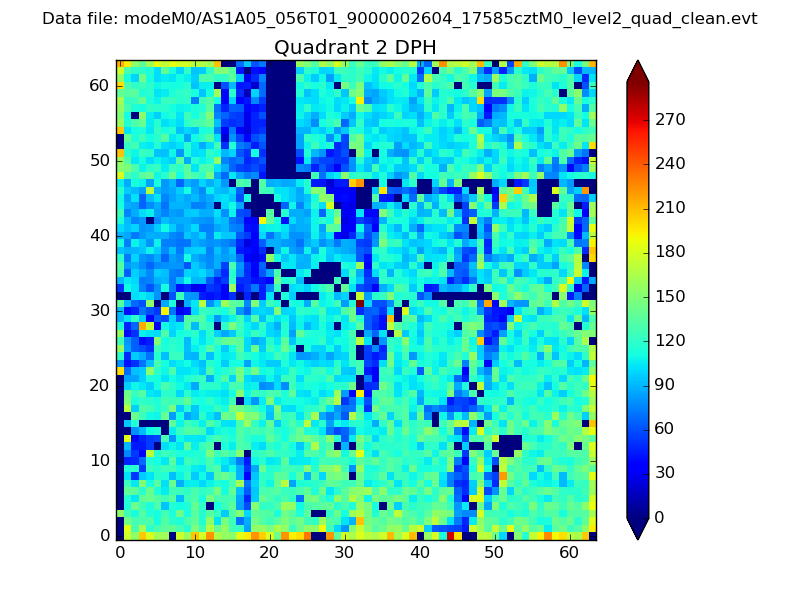
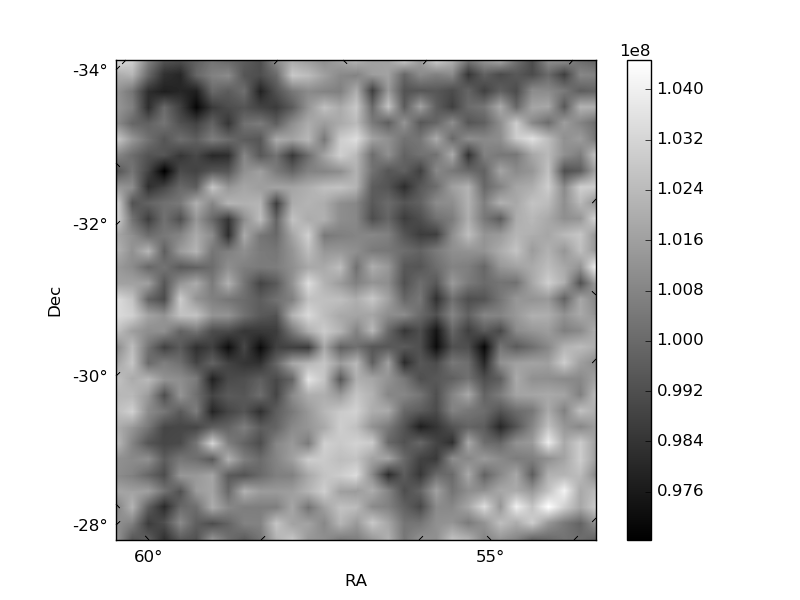
Histogram calculated using DETX and DETY for each event in the final _common_clean file
| Quadrant A | 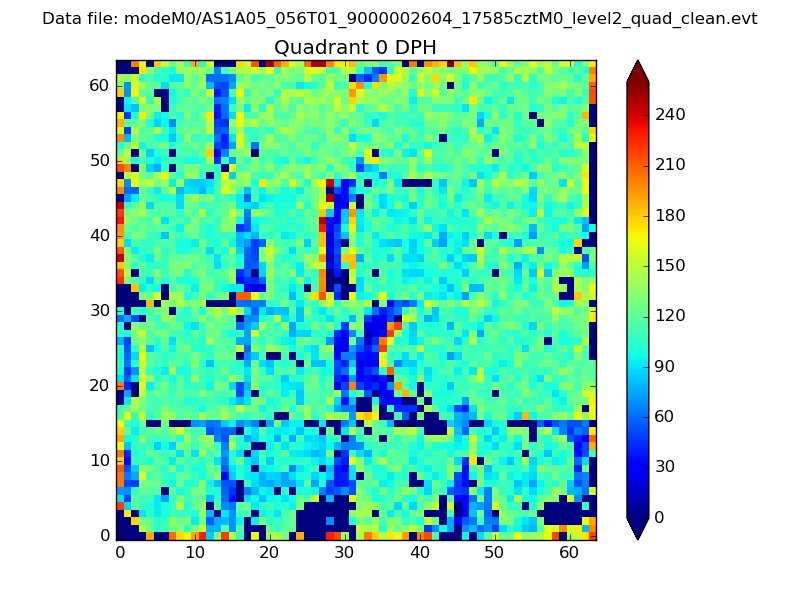 |
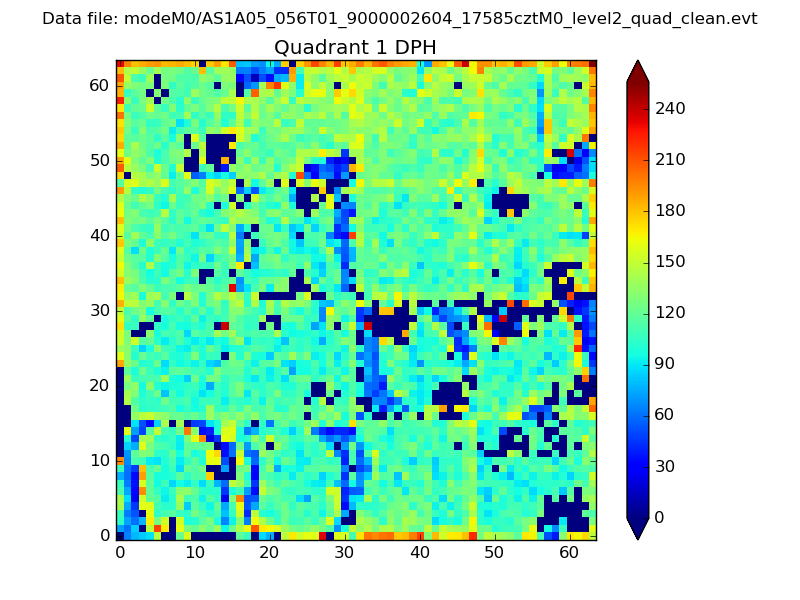 |
Quadrant B |
|---|---|---|---|
| Quadrant D | 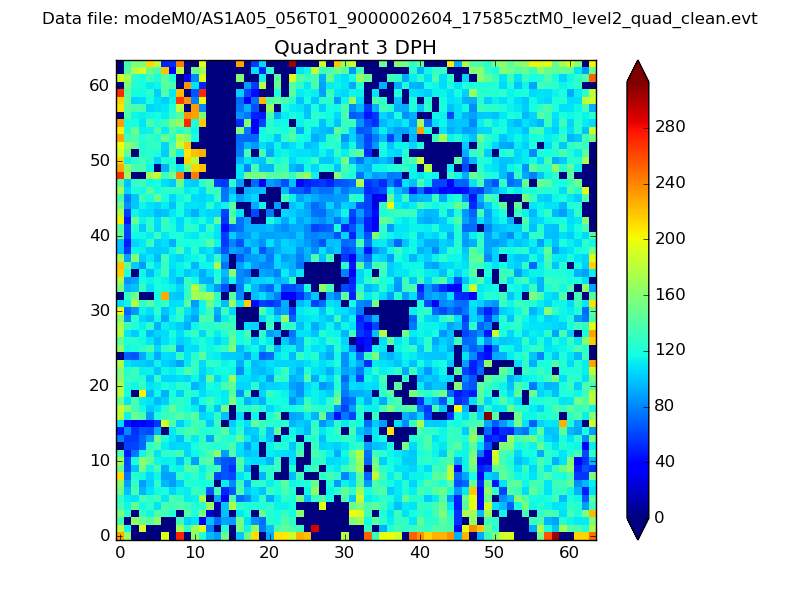 |
 |
Quadrant C |
| Plot type | Count rate plots | Images |
|---|---|---|
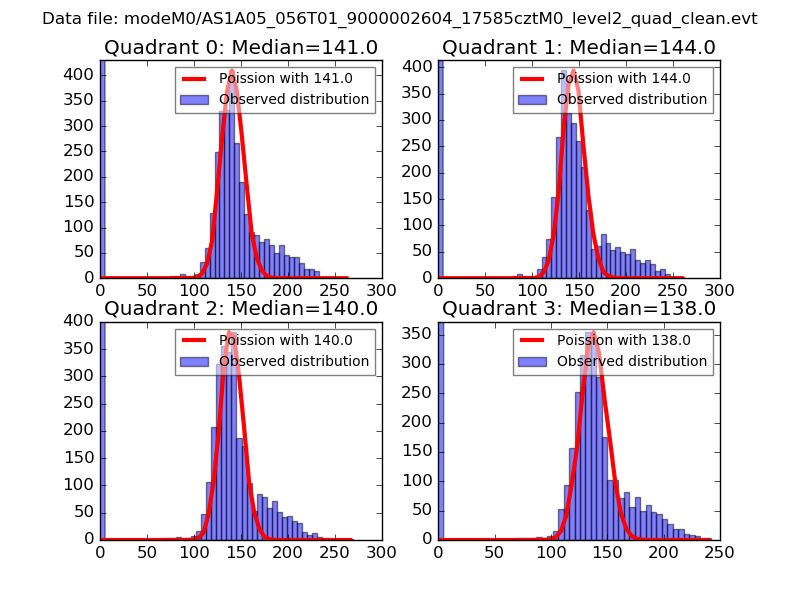
| Comparison with Poisson distribution Blue bars denote a histogram of data divided into 1 sec bins. Red curve is a Poisson curve with rate = median count rate of data. |
 |
 |
| Quadrant-wise count rates Data is divided into 100 sec bins |
 |
|
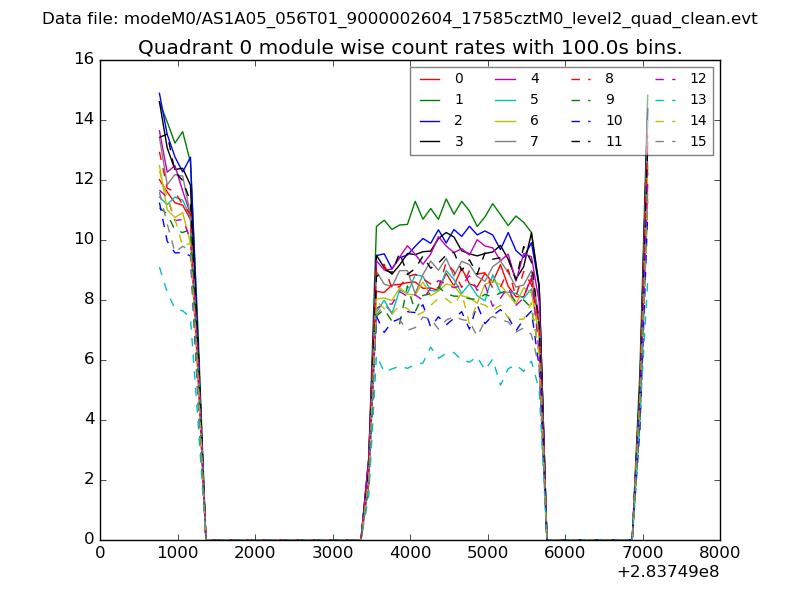
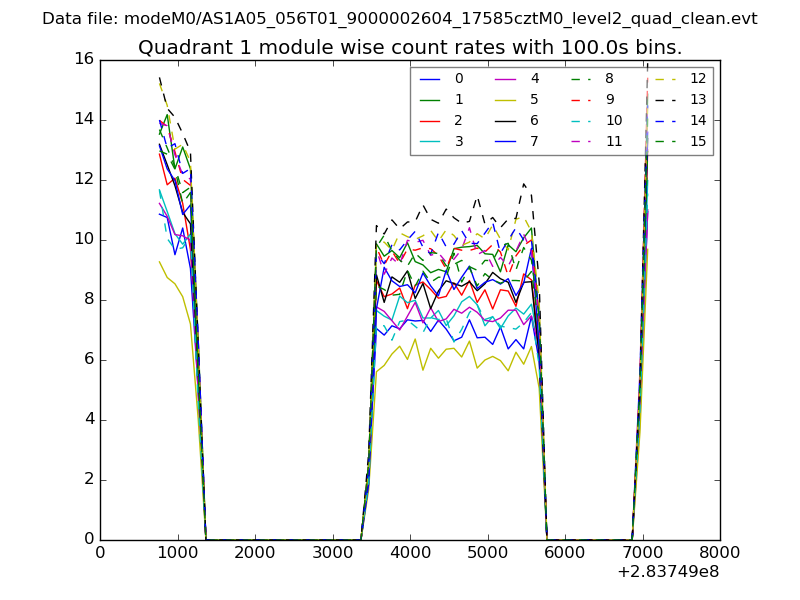
| Module-wise count rates for Quadrant A Data is divided into 100 sec bins |
 |
 |
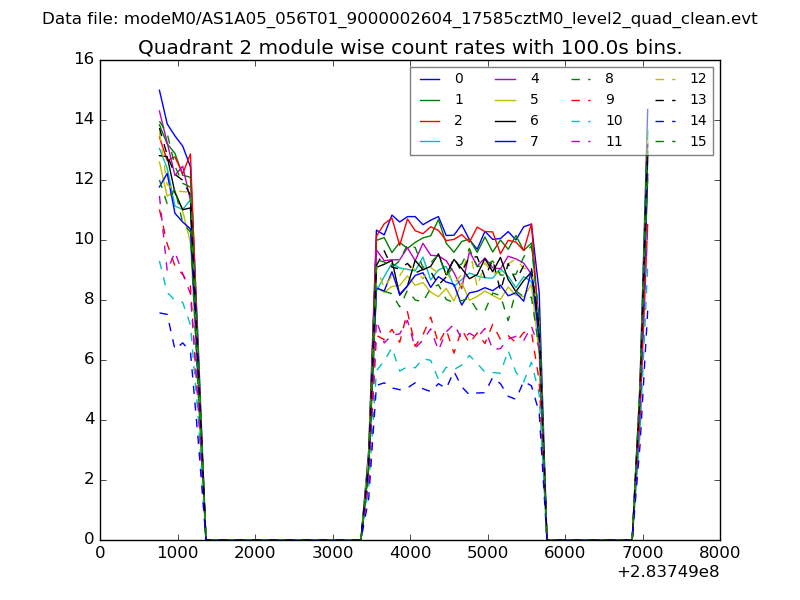
| Module-wise count rates for Quadrant B Data is divided into 100 sec bins |
 |
 |
| Module-wise count rates for Quadrant C Data is divided into 100 sec bins |
 |
 |
| Module-wise count rates for Quadrant D Data is divided into 100 sec bins |
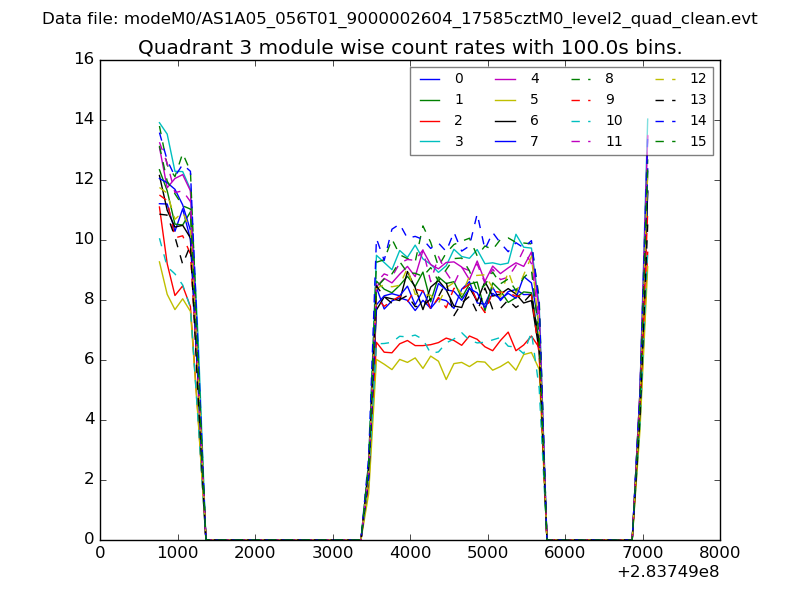 |
 |
| Parameter | Plot |
|---|---|
| CZT HV Monitor | 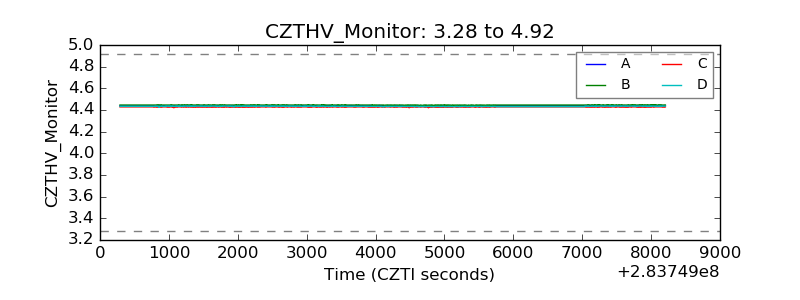 |
| D_VDD | 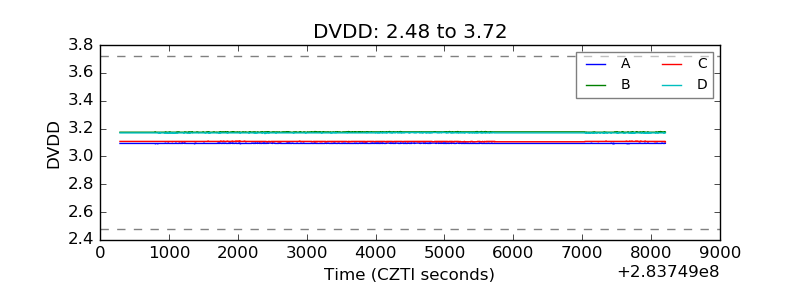 |
| Temperature 1 | 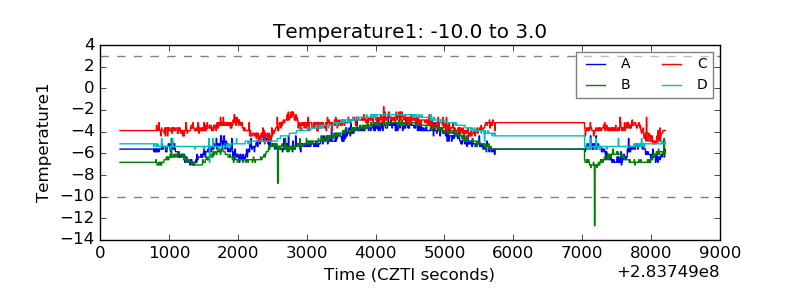 |
| Veto HV Monitor | 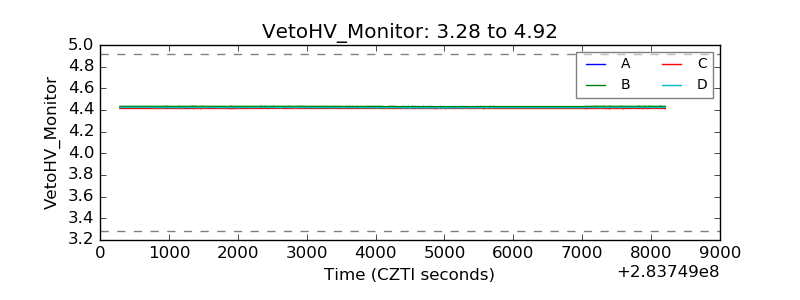 |
| Veto LLD | 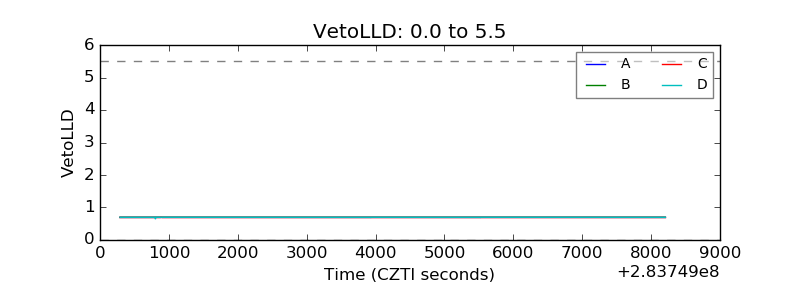 |
| Alpha Counter | 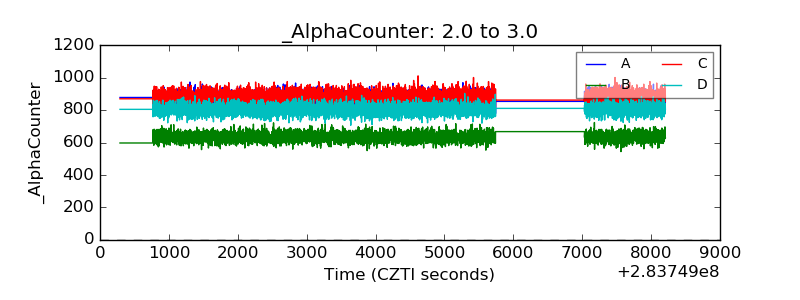 |
| _CPM_Rate | 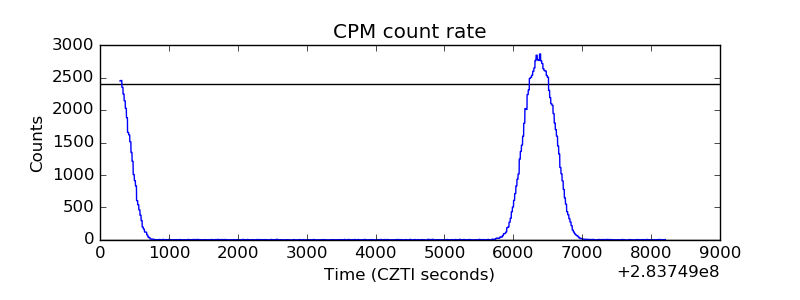 |
| CZT Counter | 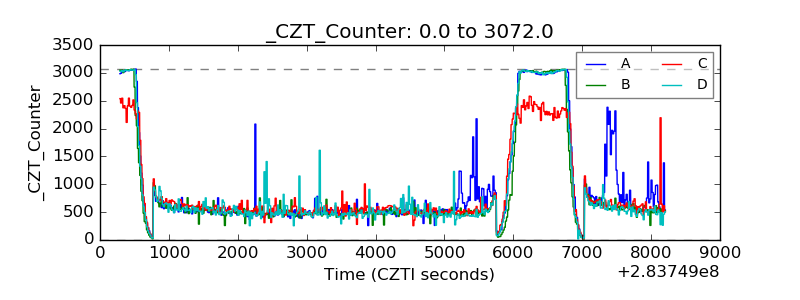 |
| +2.5 Volts monitor |  |
| +5 Volts monitor |  |
| _ROLL_ROT | 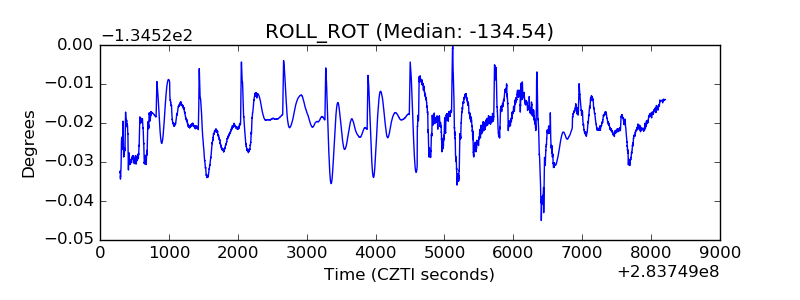 |
| _Roll_DEC | 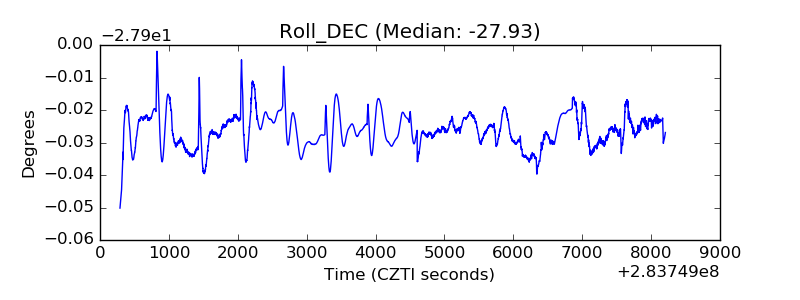 |
| _Roll_RA | 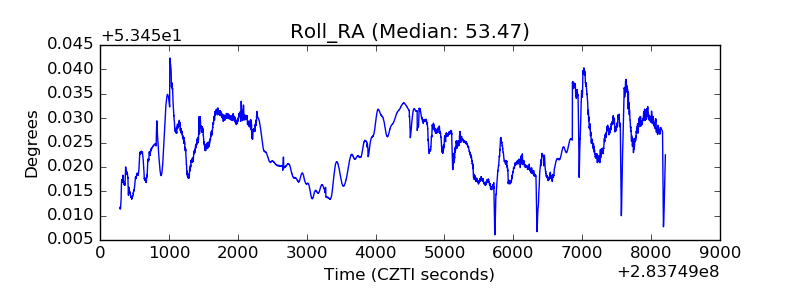 |
| Veto Counter | 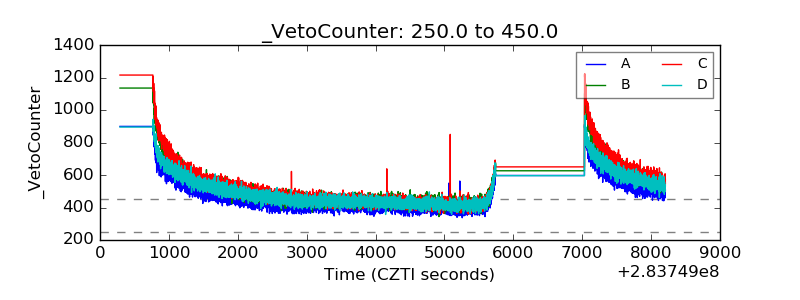 |