| Param | Original file | Final file |
|---|---|---|
| Filename | modeM0/AS1A05_056T01_9000002604_17586cztM0_level2.evt | modeM0/AS1A05_056T01_9000002604_17586cztM0_level2_quad_clean.evt |
| Size (bytes) | 478,244,160 | 65,341,440 |
| Size | 456.1 MB | 62.3 MB |
| Events in quadrant A | 3,908,335 | 389,609 |
| Events in quadrant B | 3,358,553 | 397,847 |
| Events in quadrant C | 3,576,886 | 380,907 |
| Events in quadrant D | 3,220,423 | 378,549 |
| Mode M9 | |||
|---|---|---|---|
| Quadrant | BADHDUFLAG | Total packets | Discarded packets |
| A | 0 | 16 | 0 |
| B | 0 | 17 | 0 |
| C | 0 | 17 | 0 |
| D | 0 | 17 | 0 |
| Mode M0 | |||
|---|---|---|---|
| Quadrant | BADHDUFLAG | Total packets | Discarded packets |
| A | 0 | 15359 | 2 |
| B | 0 | 13670 | 2 |
| C | 0 | 14584 | 2 |
| D | 0 | 13291 | 2 |
| Mode SS | |||
|---|---|---|---|
| Quadrant | BADHDUFLAG | Total packets | Discarded packets |
| A | 0 | 126 | 0 |
| B | 0 | 126 | 0 |
| C | 0 | 126 | 0 |
| D | 0 | 126 | 0 |
| Quadrant | Total seconds | Saturated seconds | Saturation percentage |
|---|---|---|---|
| A | 6178 | 160 | 2.589835% |
| B | 6178 | 79 | 1.278731% |
| C | 6178 | 130 | 2.104241% |
| D | 6178 | 65 | 1.052120% |
Noise dominated data is calculated using 1-second bins in cleaned event files. If a bin has >2000 counts, and if more than 50% of those come from <1% of pixels, then it is considered to be noise-dominated and hence unusable.
| Quadrant | # 1 sec bins | Bins with >0 counts | Bins with >2000 counts | High rate bins dominated by noise | Noise dominated (total time) | Noise dominated (detector-on time) | Marked lightcurve |
|---|---|---|---|---|---|---|---|
| A | 7478 | 6179 | 75 | 75 | 1.00% | 1.21% | 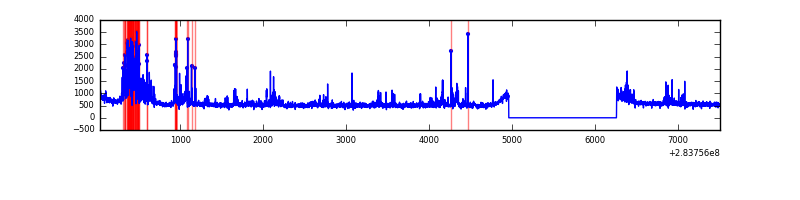 |
| B | 7478 | 6179 | 0 | 0 | 0.00% | 0.00% | 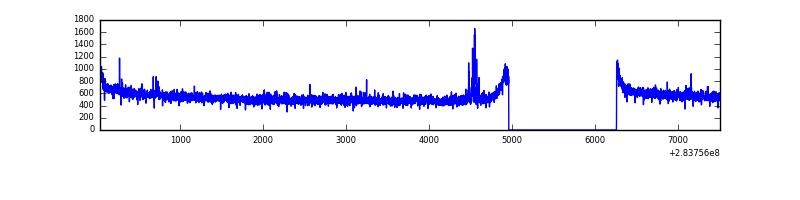 |
| C | 7478 | 6179 | 0 | 0 | 0.00% | 0.00% | 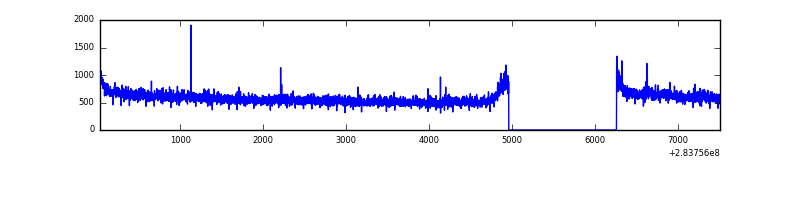 |
| D | 7478 | 6179 | 0 | 0 | 0.00% | 0.00% | 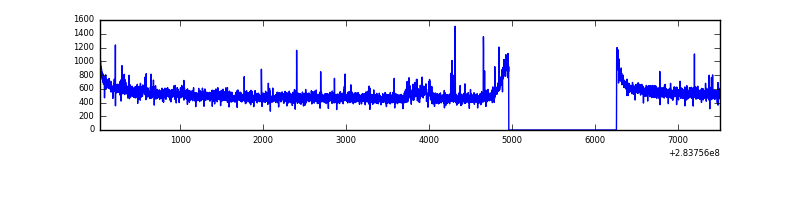 |
Top three noisy pixels from each quadrant. If the there are fewer than three noisy pixels in the level2.evt file, extra rows are filled as -1
| Pixel properties | Quadrant properties | ||||||
|---|---|---|---|---|---|---|---|
| Quadrant | DetID | PixID | Counts | Sigma | Mean | Median | Sigma |
| A | 14 | 237 | 638338 | 3811.8 | 846 | 833 | 167.2 |
| A | 6 | 16 | 16347 | 92.76 | 846 | 833 | 167.2 |
| A | 0 | 226 | 7492 | 39.82 | 846 | 833 | 167.2 |
| B | 4 | 48 | 22597 | 135.81 | 855 | 837 | 160.2 |
| B | 12 | 111 | 18698 | 111.47 | 855 | 837 | 160.2 |
| B | 11 | 111 | 16130 | 95.45 | 855 | 837 | 160.2 |
| C | 3 | 233 | 189507 | 995.55 | 826 | 833 | 189.5 |
| C | 14 | 238 | 129841 | 680.72 | 826 | 833 | 189.5 |
| C | 5 | 218 | 21195 | 107.44 | 826 | 833 | 189.5 |
| D | 5 | 222 | 43159 | 209.68 | 836 | 817 | 201.9 |
| D | 2 | 234 | 20017 | 95.08 | 836 | 817 | 201.9 |
| D | 13 | 189 | 14836 | 69.42 | 836 | 817 | 201.9 |
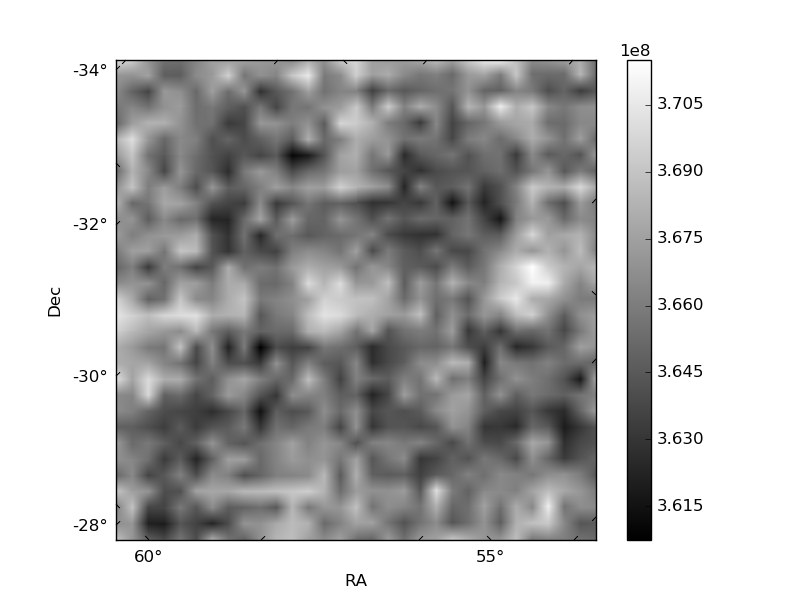
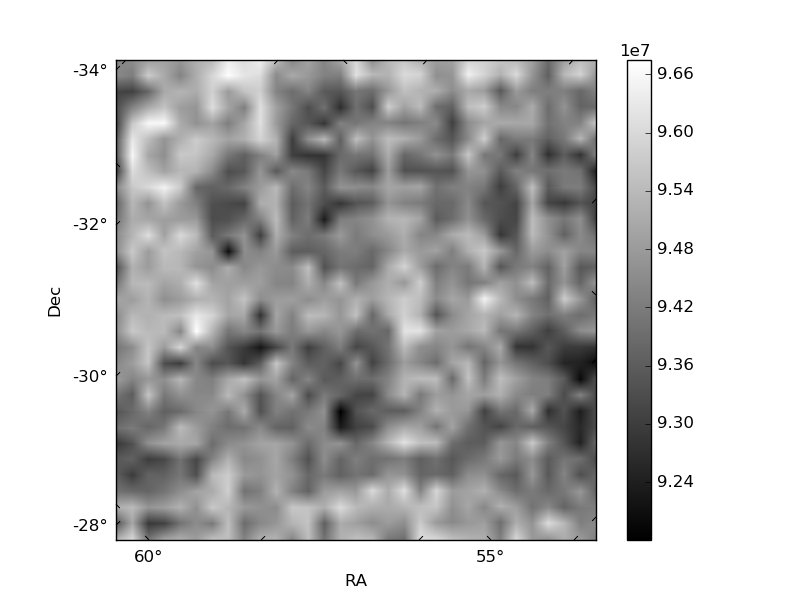
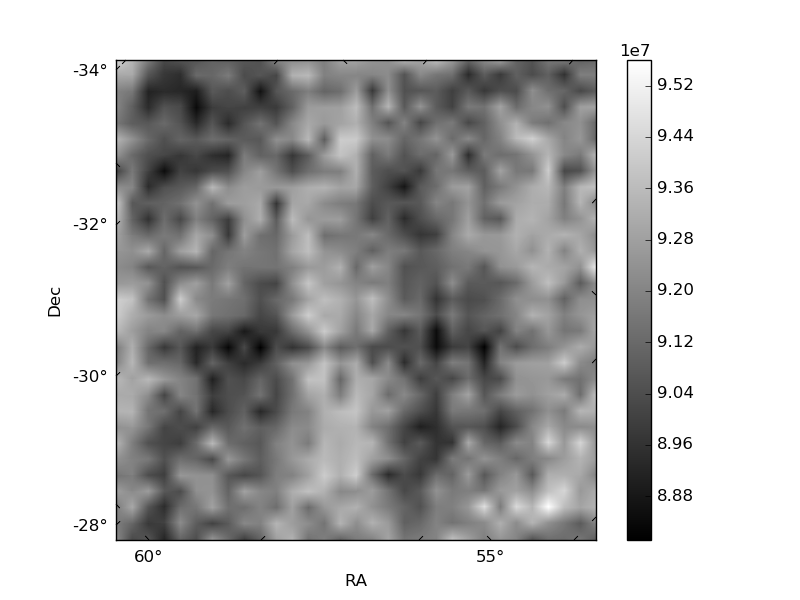
Histogram calculated using DETX and DETY for each event in the final _common_clean file
| Quadrant A | 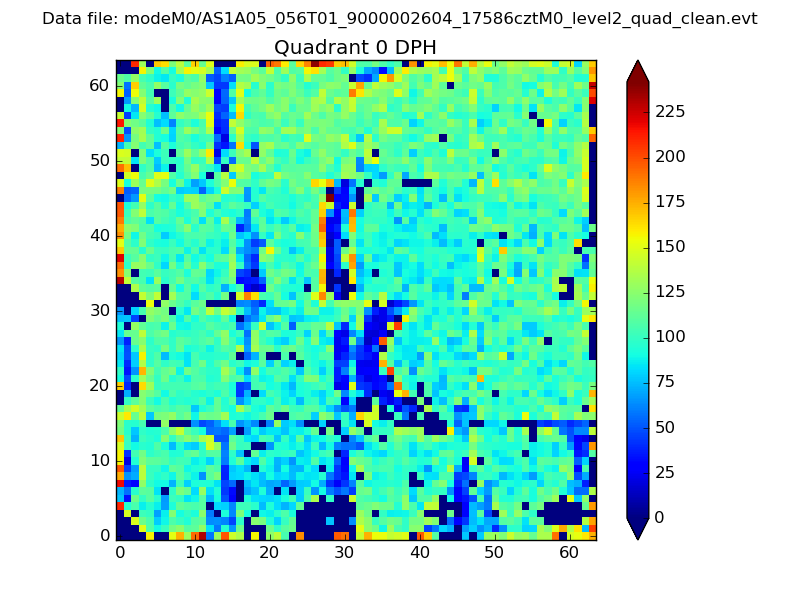 |
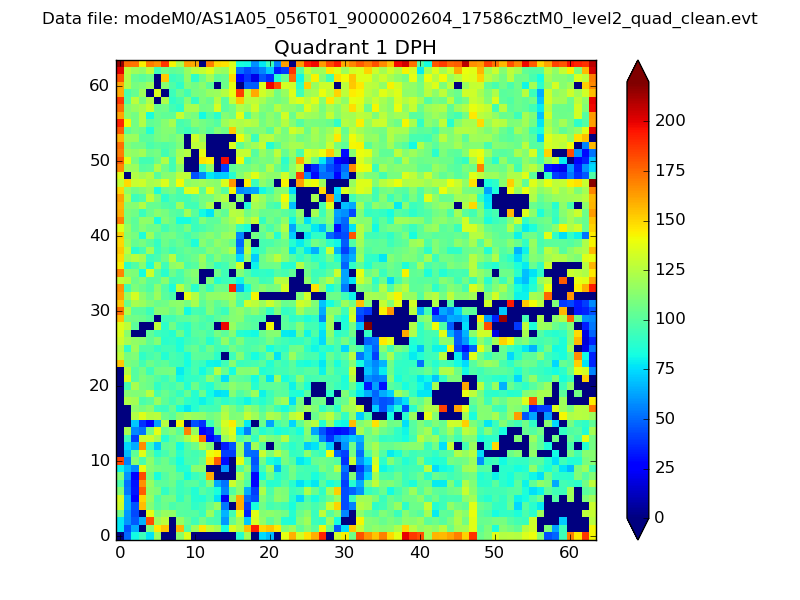 |
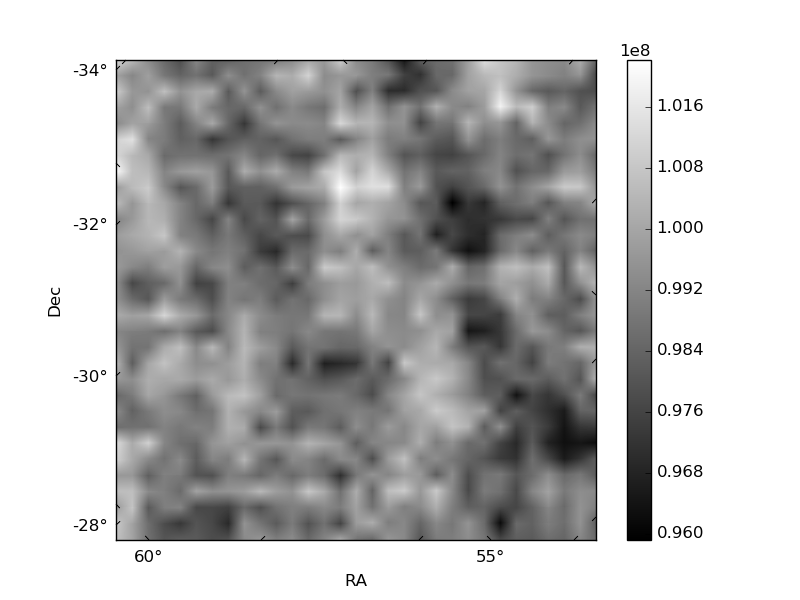
Quadrant B |
|---|---|---|---|
| Quadrant D | 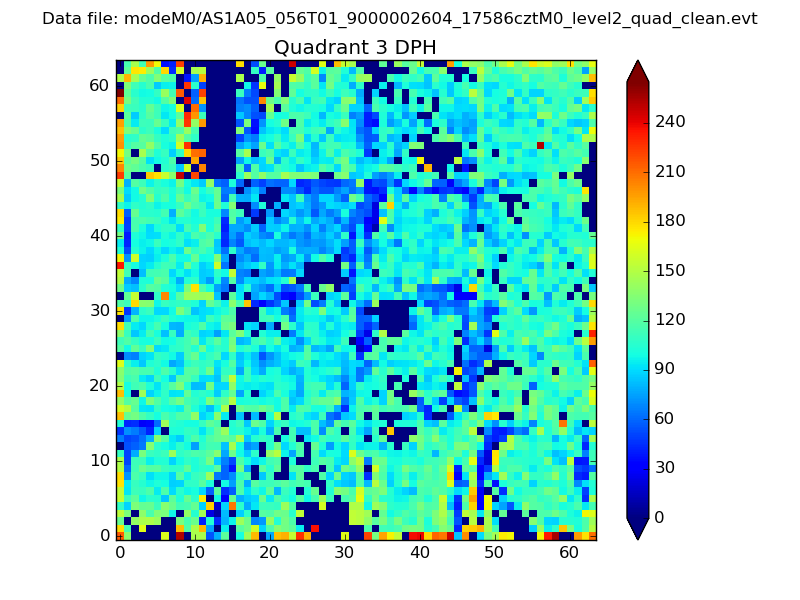 |
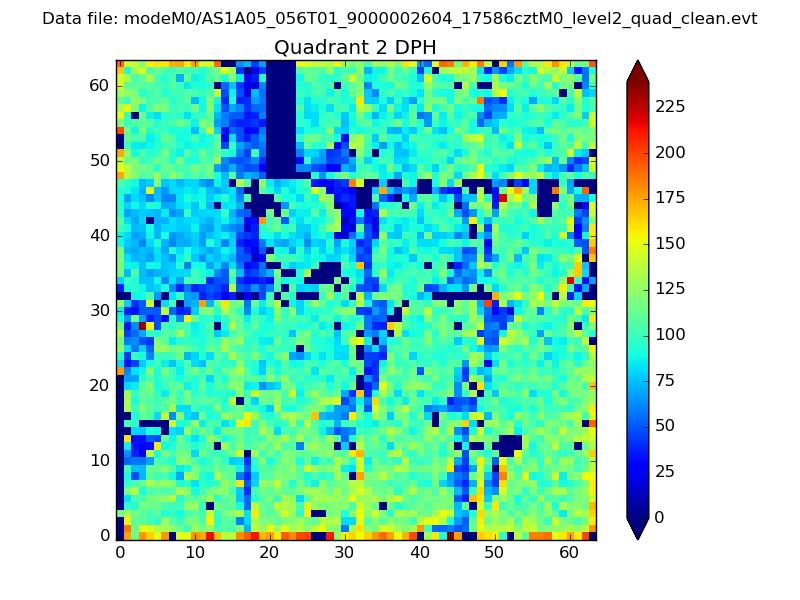 |
Quadrant C |
| Plot type | Count rate plots | Images |
|---|---|---|
| Comparison with Poisson distribution Blue bars denote a histogram of data divided into 1 sec bins. Red curve is a Poisson curve with rate = median count rate of data. |
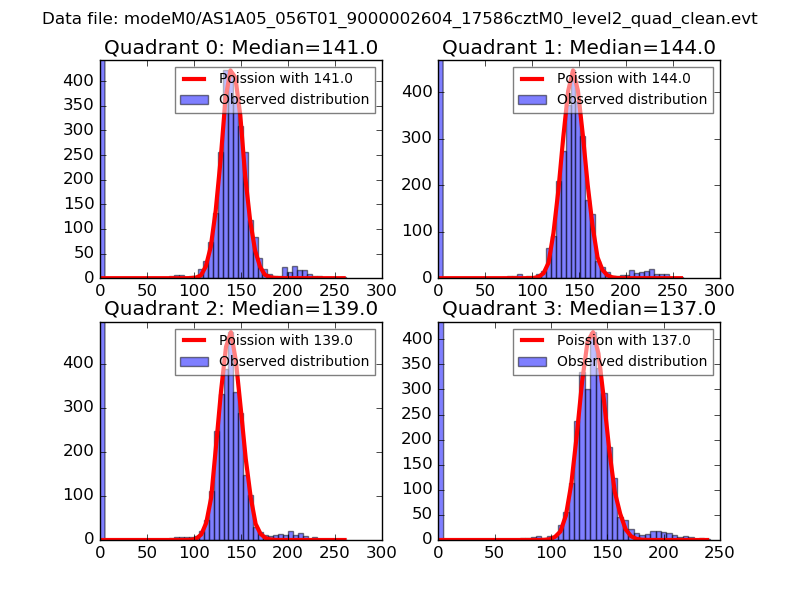 |
 |
| Quadrant-wise count rates Data is divided into 100 sec bins |
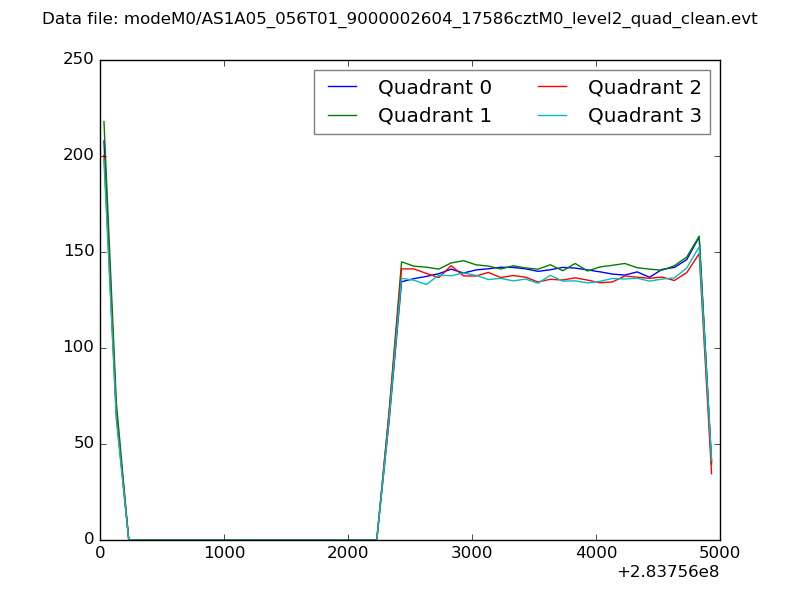 |
|
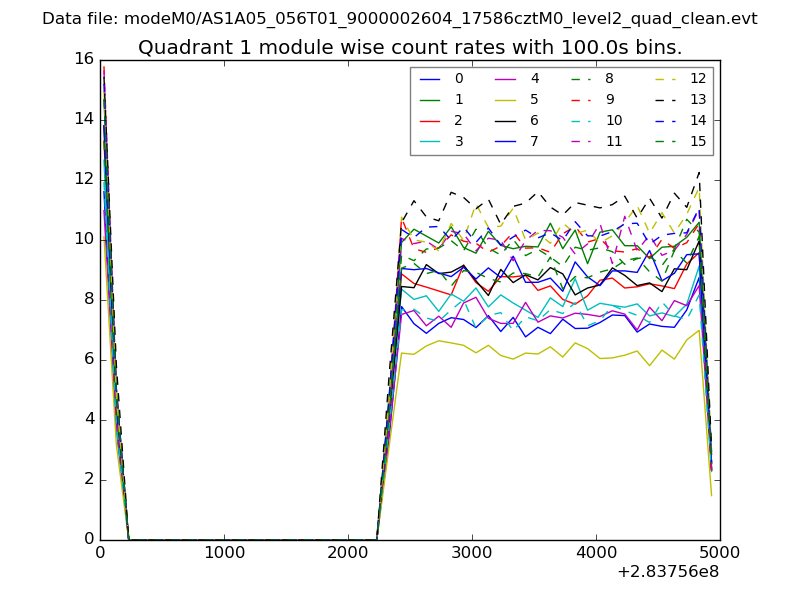
| Module-wise count rates for Quadrant A Data is divided into 100 sec bins |
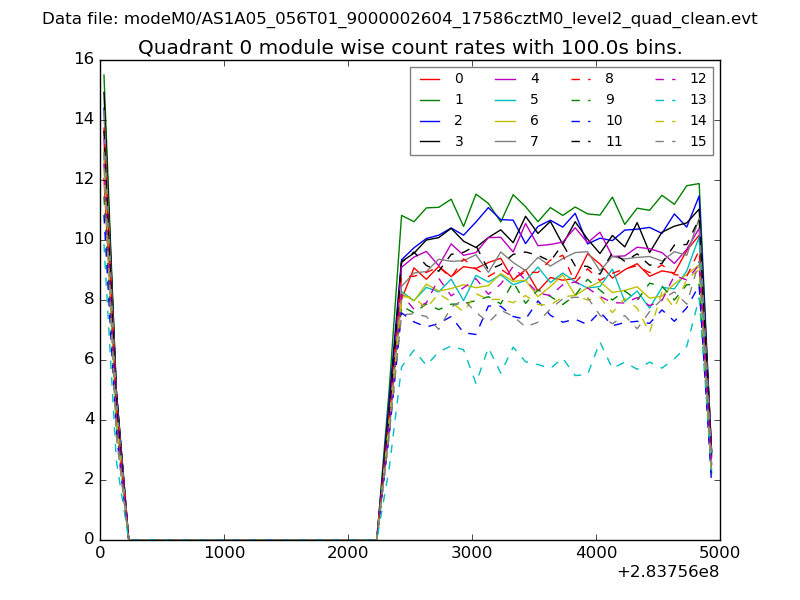 |
 |
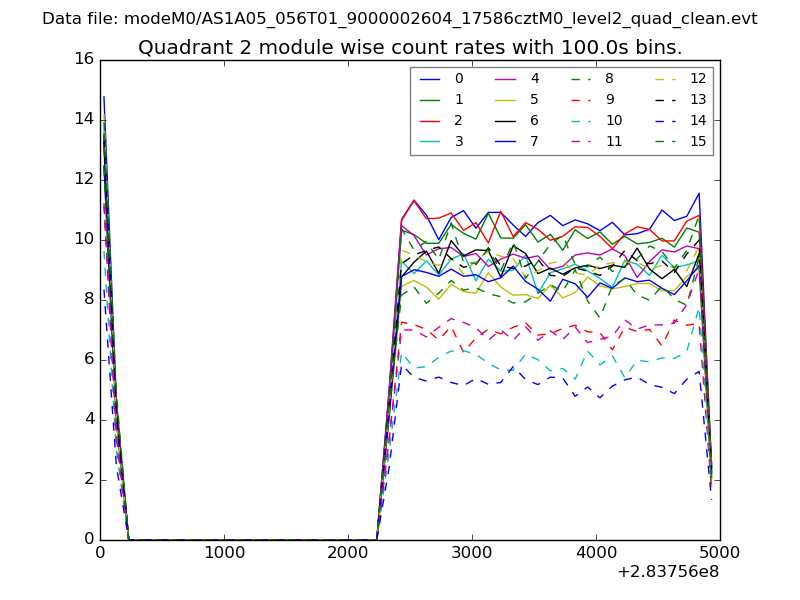
| Module-wise count rates for Quadrant B Data is divided into 100 sec bins |
 |
 |
| Module-wise count rates for Quadrant C Data is divided into 100 sec bins |
 |
 |
| Module-wise count rates for Quadrant D Data is divided into 100 sec bins |
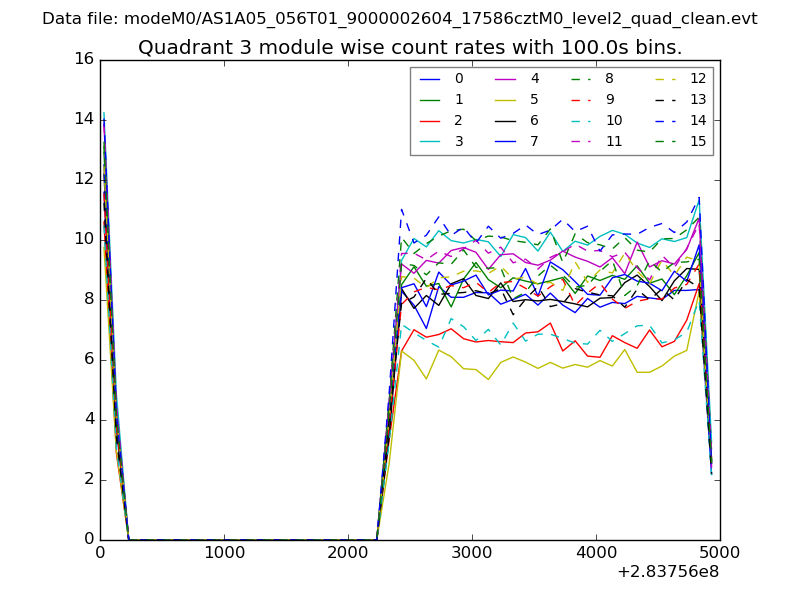 |
 |
| Parameter | Plot |
|---|---|
| CZT HV Monitor |  |
| D_VDD | 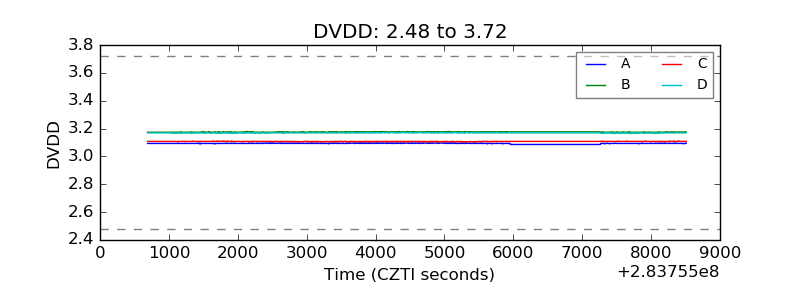 |
| Temperature 1 | 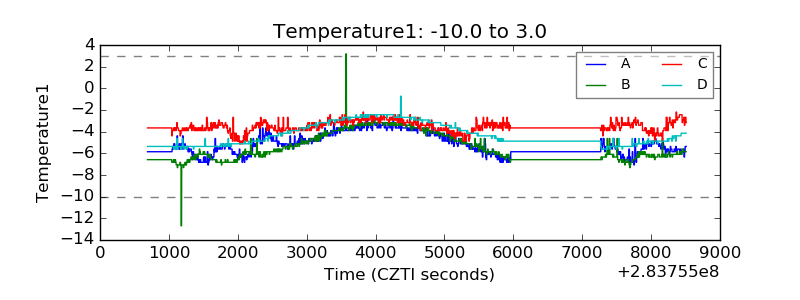 |
| Veto HV Monitor | 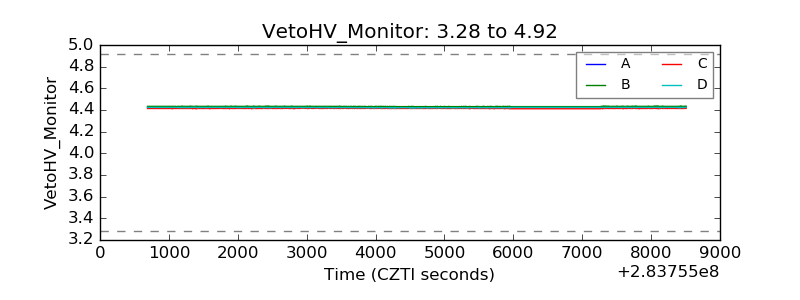 |
| Veto LLD | 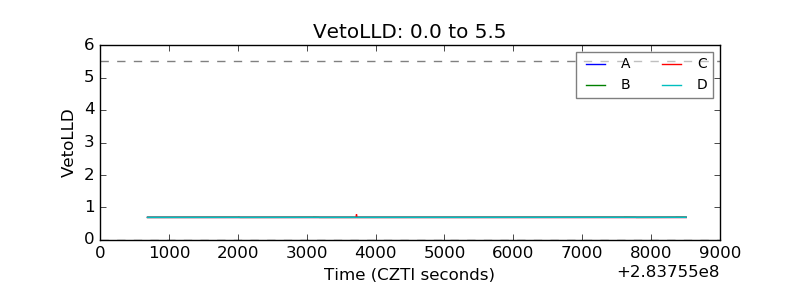 |
| Alpha Counter | 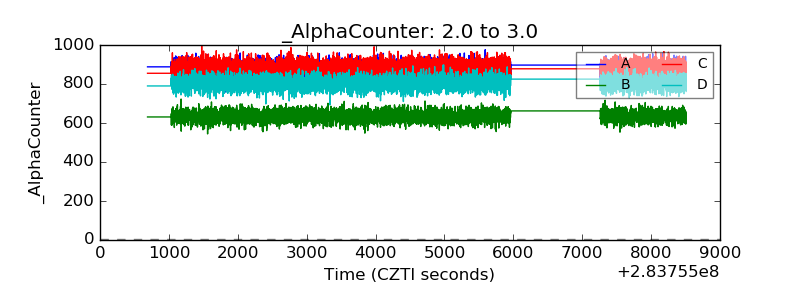 |
| _CPM_Rate | 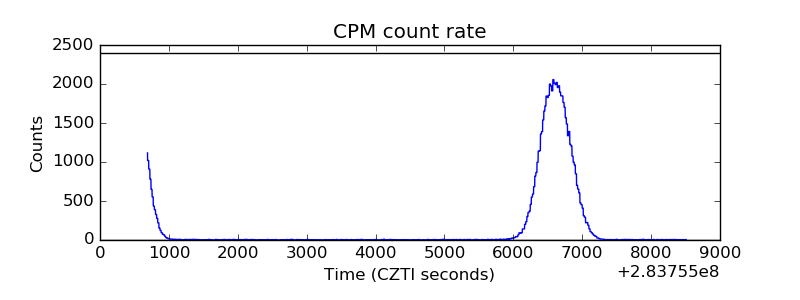 |
| CZT Counter | 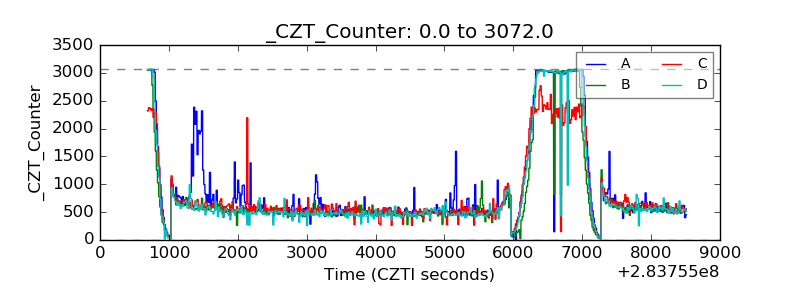 |
| +2.5 Volts monitor | 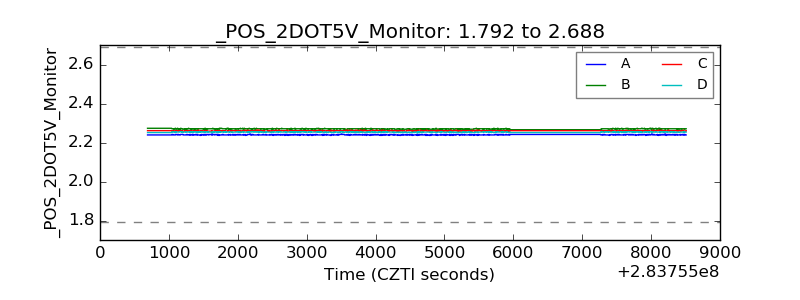 |
| +5 Volts monitor |  |
| _ROLL_ROT | 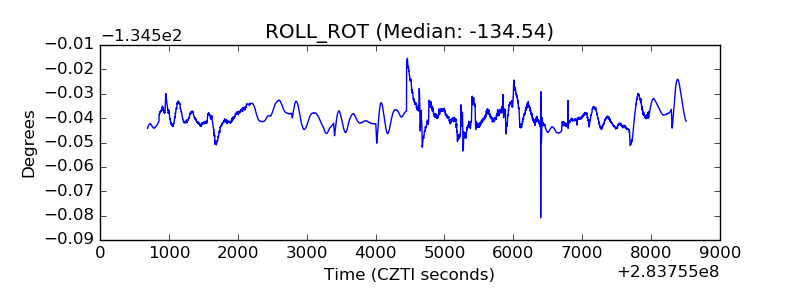 |
| _Roll_DEC | 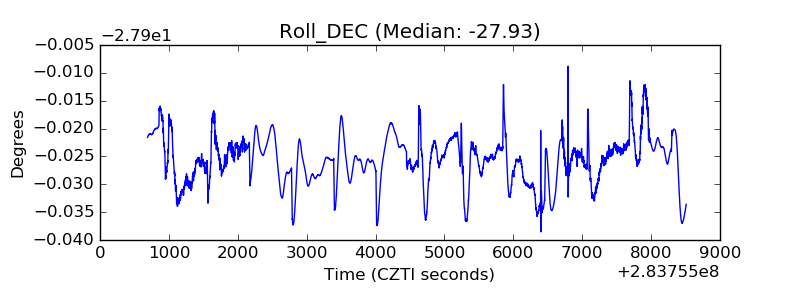 |
| _Roll_RA | 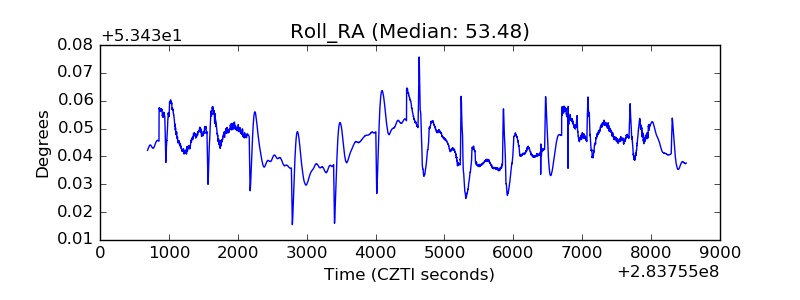 |
| Veto Counter | 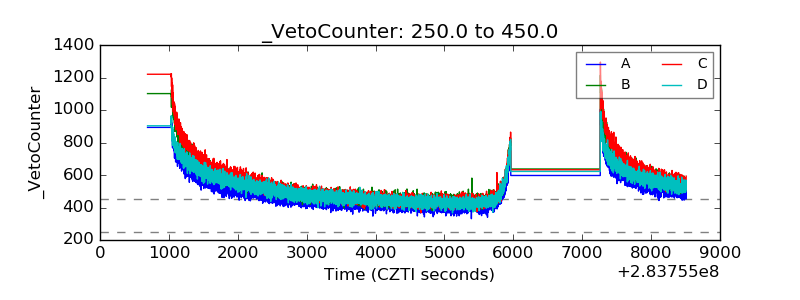 |