| Param | Original file | Final file |
|---|---|---|
| Filename | modeM0/AS1A05_056T01_9000002604_17587cztM0_level2.evt | modeM0/AS1A05_056T01_9000002604_17587cztM0_level2_quad_clean.evt |
| Size (bytes) | 482,371,200 | 69,914,880 |
| Size | 460.0 MB | 66.7 MB |
| Events in quadrant A | 3,948,717 | 422,886 |
| Events in quadrant B | 3,315,496 | 434,752 |
| Events in quadrant C | 3,710,214 | 414,023 |
| Events in quadrant D | 3,214,295 | 413,394 |
| Mode M9 | |||
|---|---|---|---|
| Quadrant | BADHDUFLAG | Total packets | Discarded packets |
| A | 0 | 15 | 0 |
| B | 0 | 16 | 0 |
| C | 0 | 16 | 0 |
| D | 0 | 16 | 0 |
| Mode M0 | |||
|---|---|---|---|
| Quadrant | BADHDUFLAG | Total packets | Discarded packets |
| A | 0 | 15487 | 2 |
| B | 0 | 13475 | 2 |
| C | 0 | 15026 | 2 |
| D | 0 | 13305 | 2 |
| Mode SS | |||
|---|---|---|---|
| Quadrant | BADHDUFLAG | Total packets | Discarded packets |
| A | 0 | 126 | 0 |
| B | 0 | 126 | 0 |
| C | 0 | 126 | 0 |
| D | 0 | 126 | 0 |
| Quadrant | Total seconds | Saturated seconds | Saturation percentage |
|---|---|---|---|
| A | 6186 | 164 | 2.651148% |
| B | 6186 | 131 | 2.117685% |
| C | 6186 | 200 | 3.233107% |
| D | 6186 | 114 | 1.842871% |
Noise dominated data is calculated using 1-second bins in cleaned event files. If a bin has >2000 counts, and if more than 50% of those come from <1% of pixels, then it is considered to be noise-dominated and hence unusable.
| Quadrant | # 1 sec bins | Bins with >0 counts | Bins with >2000 counts | High rate bins dominated by noise | Noise dominated (total time) | Noise dominated (detector-on time) | Marked lightcurve |
|---|---|---|---|---|---|---|---|
| A | 7446 | 6186 | 40 | 40 | 0.54% | 0.65% | 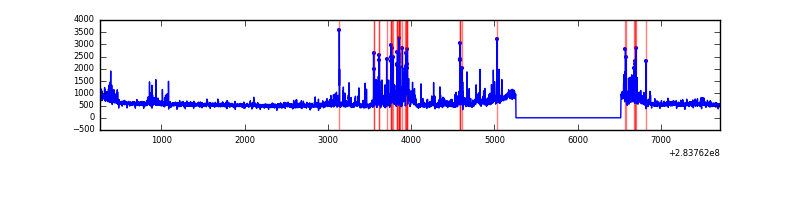 |
| B | 7446 | 6186 | 0 | 0 | 0.00% | 0.00% | 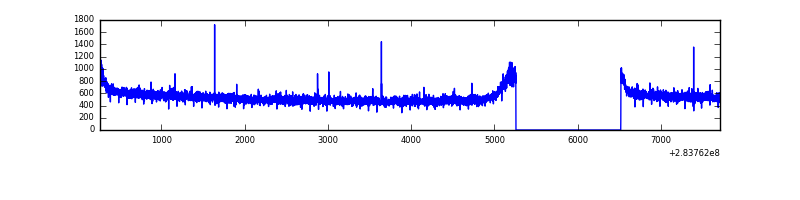 |
| C | 7446 | 6186 | 0 | 0 | 0.00% | 0.00% | 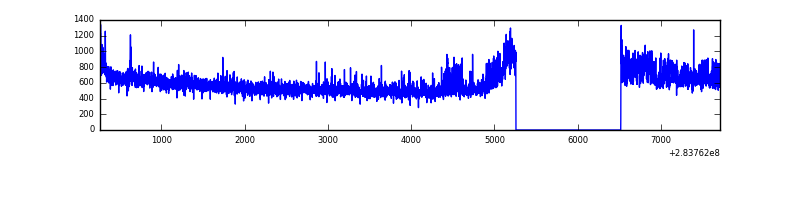 |
| D | 7446 | 6186 | 4 | 4 | 0.05% | 0.06% | 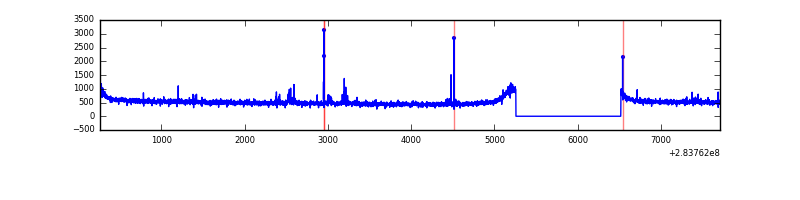 |
Top three noisy pixels from each quadrant. If the there are fewer than three noisy pixels in the level2.evt file, extra rows are filled as -1
| Pixel properties | Quadrant properties | ||||||
|---|---|---|---|---|---|---|---|
| Quadrant | DetID | PixID | Counts | Sigma | Mean | Median | Sigma |
| A | 14 | 237 | 697953 | 4163.33 | 844 | 829 | 167.4 |
| A | 0 | 13 | 11951 | 66.42 | 844 | 829 | 167.4 |
| A | 0 | 226 | 7439 | 39.48 | 844 | 829 | 167.4 |
| B | 12 | 111 | 18943 | 112.88 | 848 | 828 | 160.5 |
| B | 11 | 111 | 16318 | 96.53 | 848 | 828 | 160.5 |
| B | 14 | 111 | 14692 | 86.39 | 848 | 828 | 160.5 |
| C | 3 | 233 | 371519 | 1973.55 | 815 | 822 | 187.8 |
| C | 14 | 238 | 128488 | 679.68 | 815 | 822 | 187.8 |
| C | 5 | 218 | 20510 | 104.82 | 815 | 822 | 187.8 |
| D | 5 | 222 | 53720 | 265.75 | 831 | 810 | 199.1 |
| D | 2 | 234 | 19391 | 93.33 | 831 | 810 | 199.1 |
| D | 1 | 52 | 11927 | 55.84 | 831 | 810 | 199.1 |
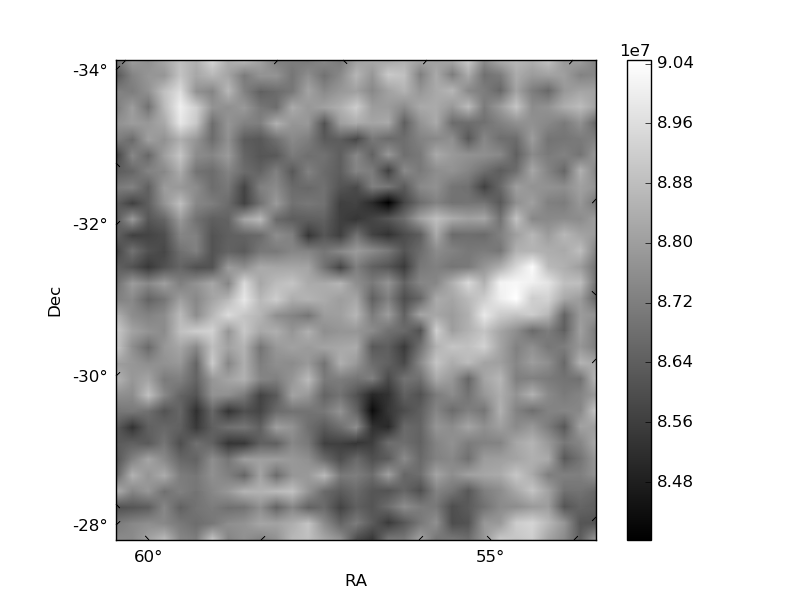
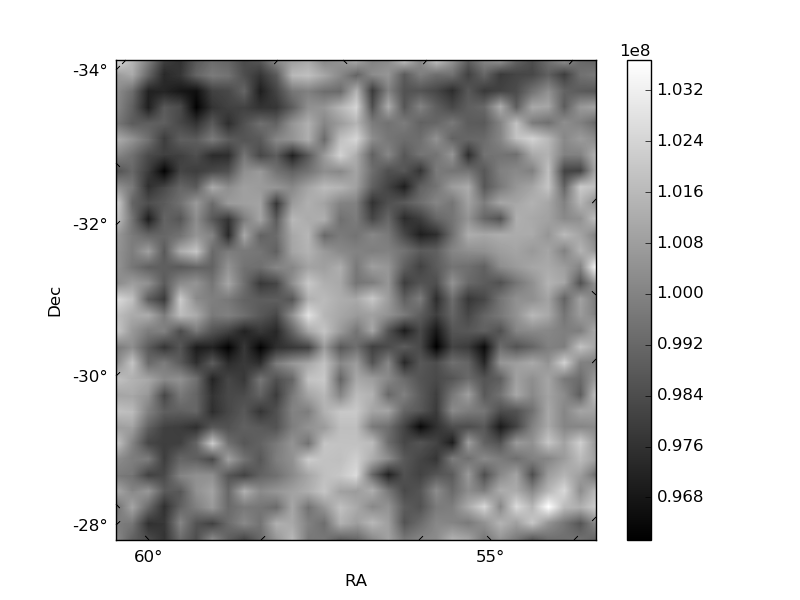
Histogram calculated using DETX and DETY for each event in the final _common_clean file
| Quadrant A |  |
 |
Quadrant B |
|---|---|---|---|
| Quadrant D |  |
 |
Quadrant C |
| Plot type | Count rate plots | Images |
|---|---|---|
| Comparison with Poisson distribution Blue bars denote a histogram of data divided into 1 sec bins. Red curve is a Poisson curve with rate = median count rate of data. |
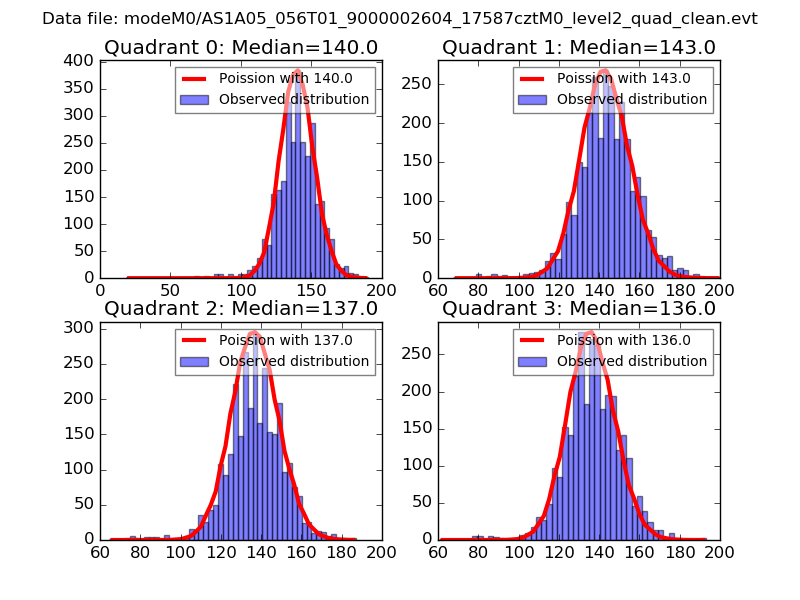 |
 |
| Quadrant-wise count rates Data is divided into 100 sec bins |
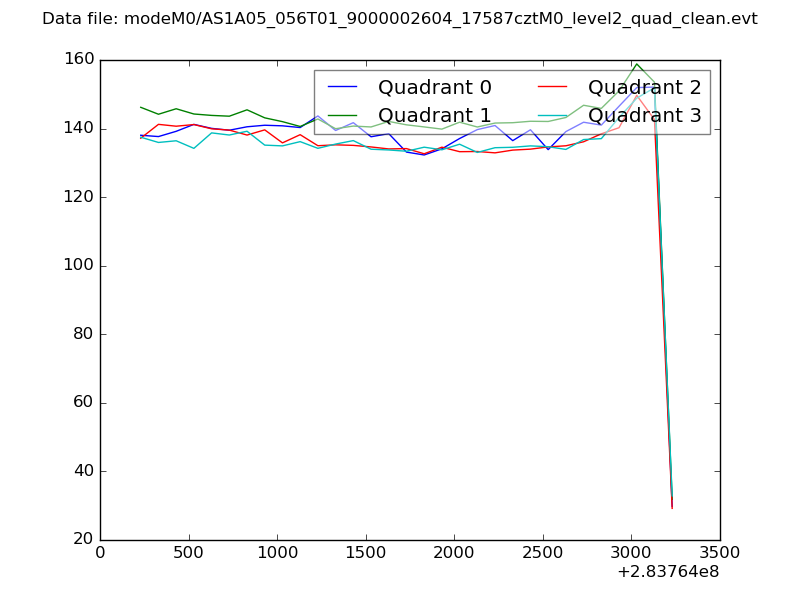 |
|
| Module-wise count rates for Quadrant A Data is divided into 100 sec bins |
 |
 |
| Module-wise count rates for Quadrant B Data is divided into 100 sec bins |
 |
 |
| Module-wise count rates for Quadrant C Data is divided into 100 sec bins |
 |
 |
| Module-wise count rates for Quadrant D Data is divided into 100 sec bins |
 |
 |
| Parameter | Plot |
|---|---|
| CZT HV Monitor |  |
| D_VDD |  |
| Temperature 1 |  |
| Veto HV Monitor |  |
| Veto LLD |  |
| Alpha Counter | 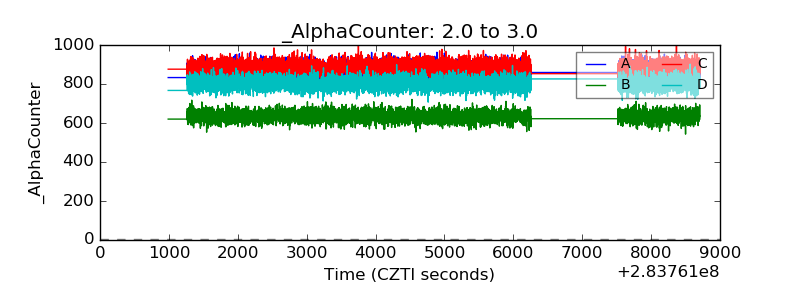 |
| _CPM_Rate | 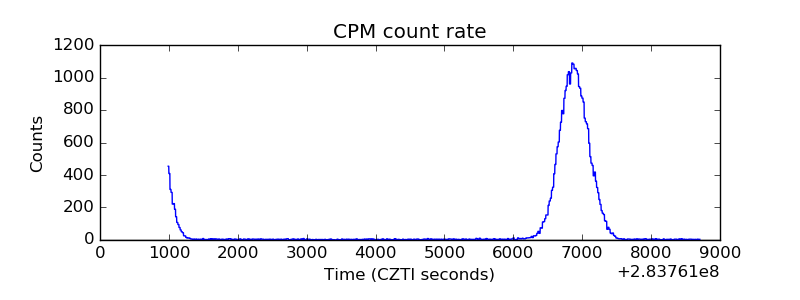 |
| CZT Counter |  |
| +2.5 Volts monitor |  |
| +5 Volts monitor |  |
| _ROLL_ROT |  |
| _Roll_DEC |  |
| _Roll_RA |  |
| Veto Counter |  |