| Param | Original file | Final file |
|---|---|---|
| Filename | modeM0/AS1A05_056T01_9000002604_17588cztM0_level2.evt | modeM0/AS1A05_056T01_9000002604_17588cztM0_level2_quad_clean.evt |
| Size (bytes) | 529,211,520 | 88,539,840 |
| Size | 504.7 MB | 84.4 MB |
| Events in quadrant A | 4,141,860 | 560,137 |
| Events in quadrant B | 3,568,977 | 567,191 |
| Events in quadrant C | 4,335,450 | 539,698 |
| Events in quadrant D | 3,519,839 | 540,137 |
| Mode M9 | |||
|---|---|---|---|
| Quadrant | BADHDUFLAG | Total packets | Discarded packets |
| A | 0 | 24 | 0 |
| B | 0 | 24 | 0 |
| C | 0 | 24 | 0 |
| D | 0 | 24 | 0 |
| Mode M0 | |||
|---|---|---|---|
| Quadrant | BADHDUFLAG | Total packets | Discarded packets |
| A | 0 | 16581 | 2 |
| B | 0 | 14650 | 2 |
| C | 0 | 17495 | 2 |
| D | 0 | 14747 | 2 |
| Mode SS | |||
|---|---|---|---|
| Quadrant | BADHDUFLAG | Total packets | Discarded packets |
| A | 0 | 138 | 0 |
| B | 0 | 138 | 0 |
| C | 0 | 138 | 0 |
| D | 0 | 138 | 0 |
| Quadrant | Total seconds | Saturated seconds | Saturation percentage |
|---|---|---|---|
| A | 6802 | 266 | 3.910615% |
| B | 6802 | 249 | 3.660688% |
| C | 6802 | 324 | 4.763305% |
| D | 6802 | 197 | 2.896207% |
Noise dominated data is calculated using 1-second bins in cleaned event files. If a bin has >2000 counts, and if more than 50% of those come from <1% of pixels, then it is considered to be noise-dominated and hence unusable.
| Quadrant | # 1 sec bins | Bins with >0 counts | Bins with >2000 counts | High rate bins dominated by noise | Noise dominated (total time) | Noise dominated (detector-on time) | Marked lightcurve |
|---|---|---|---|---|---|---|---|
| A | 9157 | 6802 | 22 | 22 | 0.24% | 0.32% | 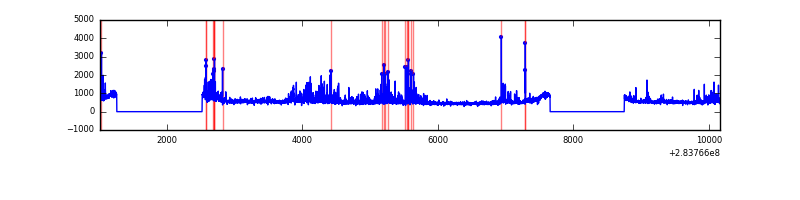 |
| B | 9157 | 6802 | 0 | 0 | 0.00% | 0.00% | 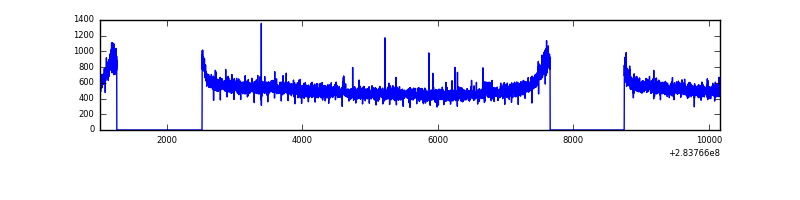 |
| C | 9157 | 6802 | 0 | 0 | 0.00% | 0.00% | 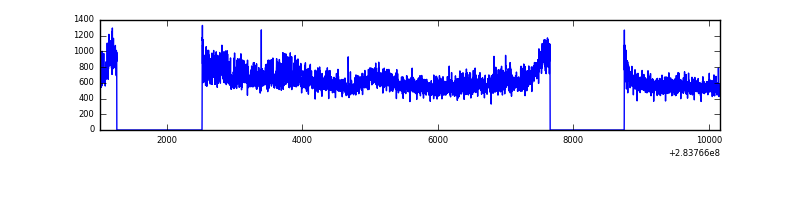 |
| D | 9157 | 6802 | 9 | 9 | 0.10% | 0.13% | 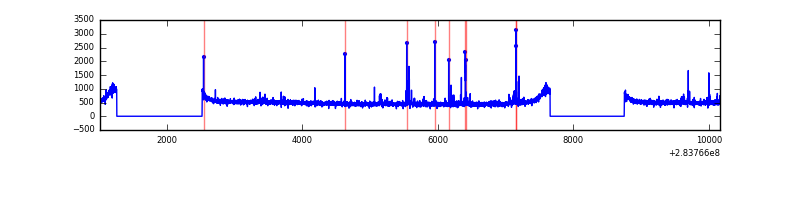 |
Top three noisy pixels from each quadrant. If the there are fewer than three noisy pixels in the level2.evt file, extra rows are filled as -1
| Pixel properties | Quadrant properties | ||||||
|---|---|---|---|---|---|---|---|
| Quadrant | DetID | PixID | Counts | Sigma | Mean | Median | Sigma |
| A | 14 | 237 | 633829 | 3434.77 | 913 | 895 | 184.3 |
| A | 0 | 226 | 7790 | 37.42 | 913 | 895 | 184.3 |
| A | 3 | 137 | 6810 | 32.1 | 913 | 895 | 184.3 |
| B | 12 | 111 | 21207 | 116.63 | 909 | 887 | 174.2 |
| B | 11 | 111 | 18331 | 100.12 | 909 | 887 | 174.2 |
| B | 14 | 111 | 16118 | 87.42 | 909 | 887 | 174.2 |
| C | 3 | 233 | 775742 | 3827.41 | 874 | 881 | 202.5 |
| C | 14 | 238 | 134750 | 661.24 | 874 | 881 | 202.5 |
| C | 5 | 218 | 17860 | 83.87 | 874 | 881 | 202.5 |
| D | 5 | 222 | 61585 | 278.24 | 896 | 869 | 218.2 |
| D | 13 | 189 | 22673 | 99.92 | 896 | 869 | 218.2 |
| D | 2 | 234 | 21189 | 93.12 | 896 | 869 | 218.2 |
Histogram calculated using DETX and DETY for each event in the final _common_clean file
| Quadrant A | 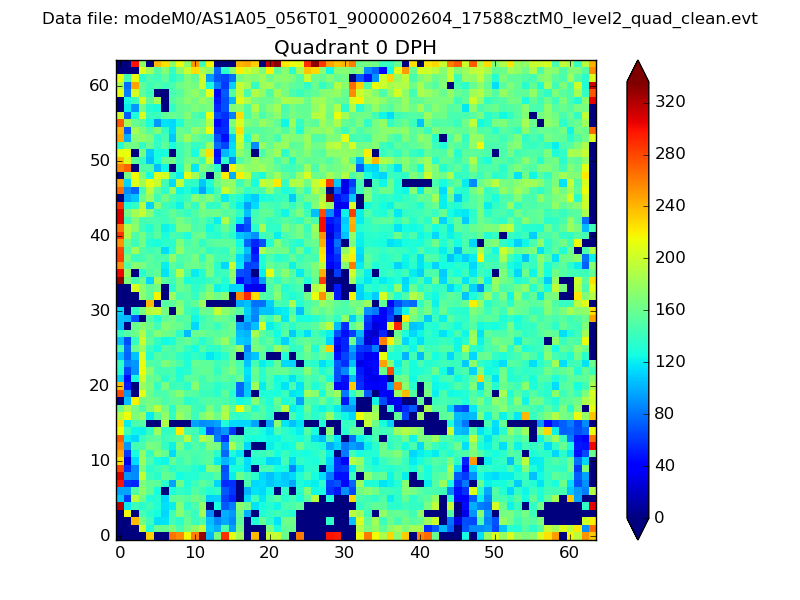 |
 |
Quadrant B |
|---|---|---|---|
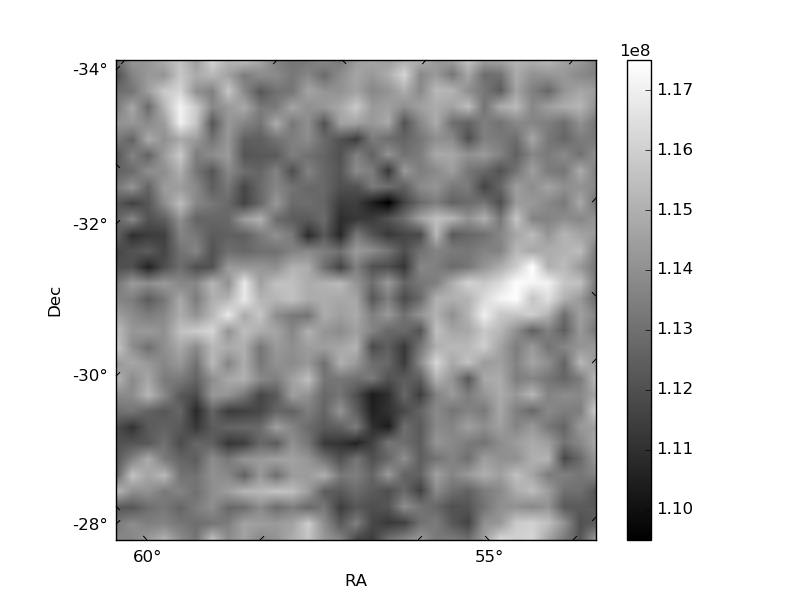
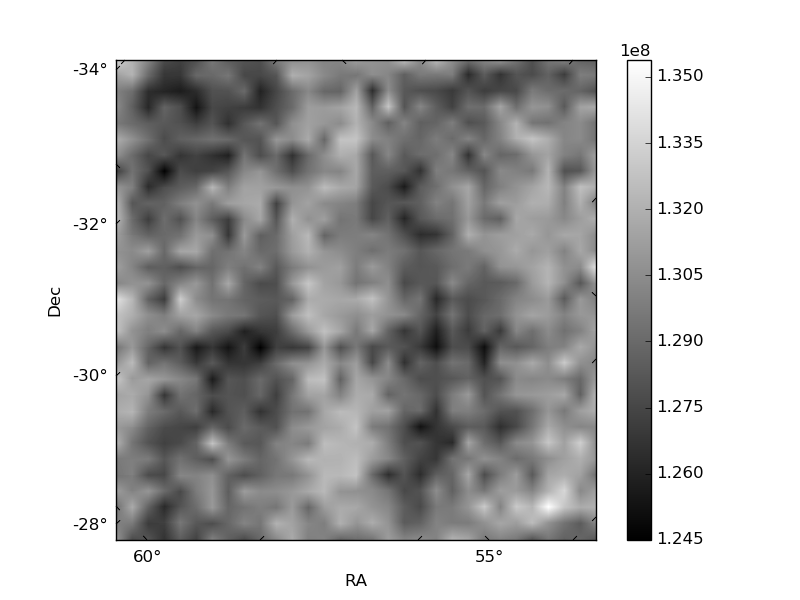
| Quadrant D | 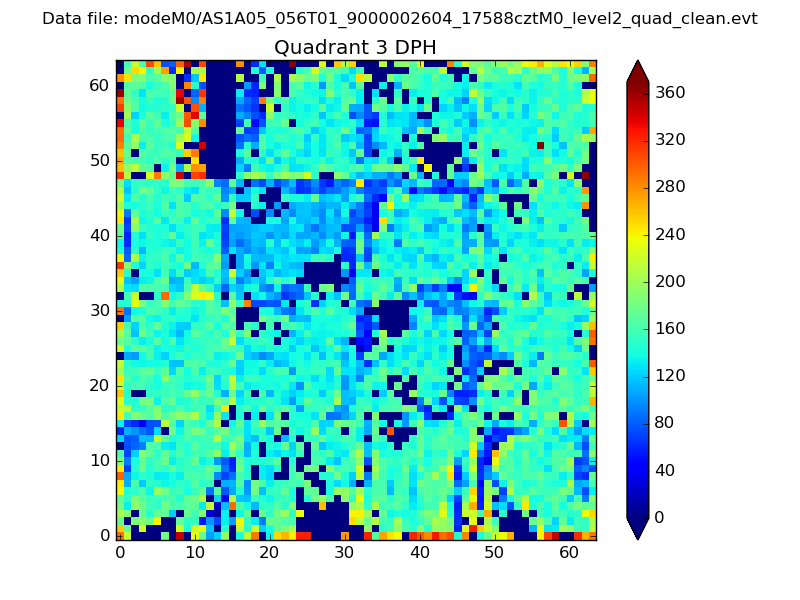 |
 |
Quadrant C |
| Plot type | Count rate plots | Images |
|---|---|---|
| Comparison with Poisson distribution Blue bars denote a histogram of data divided into 1 sec bins. Red curve is a Poisson curve with rate = median count rate of data. |
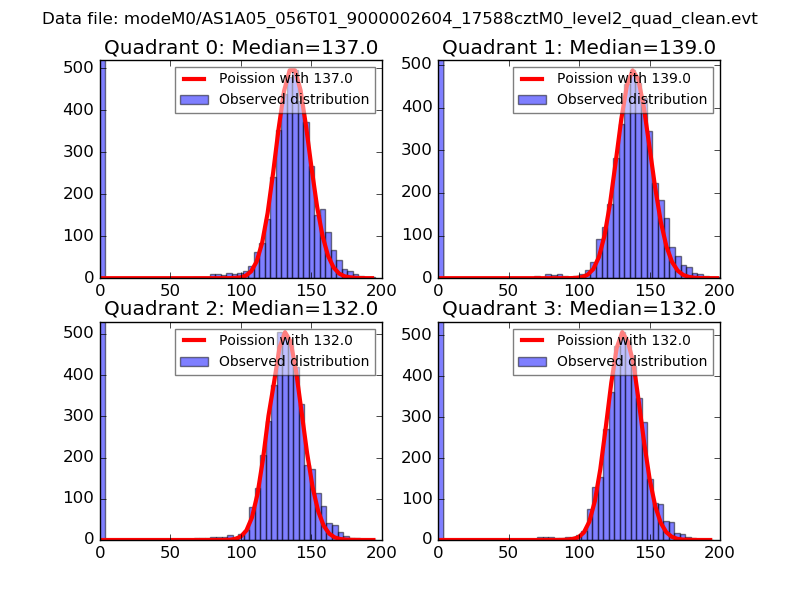 |
 |
| Quadrant-wise count rates Data is divided into 100 sec bins |
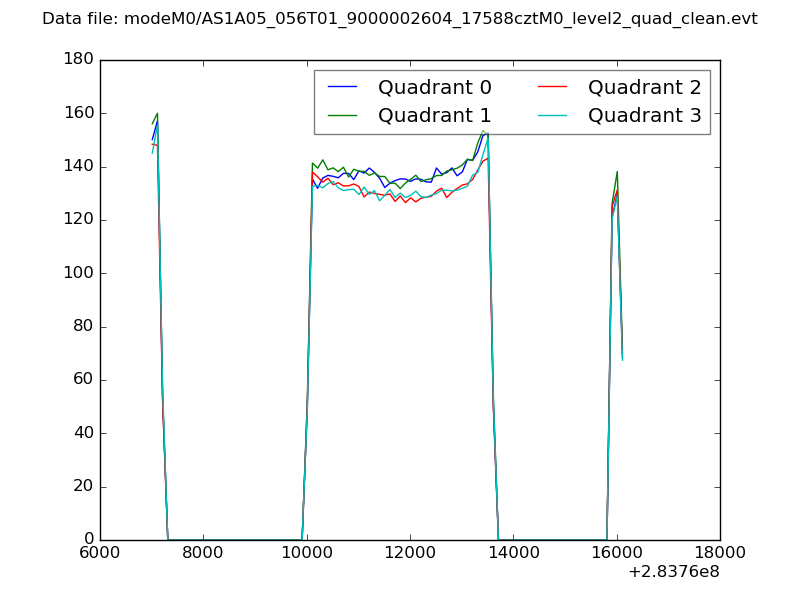 |
|
| Module-wise count rates for Quadrant A Data is divided into 100 sec bins |
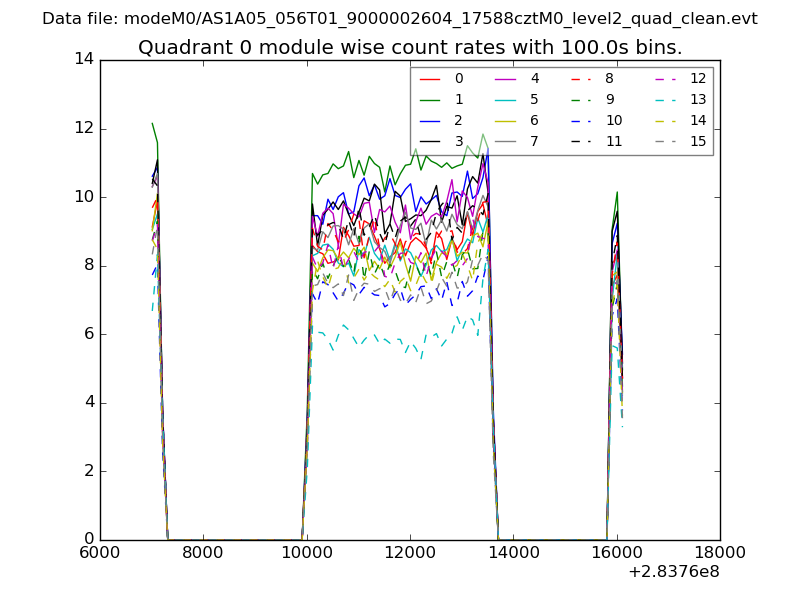 |
 |
| Module-wise count rates for Quadrant B Data is divided into 100 sec bins |
 |
 |
| Module-wise count rates for Quadrant C Data is divided into 100 sec bins |
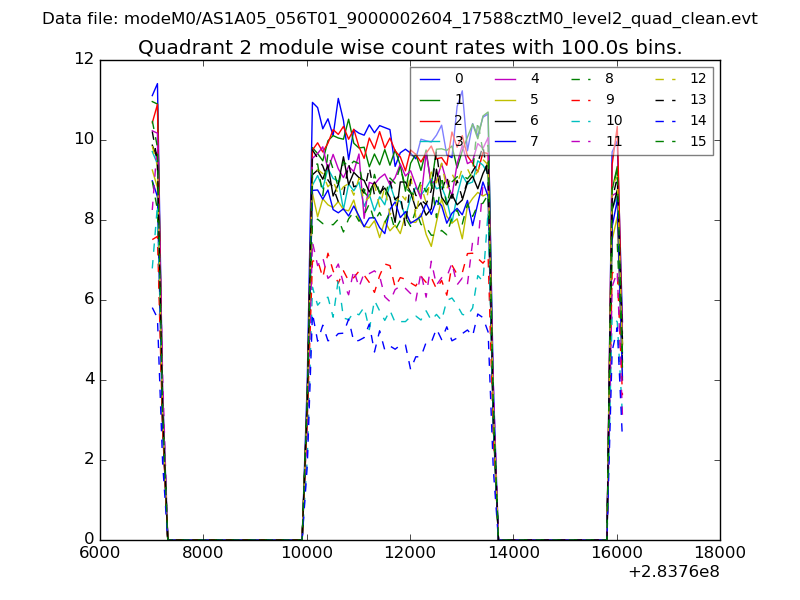 |
 |
| Module-wise count rates for Quadrant D Data is divided into 100 sec bins |
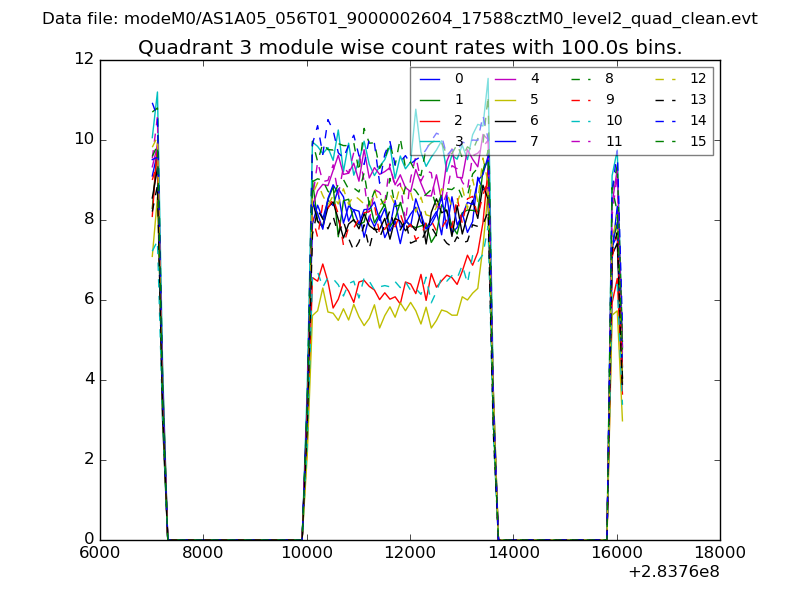 |
 |
| Parameter | Plot |
|---|---|
| CZT HV Monitor |  |
| D_VDD |  |
| Temperature 1 | 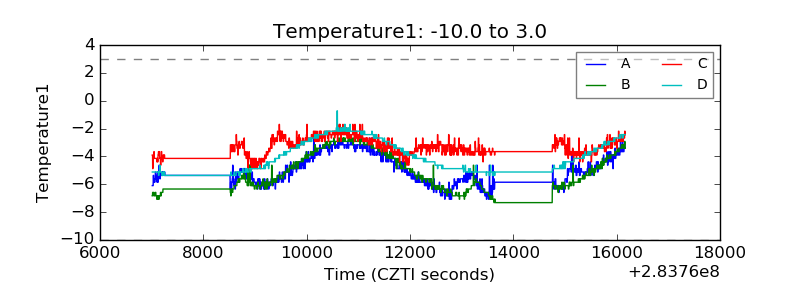 |
| Veto HV Monitor | 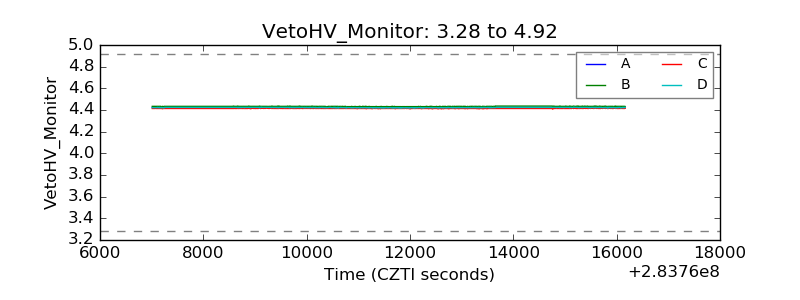 |
| Veto LLD | 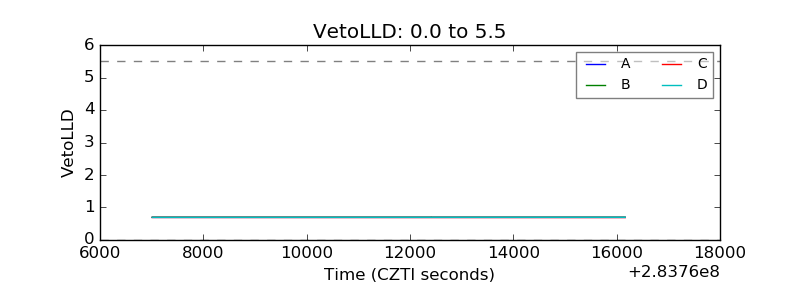 |
| Alpha Counter | 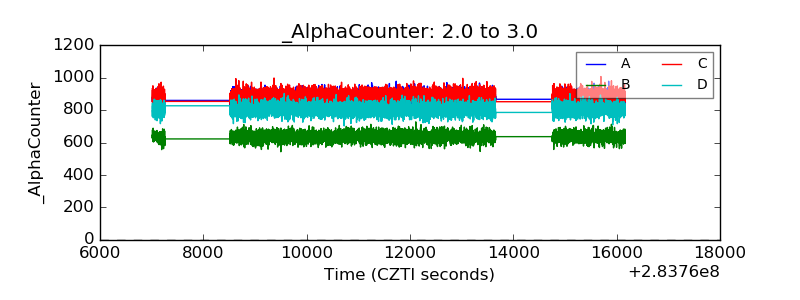 |
| _CPM_Rate | 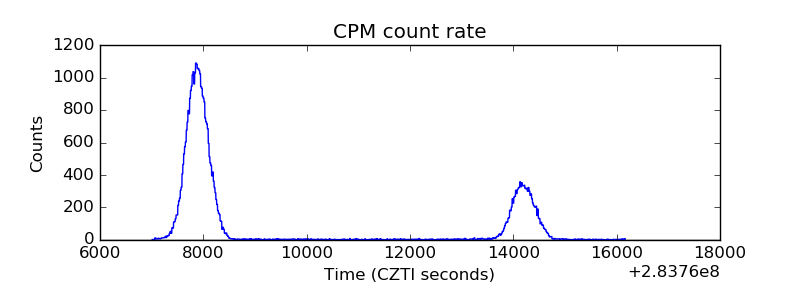 |
| CZT Counter | 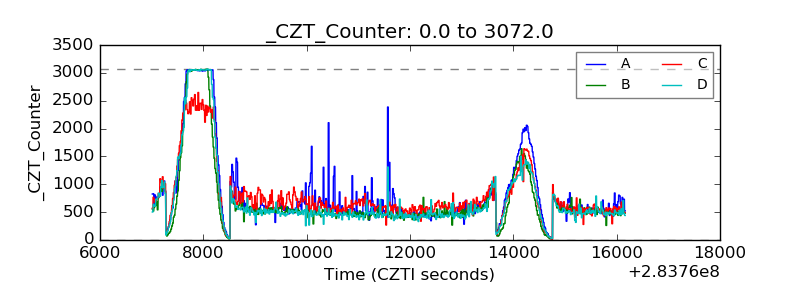 |
| +2.5 Volts monitor |  |
| +5 Volts monitor | 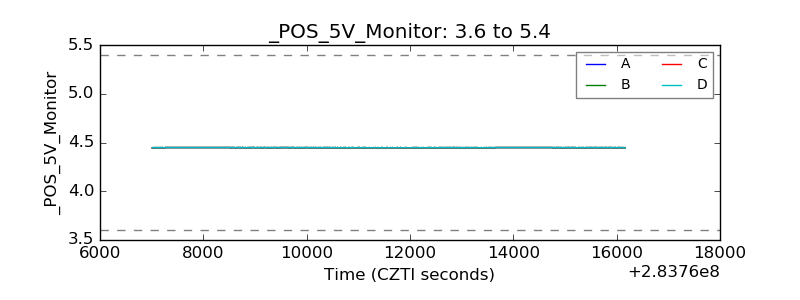 |
| _ROLL_ROT | 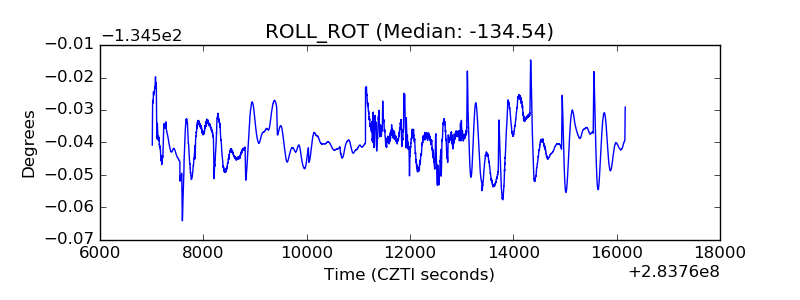 |
| _Roll_DEC | 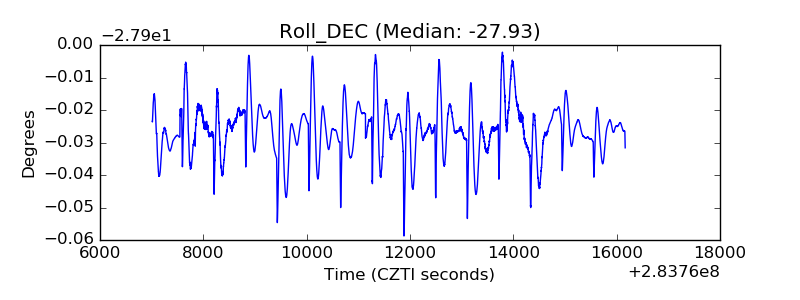 |
| _Roll_RA | 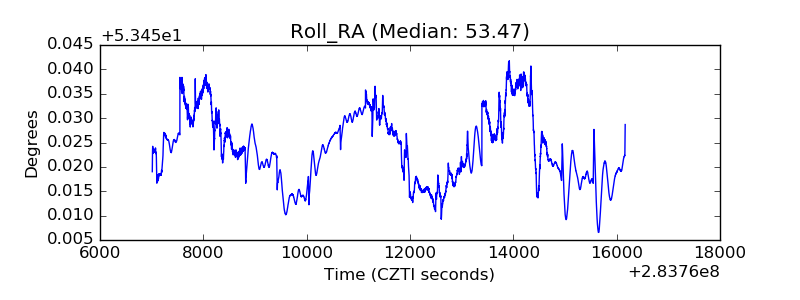 |
| Veto Counter | 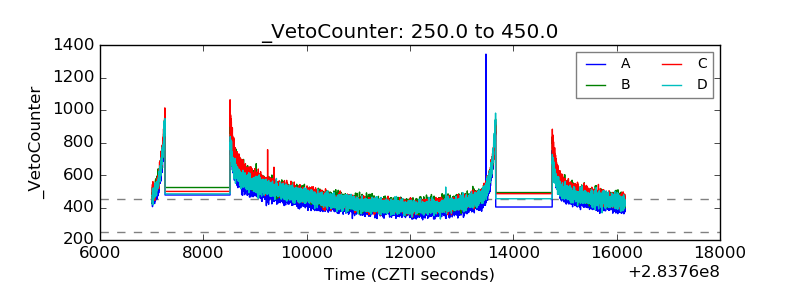 |