| Param | Original file | Final file |
|---|---|---|
| Filename | modeM0/AS1A05_056T01_9000002604_17589cztM0_level2.evt | modeM0/AS1A05_056T01_9000002604_17589cztM0_level2_quad_clean.evt |
| Size (bytes) | 487,117,440 | 88,243,200 |
| Size | 464.6 MB | 84.2 MB |
| Events in quadrant A | 3,483,483 | 558,882 |
| Events in quadrant B | 3,362,911 | 562,685 |
| Events in quadrant C | 3,976,078 | 537,159 |
| Events in quadrant D | 3,465,430 | 537,055 |
| Mode M9 | |||
|---|---|---|---|
| Quadrant | BADHDUFLAG | Total packets | Discarded packets |
| A | 0 | 18 | 0 |
| B | 0 | 19 | 0 |
| C | 0 | 19 | 0 |
| D | 0 | 19 | 0 |
| Mode M0 | |||
|---|---|---|---|
| Quadrant | BADHDUFLAG | Total packets | Discarded packets |
| A | 0 | 14653 | 2 |
| B | 0 | 14234 | 2 |
| C | 0 | 16150 | 2 |
| D | 0 | 14823 | 2 |
| Mode SS | |||
|---|---|---|---|
| Quadrant | BADHDUFLAG | Total packets | Discarded packets |
| A | 0 | 138 | 0 |
| B | 0 | 138 | 0 |
| C | 0 | 138 | 0 |
| D | 0 | 138 | 0 |
| Quadrant | Total seconds | Saturated seconds | Saturation percentage |
|---|---|---|---|
| A | 6842 | 107 | 1.563870% |
| B | 6842 | 129 | 1.885414% |
| C | 6842 | 167 | 2.440807% |
| D | 6842 | 89 | 1.300789% |
Noise dominated data is calculated using 1-second bins in cleaned event files. If a bin has >2000 counts, and if more than 50% of those come from <1% of pixels, then it is considered to be noise-dominated and hence unusable.
| Quadrant | # 1 sec bins | Bins with >0 counts | Bins with >2000 counts | High rate bins dominated by noise | Noise dominated (total time) | Noise dominated (detector-on time) | Marked lightcurve |
|---|---|---|---|---|---|---|---|
| A | 7687 | 6842 | 1 | 1 | 0.01% | 0.01% | 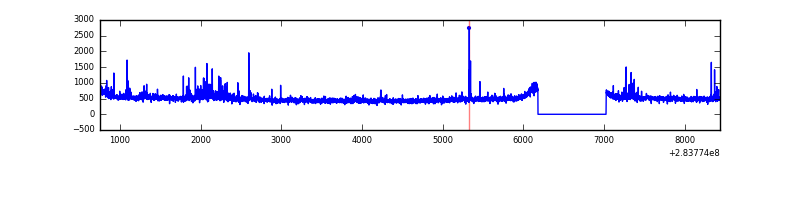 |
| B | 7687 | 6843 | 1 | 1 | 0.01% | 0.01% | 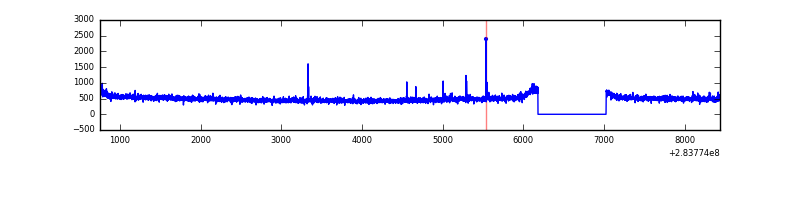 |
| C | 7687 | 6843 | 0 | 0 | 0.00% | 0.00% | 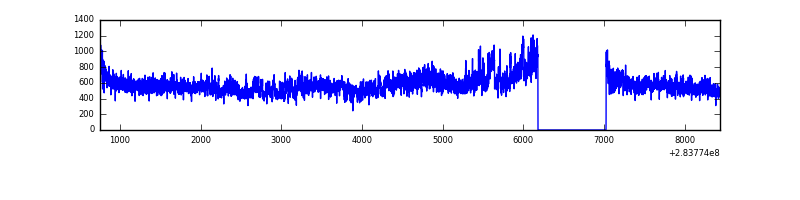 |
| D | 7687 | 6843 | 35 | 35 | 0.46% | 0.51% | 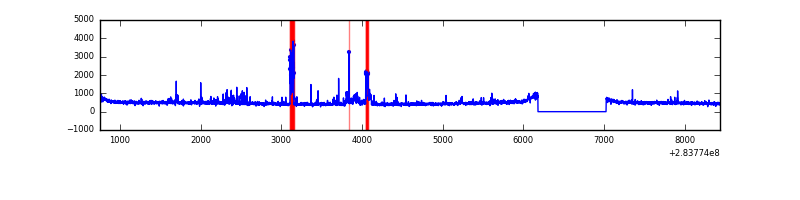 |
Top three noisy pixels from each quadrant. If the there are fewer than three noisy pixels in the level2.evt file, extra rows are filled as -1
| Pixel properties | Quadrant properties | ||||||
|---|---|---|---|---|---|---|---|
| Quadrant | DetID | PixID | Counts | Sigma | Mean | Median | Sigma |
| A | 14 | 237 | 192903 | 1117.3 | 856 | 837 | 171.9 |
| A | 0 | 226 | 7364 | 37.97 | 856 | 837 | 171.9 |
| A | 3 | 137 | 6594 | 33.49 | 856 | 837 | 171.9 |
| B | 4 | 80 | 21063 | 124.18 | 852 | 831 | 162.9 |
| B | 12 | 111 | 19896 | 117.02 | 852 | 831 | 162.9 |
| B | 11 | 111 | 17362 | 101.46 | 852 | 831 | 162.9 |
| C | 3 | 233 | 631424 | 3301.61 | 818 | 825 | 191.0 |
| C | 14 | 238 | 127509 | 663.28 | 818 | 825 | 191.0 |
| C | 5 | 218 | 27625 | 140.32 | 818 | 825 | 191.0 |
| D | 5 | 222 | 272507 | 1326.5 | 834 | 807 | 204.8 |
| D | 2 | 234 | 21447 | 100.77 | 834 | 807 | 204.8 |
| D | 13 | 189 | 15430 | 71.39 | 834 | 807 | 204.8 |
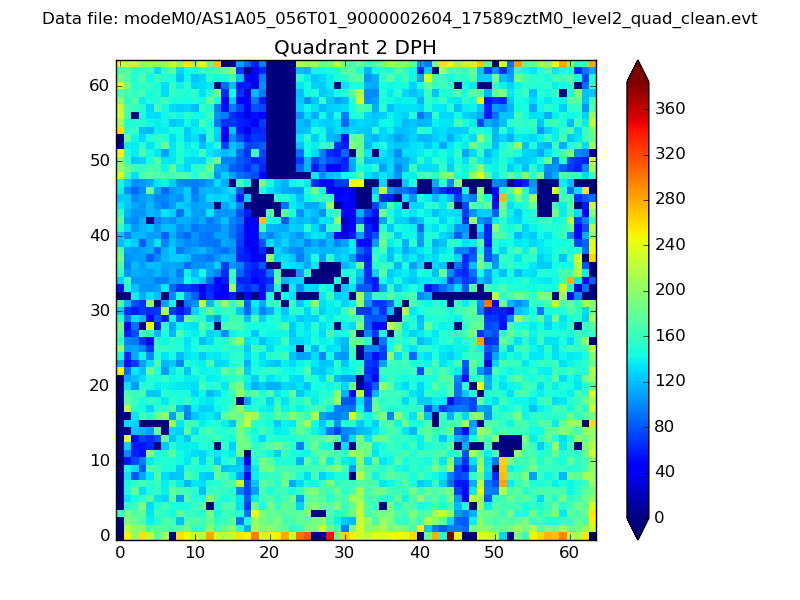
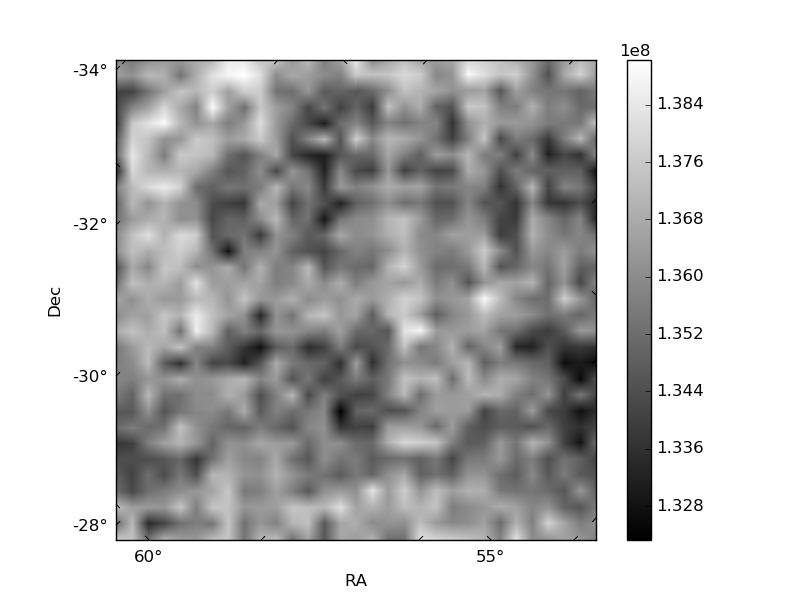
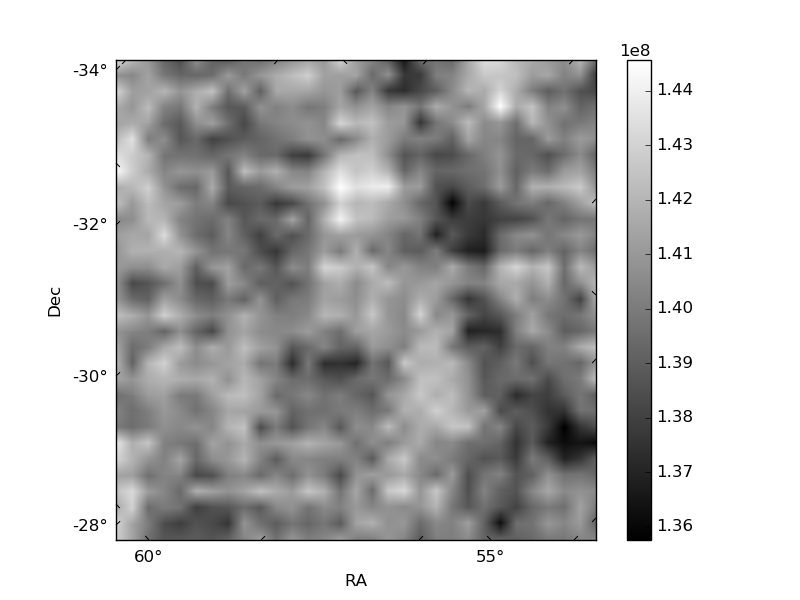
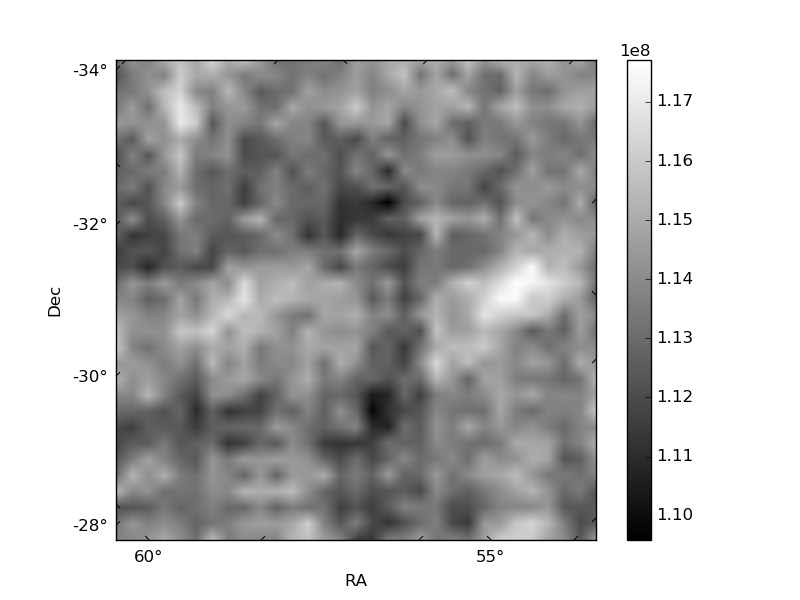
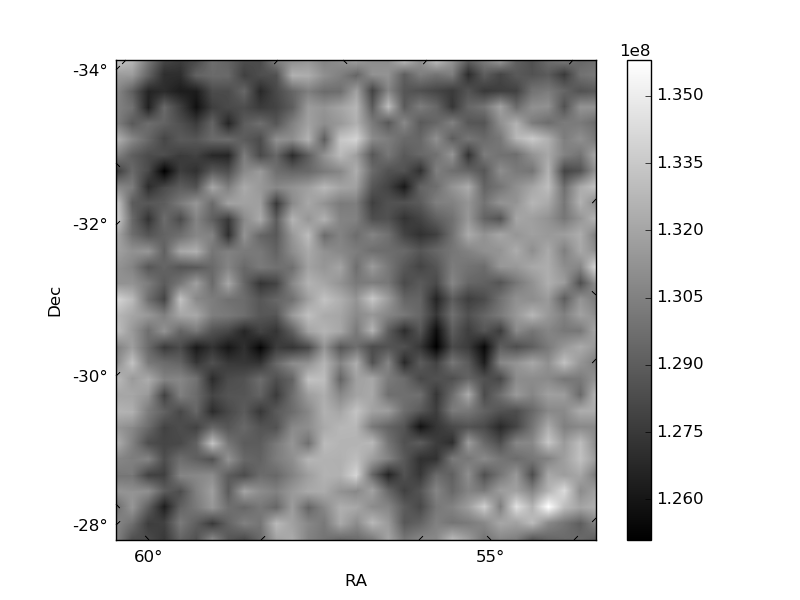
Histogram calculated using DETX and DETY for each event in the final _common_clean file
| Quadrant A | 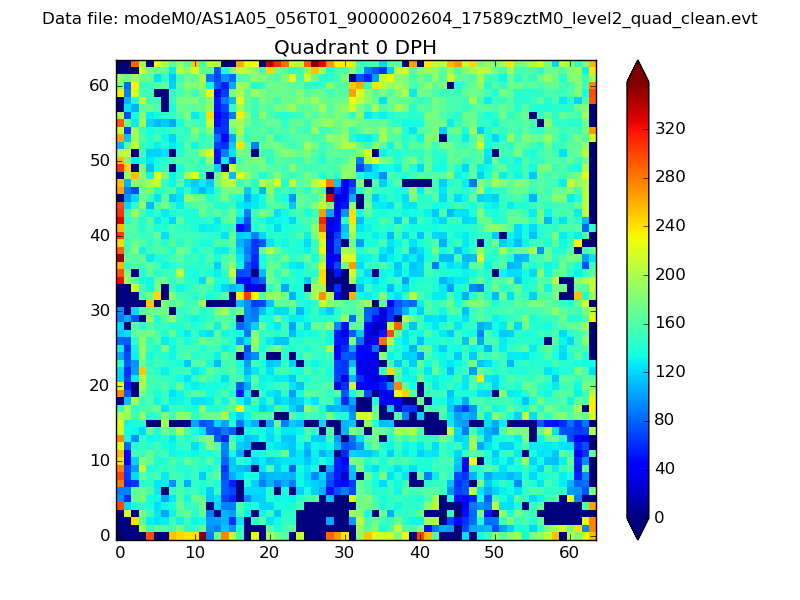 |
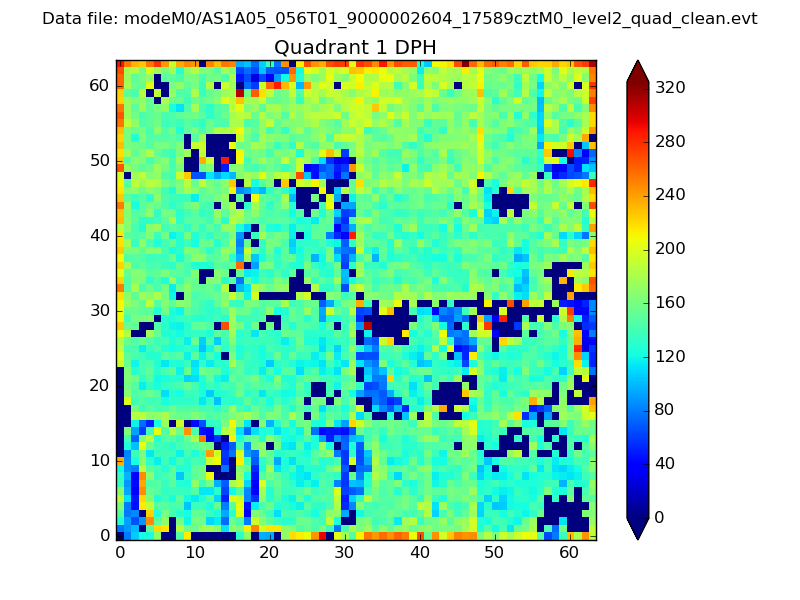 |
Quadrant B |
|---|---|---|---|
| Quadrant D | 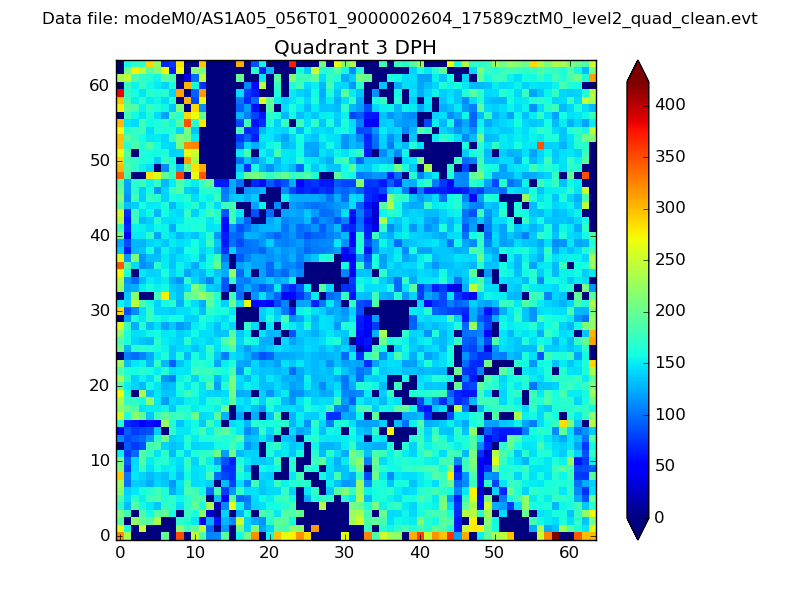 |
 |
Quadrant C |
| Plot type | Count rate plots | Images |
|---|---|---|
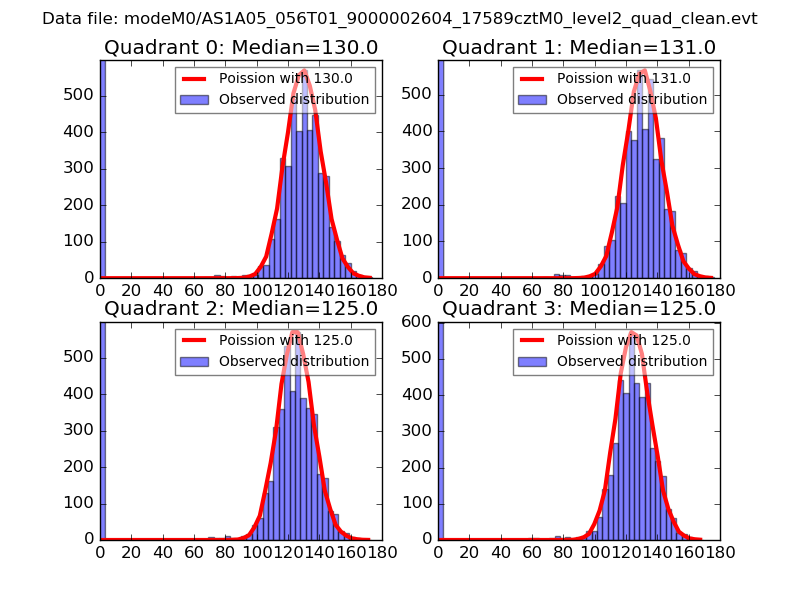
| Comparison with Poisson distribution Blue bars denote a histogram of data divided into 1 sec bins. Red curve is a Poisson curve with rate = median count rate of data. |
 |
 |
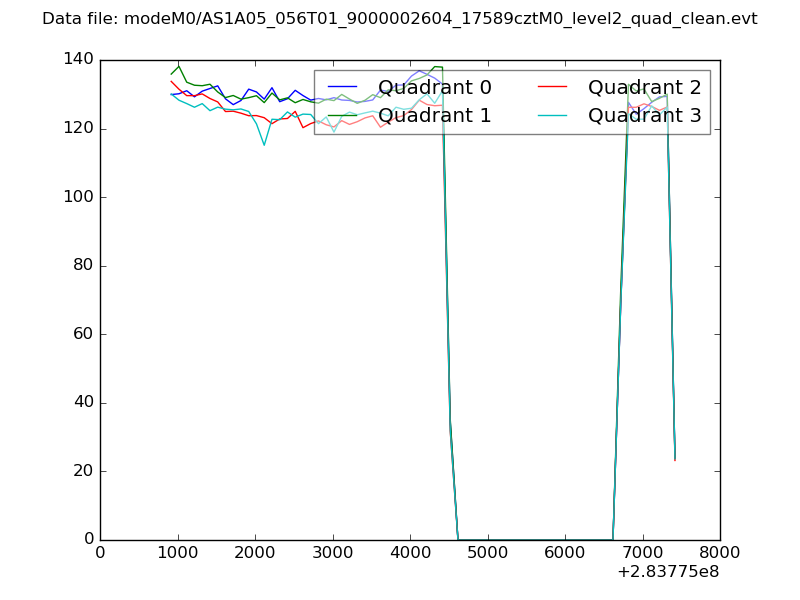
| Quadrant-wise count rates Data is divided into 100 sec bins |
 |
|
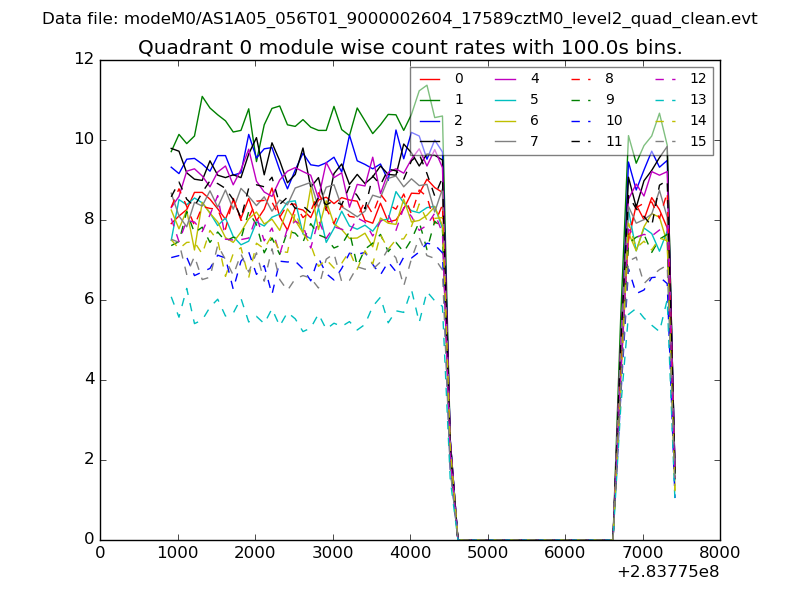
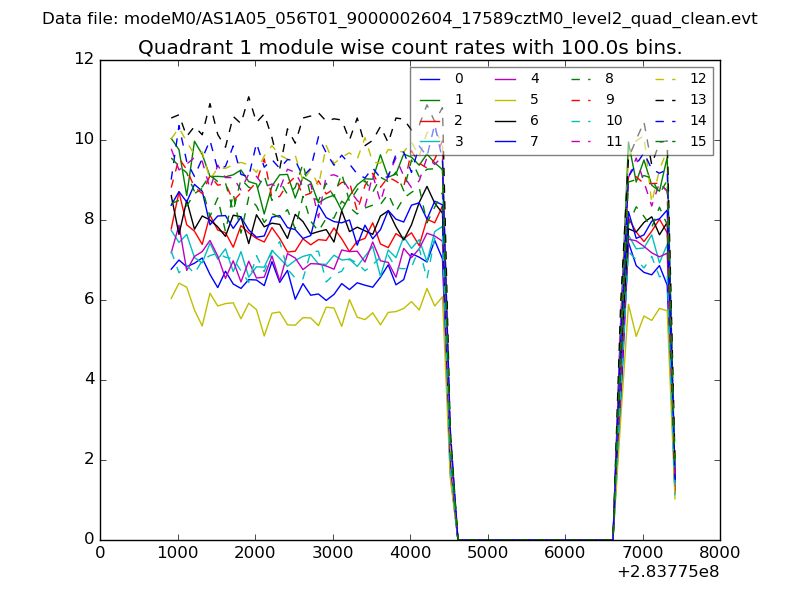
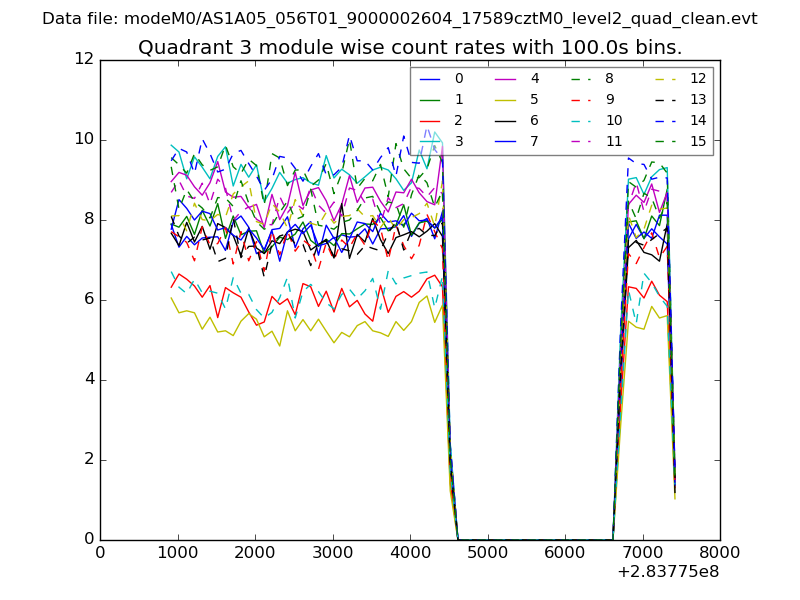
| Module-wise count rates for Quadrant A Data is divided into 100 sec bins |
 |
 |
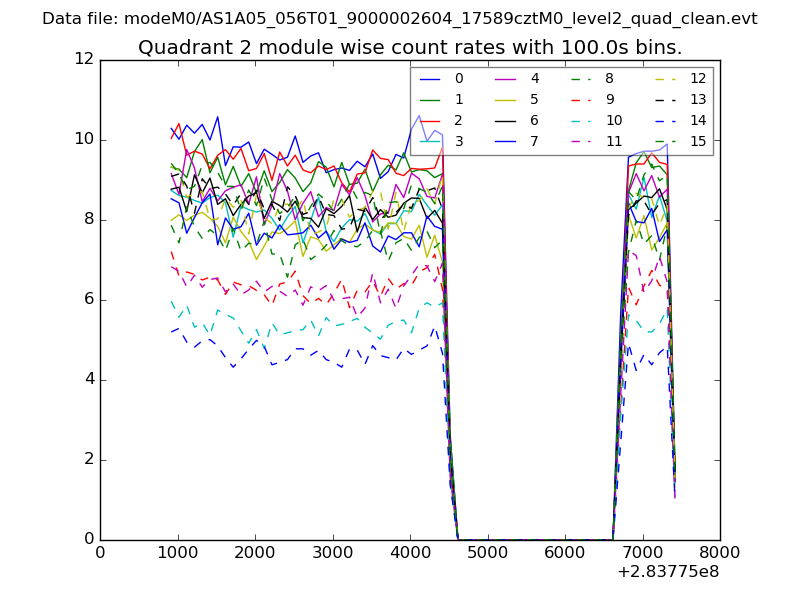
| Module-wise count rates for Quadrant B Data is divided into 100 sec bins |
 |
 |
| Module-wise count rates for Quadrant C Data is divided into 100 sec bins |
 |
 |
| Module-wise count rates for Quadrant D Data is divided into 100 sec bins |
 |
 |
| Parameter | Plot |
|---|---|
| CZT HV Monitor | 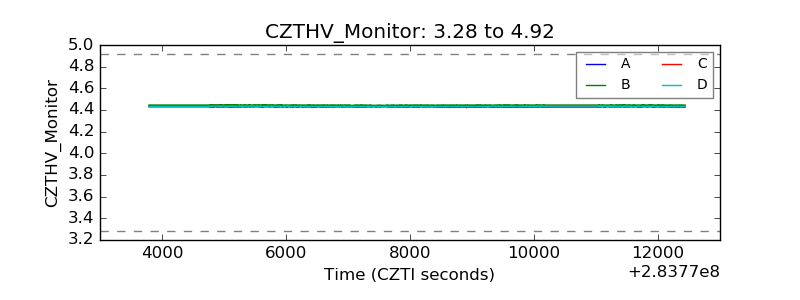 |
| D_VDD | 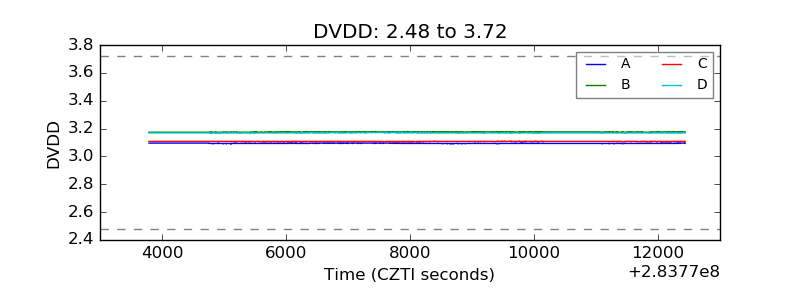 |
| Temperature 1 | 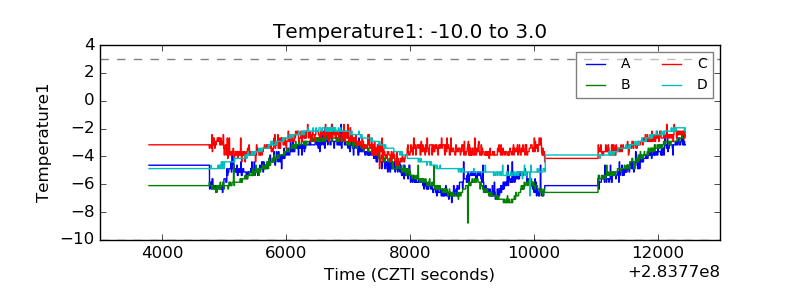 |
| Veto HV Monitor | 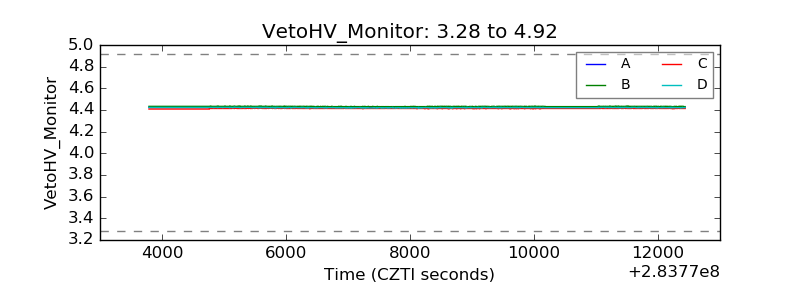 |
| Veto LLD |  |
| Alpha Counter | 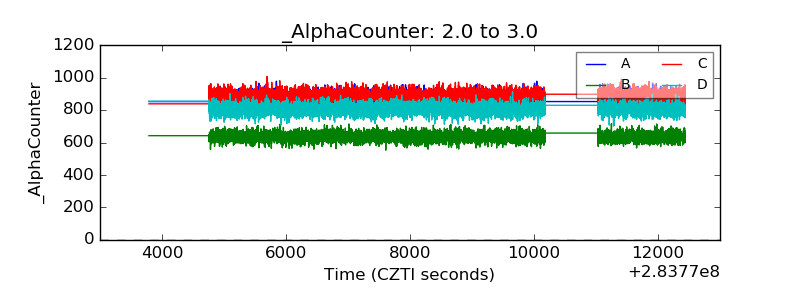 |
| _CPM_Rate | 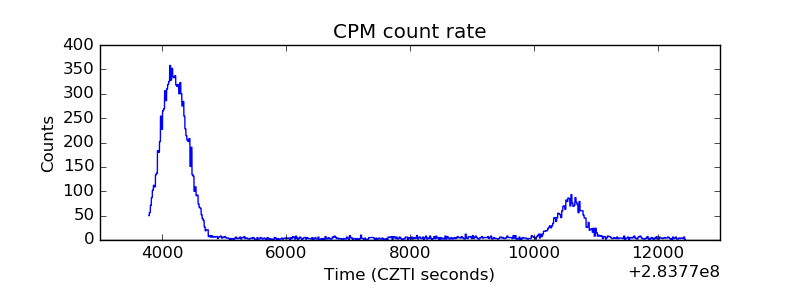 |
| CZT Counter | 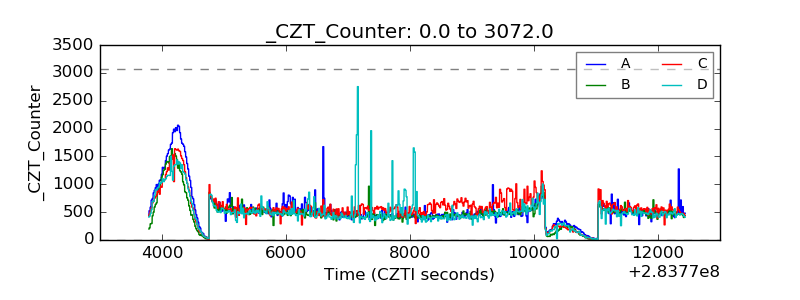 |
| +2.5 Volts monitor |  |
| +5 Volts monitor | 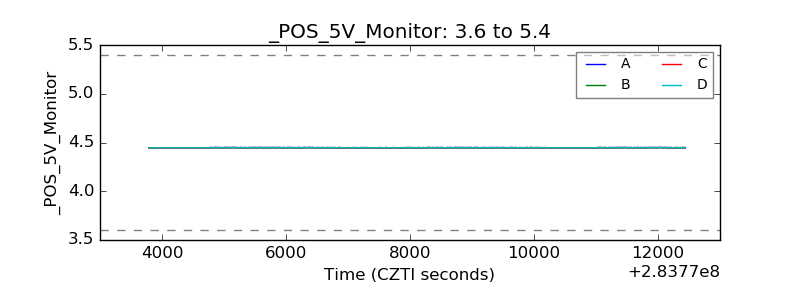 |
| _ROLL_ROT | 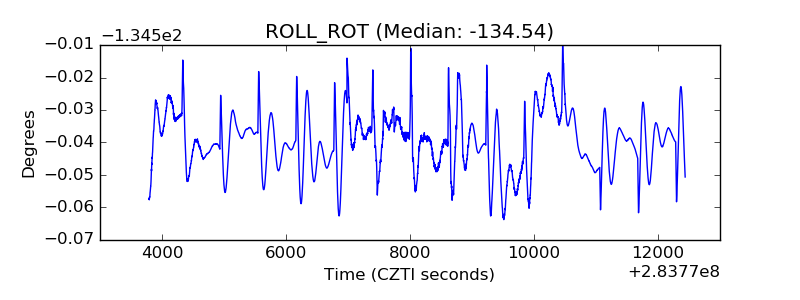 |
| _Roll_DEC | 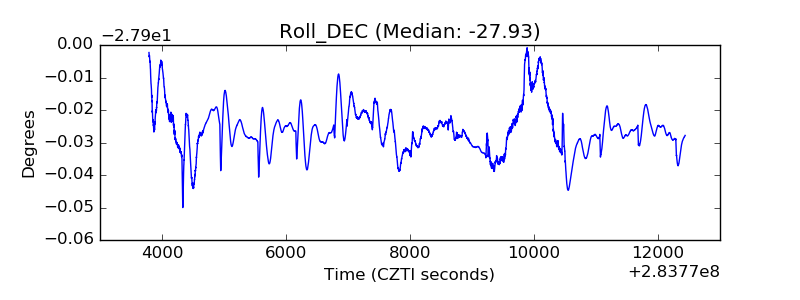 |
| _Roll_RA | 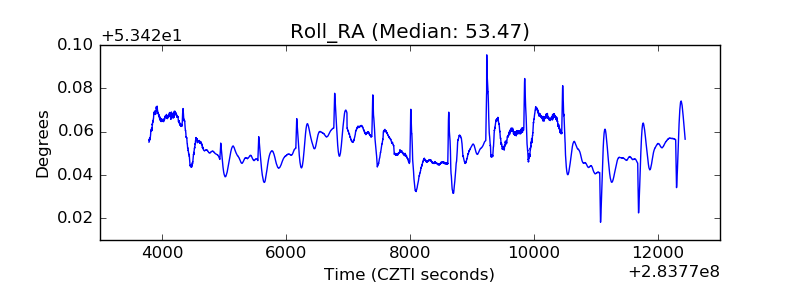 |
| Veto Counter | 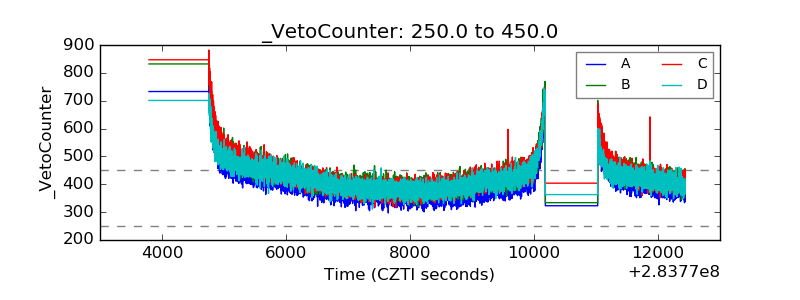 |