| Param | Original file | Final file |
|---|---|---|
| Filename | modeM0/AS1A05_056T01_9000002604_17591cztM0_level2.evt | modeM0/AS1A05_056T01_9000002604_17591cztM0_level2_quad_clean.evt |
| Size (bytes) | 496,344,960 | 96,318,720 |
| Size | 473.4 MB | 91.9 MB |
| Events in quadrant A | 3,579,109 | 618,571 |
| Events in quadrant B | 3,337,599 | 623,232 |
| Events in quadrant C | 4,368,739 | 591,440 |
| Events in quadrant D | 3,272,670 | 597,830 |
| Mode M9 | |||
|---|---|---|---|
| Quadrant | BADHDUFLAG | Total packets | Discarded packets |
| A | 0 | 2 | 0 |
| B | 0 | 2 | 0 |
| C | 0 | 2 | 0 |
| D | 0 | 2 | 0 |
| Mode M0 | |||
|---|---|---|---|
| Quadrant | BADHDUFLAG | Total packets | Discarded packets |
| A | 0 | 15241 | 2 |
| B | 0 | 14464 | 2 |
| C | 0 | 18206 | 2 |
| D | 0 | 14506 | 2 |
| Mode SS | |||
|---|---|---|---|
| Quadrant | BADHDUFLAG | Total packets | Discarded packets |
| A | 0 | 144 | 0 |
| B | 0 | 144 | 0 |
| C | 0 | 144 | 0 |
| D | 0 | 144 | 0 |
| Quadrant | Total seconds | Saturated seconds | Saturation percentage |
|---|---|---|---|
| A | 6973 | 131 | 1.878675% |
| B | 6973 | 112 | 1.606195% |
| C | 6973 | 156 | 2.237201% |
| D | 6973 | 57 | 0.817439% |
Noise dominated data is calculated using 1-second bins in cleaned event files. If a bin has >2000 counts, and if more than 50% of those come from <1% of pixels, then it is considered to be noise-dominated and hence unusable.
| Quadrant | # 1 sec bins | Bins with >0 counts | Bins with >2000 counts | High rate bins dominated by noise | Noise dominated (total time) | Noise dominated (detector-on time) | Marked lightcurve |
|---|---|---|---|---|---|---|---|
| A | 7208 | 6975 | 39 | 39 | 0.54% | 0.56% | 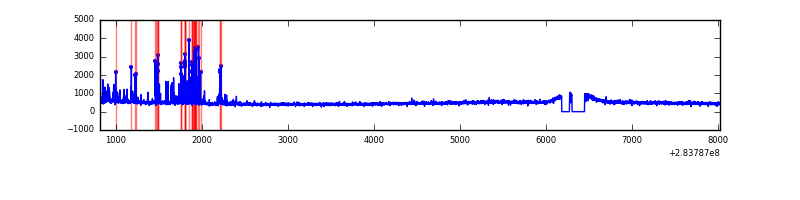 |
| B | 7208 | 6975 | 1 | 1 | 0.01% | 0.01% | 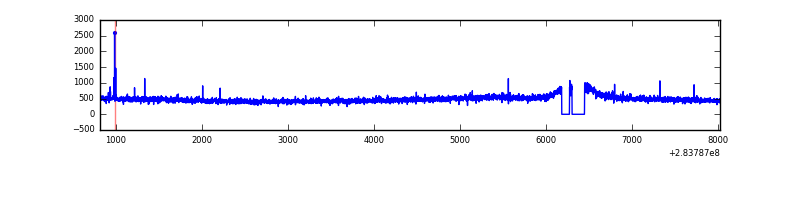 |
| C | 7208 | 6975 | 0 | 0 | 0.00% | 0.00% | 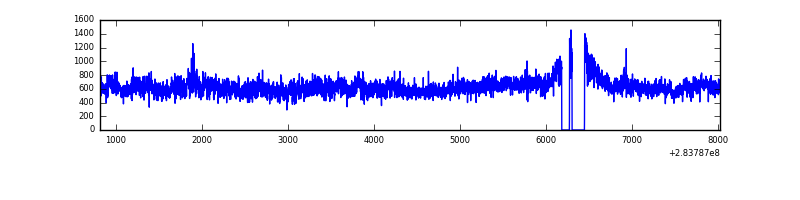 |
| D | 7208 | 6975 | 2 | 2 | 0.03% | 0.03% | 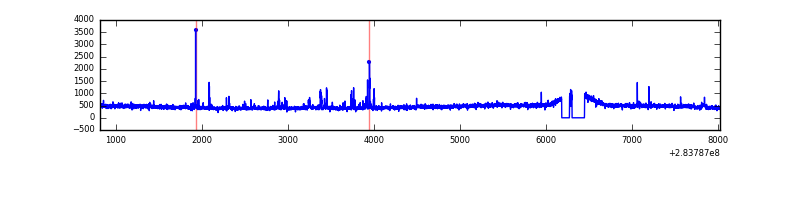 |
Top three noisy pixels from each quadrant. If the there are fewer than three noisy pixels in the level2.evt file, extra rows are filled as -1
| Pixel properties | Quadrant properties | ||||||
|---|---|---|---|---|---|---|---|
| Quadrant | DetID | PixID | Counts | Sigma | Mean | Median | Sigma |
| A | 14 | 237 | 317247 | 1838.04 | 849 | 832 | 172.1 |
| A | 0 | 226 | 7290 | 37.51 | 849 | 832 | 172.1 |
| A | 3 | 137 | 6714 | 34.17 | 849 | 832 | 172.1 |
| B | 12 | 111 | 20051 | 116.82 | 845 | 822 | 164.6 |
| B | 11 | 111 | 17617 | 102.03 | 845 | 822 | 164.6 |
| B | 14 | 111 | 14936 | 85.75 | 845 | 822 | 164.6 |
| C | 3 | 233 | 1050519 | 5544.57 | 805 | 809 | 189.3 |
| C | 14 | 238 | 122019 | 640.23 | 805 | 809 | 189.3 |
| C | 5 | 218 | 52725 | 274.22 | 805 | 809 | 189.3 |
| D | 13 | 189 | 94070 | 461.46 | 824 | 797 | 202.1 |
| D | 10 | 172 | 32110 | 154.92 | 824 | 797 | 202.1 |
| D | 2 | 234 | 24387 | 116.71 | 824 | 797 | 202.1 |
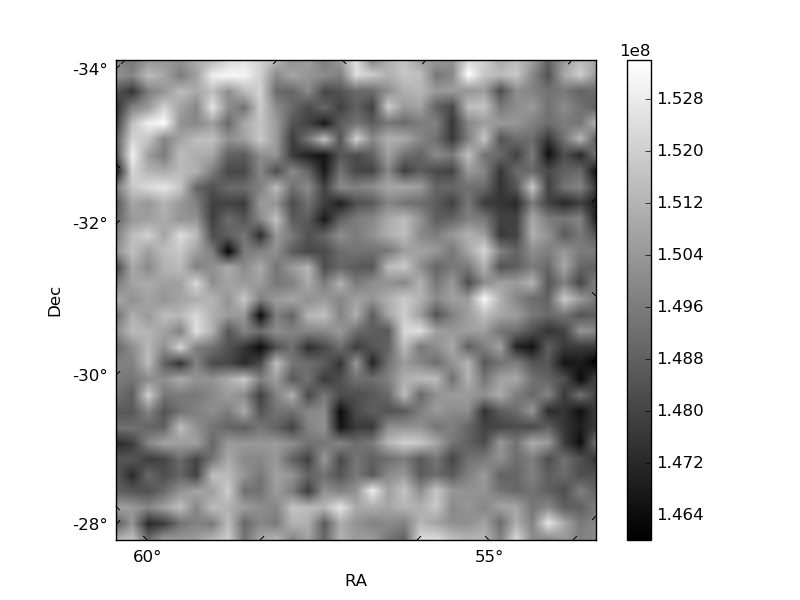
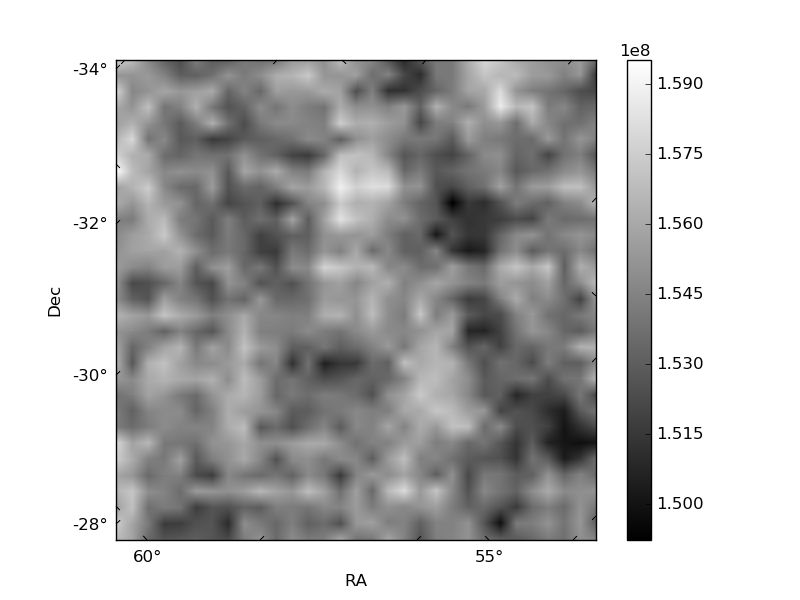
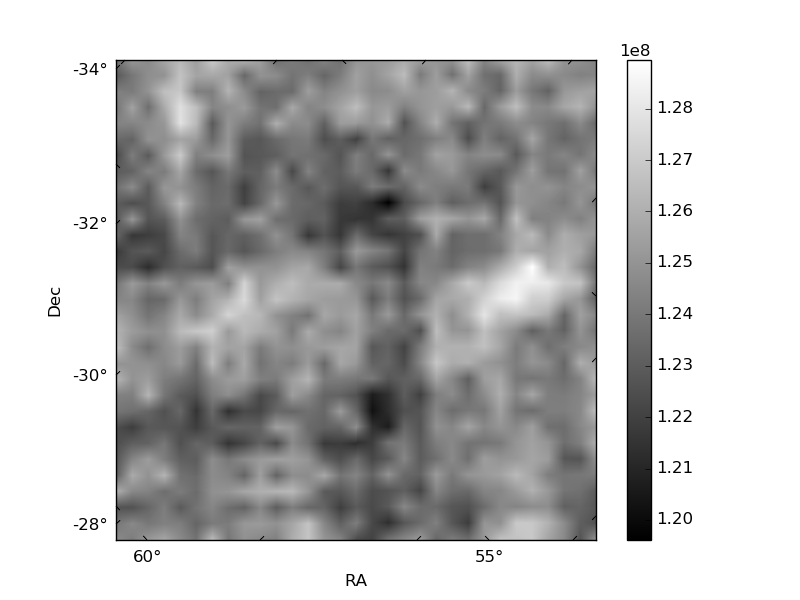
Histogram calculated using DETX and DETY for each event in the final _common_clean file
| Quadrant A | 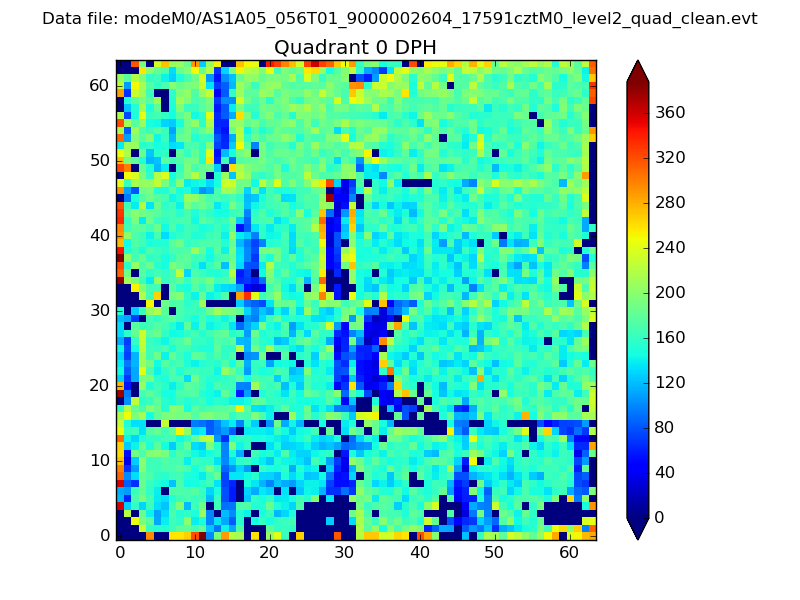 |
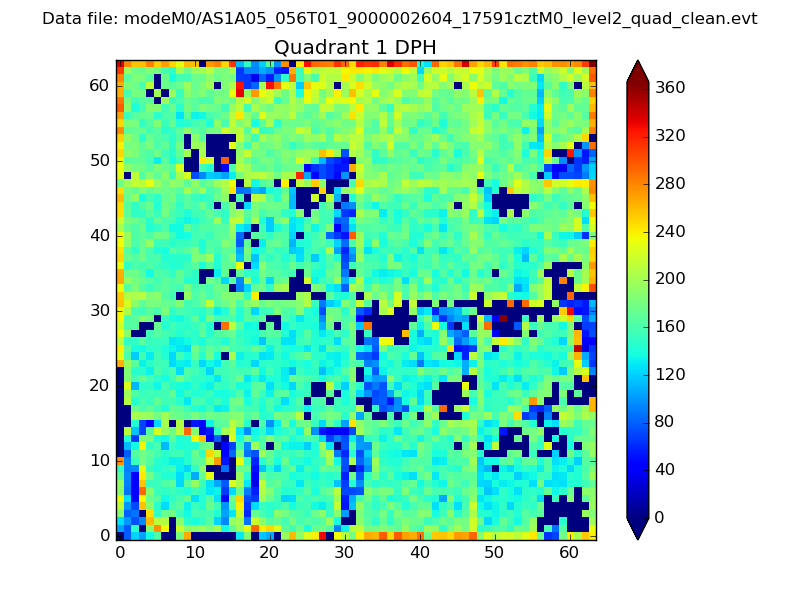 |
Quadrant B |
|---|---|---|---|
| Quadrant D |  |
 |
Quadrant C |
| Plot type | Count rate plots | Images |
|---|---|---|
| Comparison with Poisson distribution Blue bars denote a histogram of data divided into 1 sec bins. Red curve is a Poisson curve with rate = median count rate of data. |
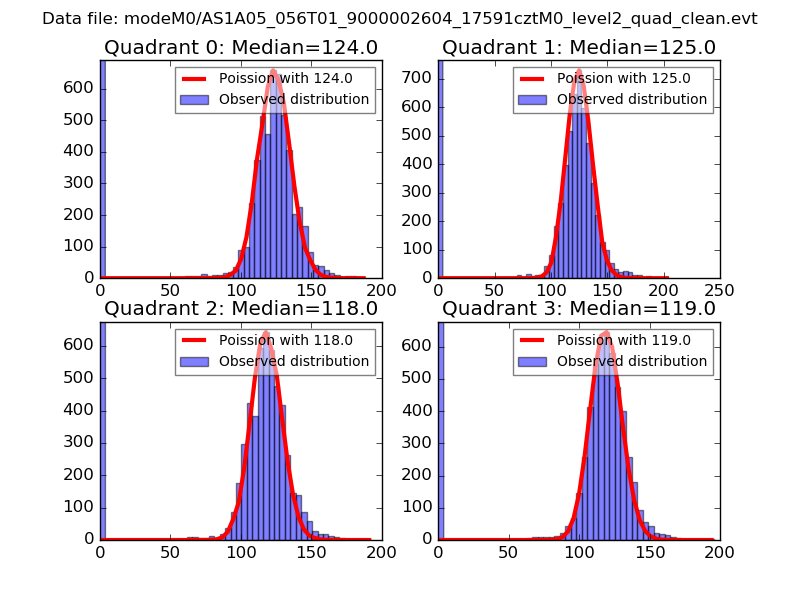 |
 |
| Quadrant-wise count rates Data is divided into 100 sec bins |
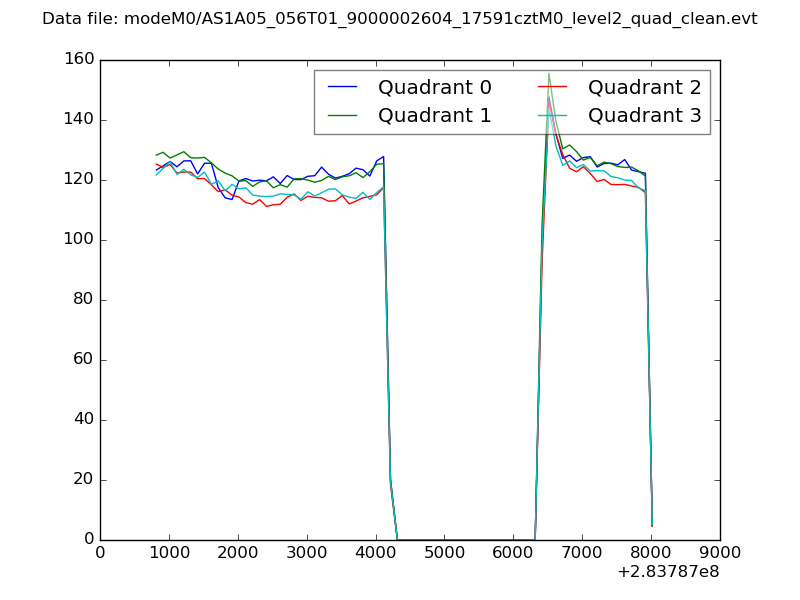 |
|
| Module-wise count rates for Quadrant A Data is divided into 100 sec bins |
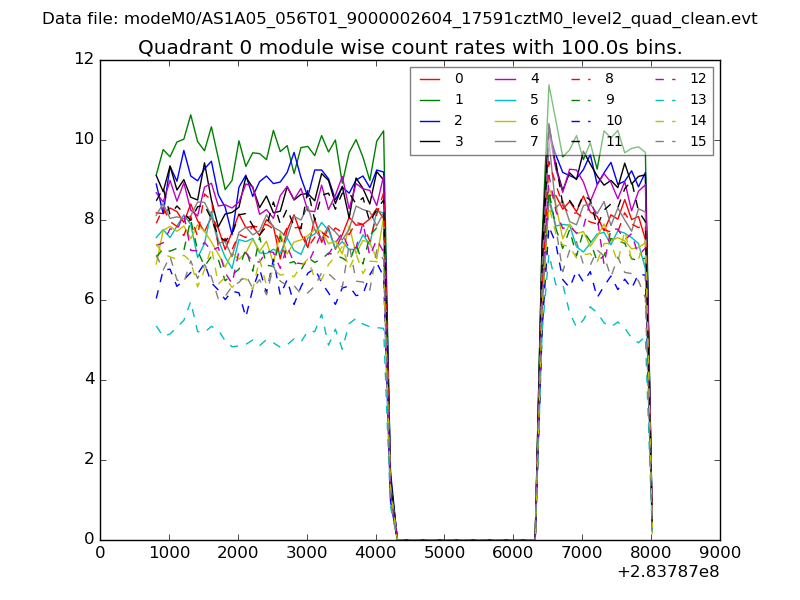 |
 |
| Module-wise count rates for Quadrant B Data is divided into 100 sec bins |
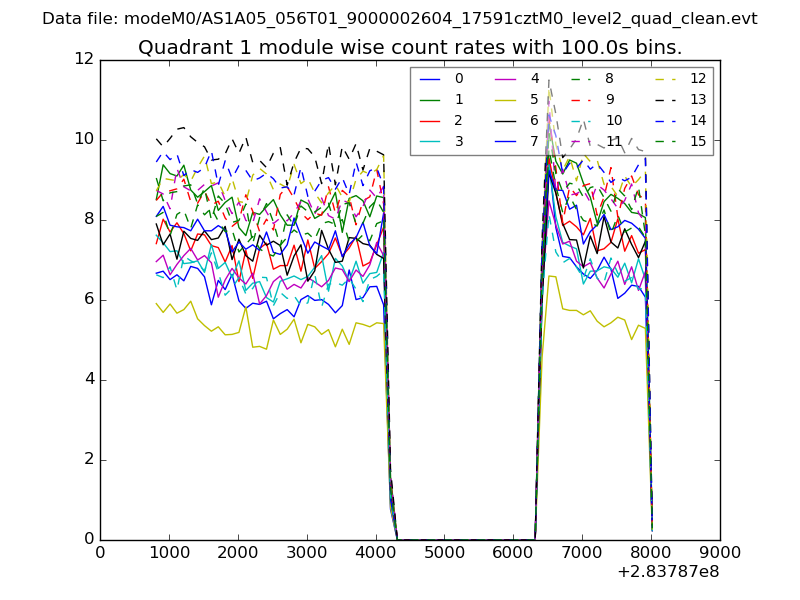 |
 |
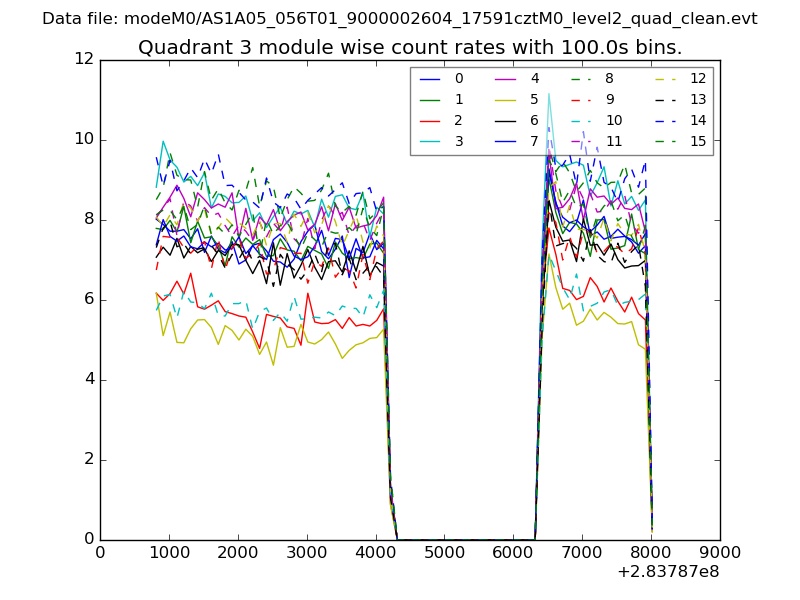
| Module-wise count rates for Quadrant C Data is divided into 100 sec bins |
 |
 |
| Module-wise count rates for Quadrant D Data is divided into 100 sec bins |
 |
 |
| Parameter | Plot |
|---|---|
| CZT HV Monitor | 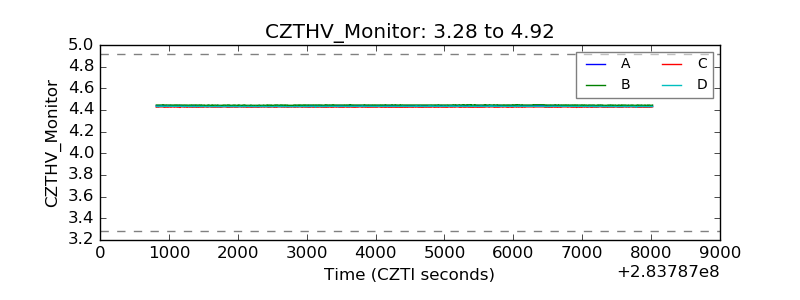 |
| D_VDD | 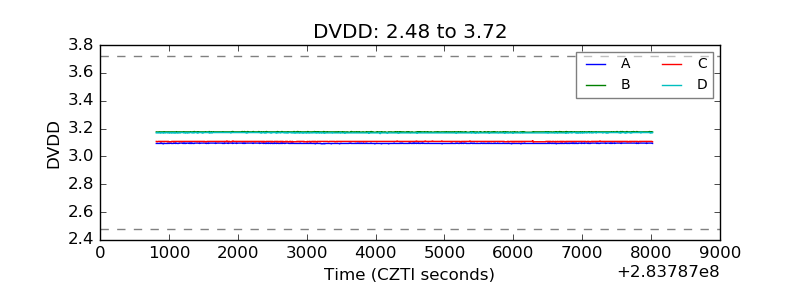 |
| Temperature 1 | 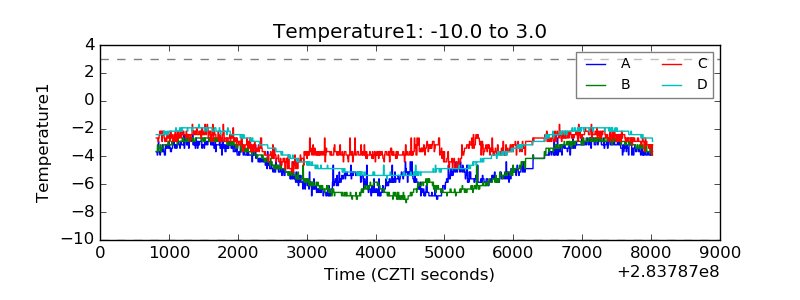 |
| Veto HV Monitor |  |
| Veto LLD | 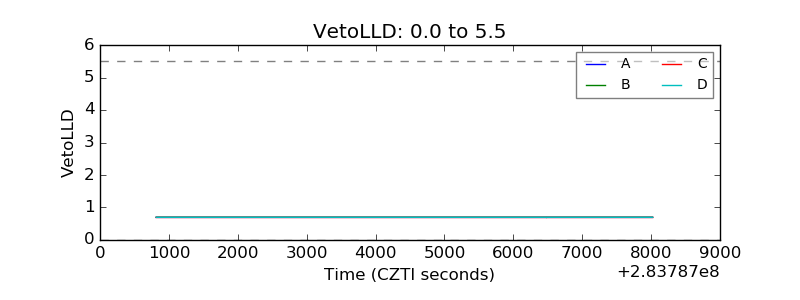 |
| Alpha Counter |  |
| _CPM_Rate | 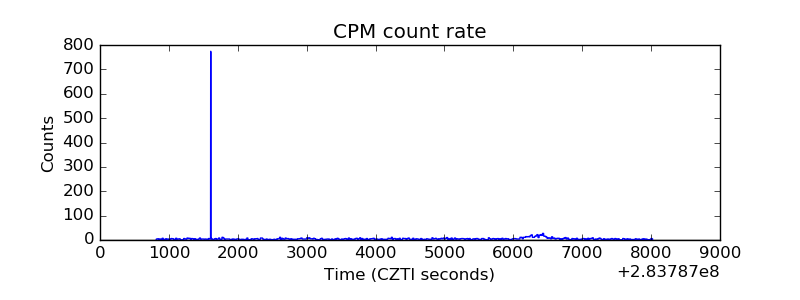 |
| CZT Counter | 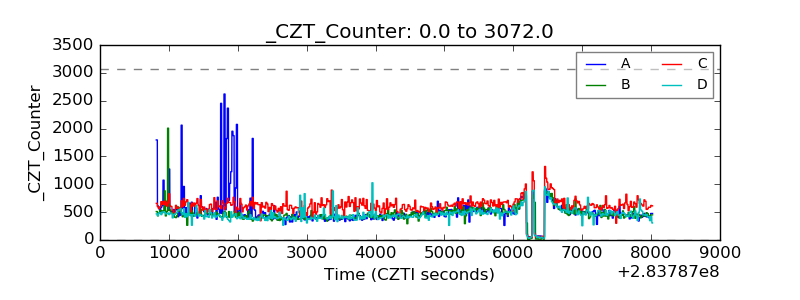 |
| +2.5 Volts monitor |  |
| +5 Volts monitor |  |
| _ROLL_ROT | 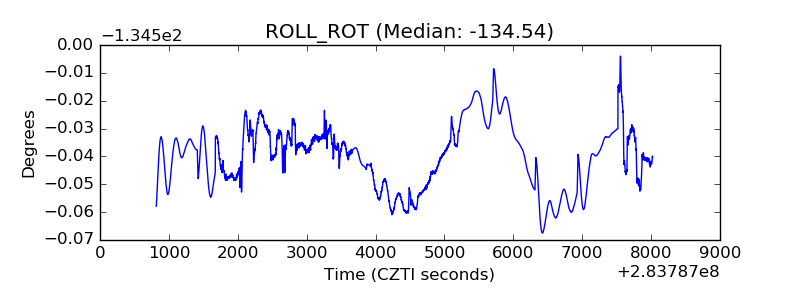 |
| _Roll_DEC | 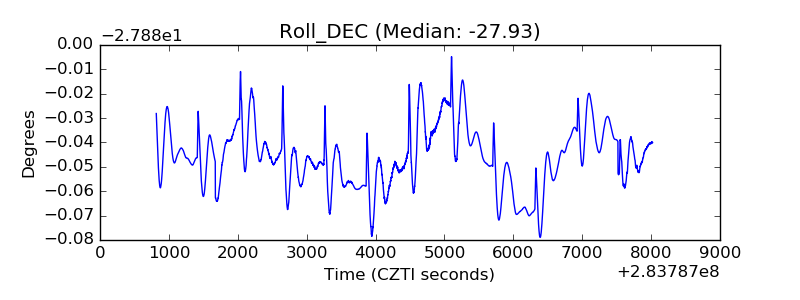 |
| _Roll_RA |  |
| Veto Counter | 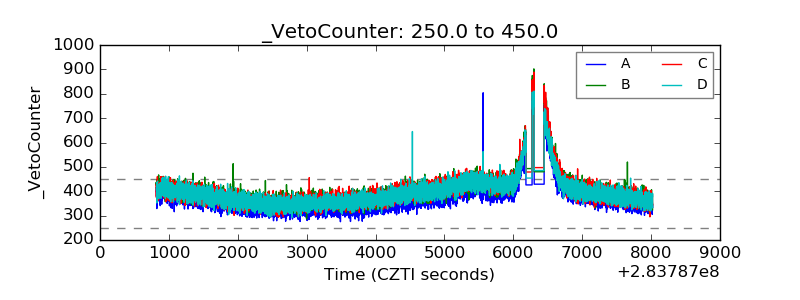 |